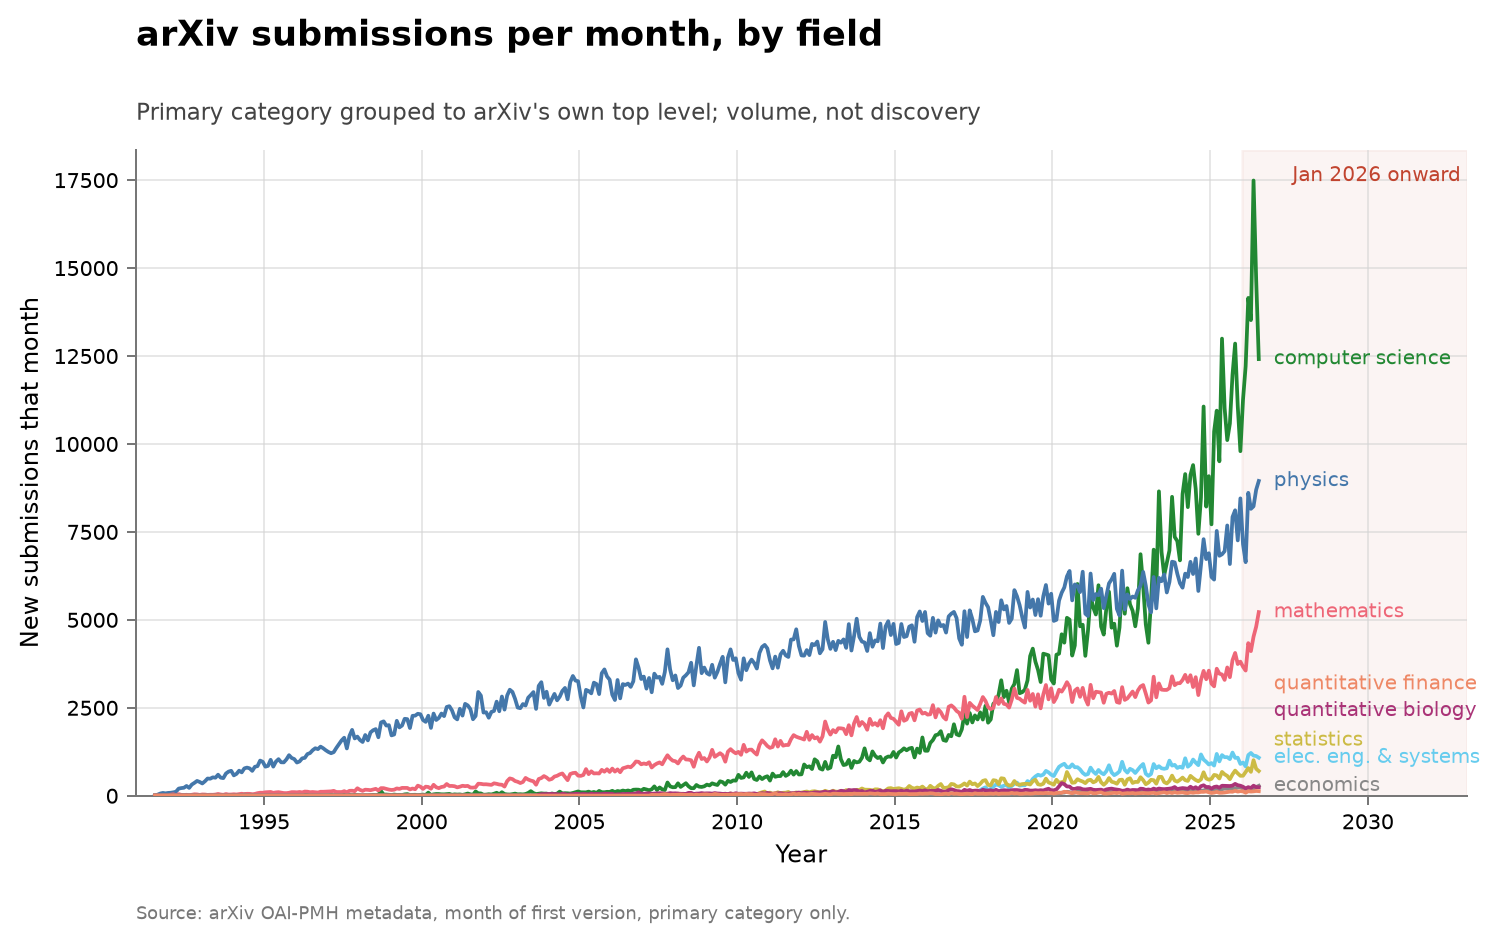
arxiv-by-month.csv; per-category arxiv-categories-by-month.csvPrimary category only, grouped to arXiv's own top level.
Click a legend entry to isolate a subfield; shift-click to compare several. Colours repeat across the thirty-plus series, so the legend, not the hue, identifies a line.
arXiv is a preprint repository for physics, mathematics, computer science and adjacent fields. It publishes its own count of submissions per month, from the archive's opening in July 1991 onward, and its public metadata records each paper's submission history and category labels.
An event in this series is one preprint submitted, counted in its
submission month; the total series is arXiv's published count. The
per-category file counts each paper once, in the month of its first
version's submission date, under its primary (first-listed) category;
categories are grouped to arXiv's own top level, and math-ph sits with
physics because arXiv puts it there. The last row of the monthly file is
the month in progress at fetch time. Neither file carries an authorship
field.
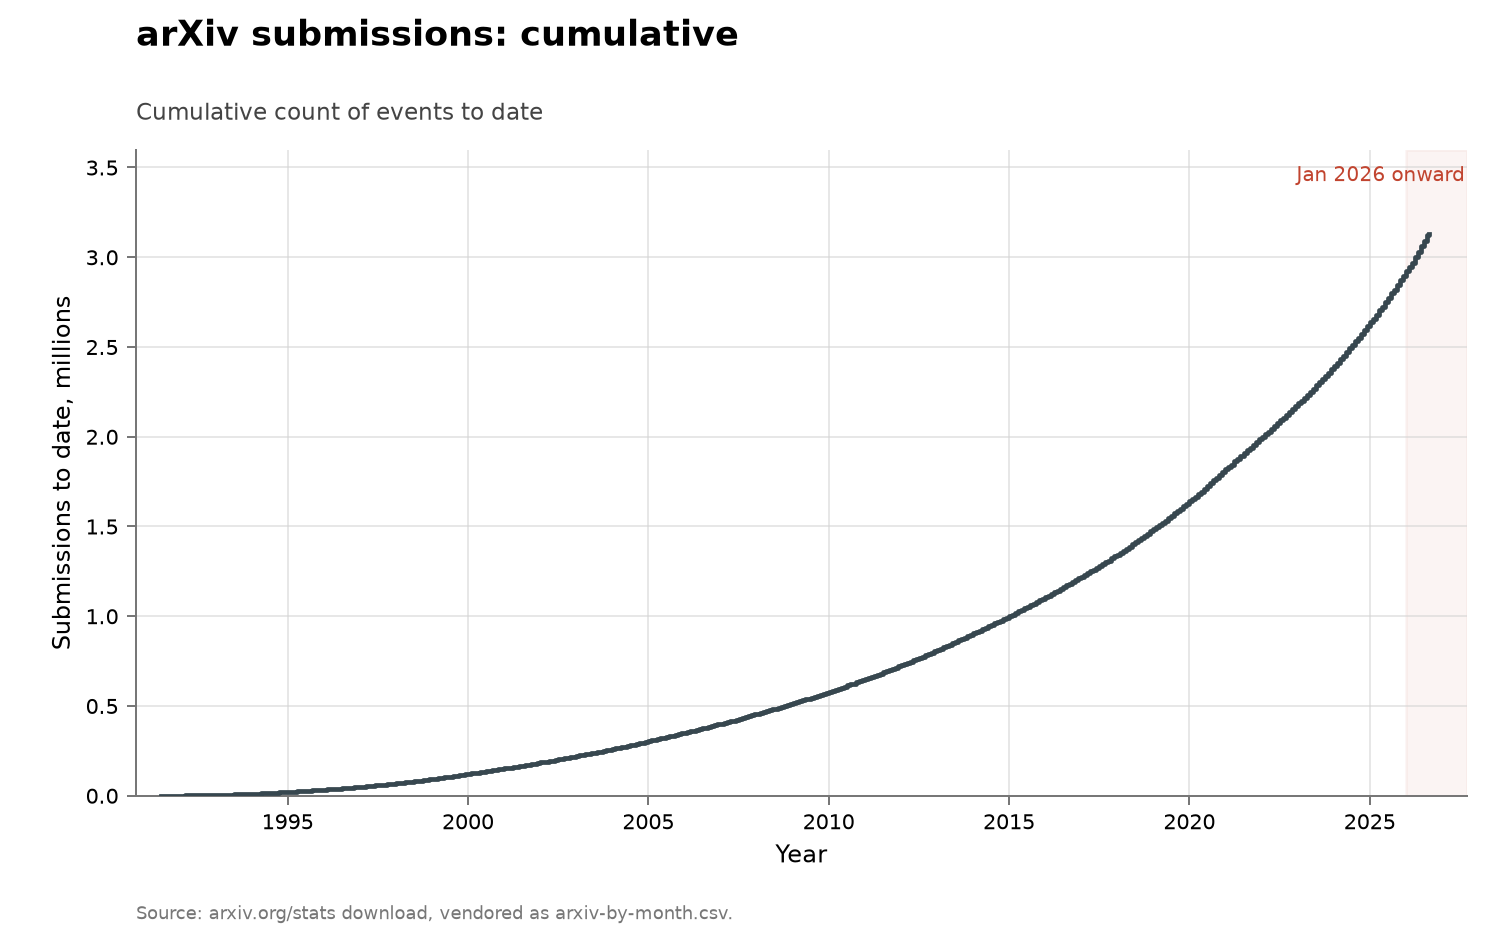
The collection-wide cumulative index redraws this series as cumulative submissions to date:
fetch.py downloads arXiv's own monthly-submissions file and
keeps two columns. The raw download carries a historical_delta column,
nonzero only for corrections to 1991–1997, which is dropped.
The per-category file behind the two field charts is built by
fetch_categories.py, which is run by hand rather
than by make fetch. It counts each paper once, in the month of its first
version's submission date and under its primary (first-listed) category,
and it has two interchangeable inputs: arXiv's official metadata snapshot —
the ~5 GB arxiv-metadata-oai-snapshot.json distributed via Kaggle, which
needs a login to download and is kept beside this document but deliberately
not committed — and a no-credentials OAI-PMH harvest of the same metadata,
which walks about 2,400 resumption pages at the pace arXiv meters out and
takes the better part of a day. Both produce the same aggregation; papers
first submitted after the repository's snapshot date are dropped. A few
dozen migrated records carry v1 dates before arXiv opened in July 1991, and
the charts start at the launch month.
figure.py draws the total series through
lib/families.py's shared volume shape: years on
the x-axis, the count on the y-axis, January 2026 onward shaded, an open
marker on a part period. The three volume folders draw through that one
shape. The series is drawn in slate rather than the blue used elsewhere for
human or uncredited finders because it has no authorship field. The field
grouping and the legacy-archive mapping — alg-geom, q-alg, dg-ga and
funct-an to their modern names, so the older panels keep their
early-1990s history — live at the top of figure.py, and an archive the
mapping does not know fails the build rather than landing in a silent
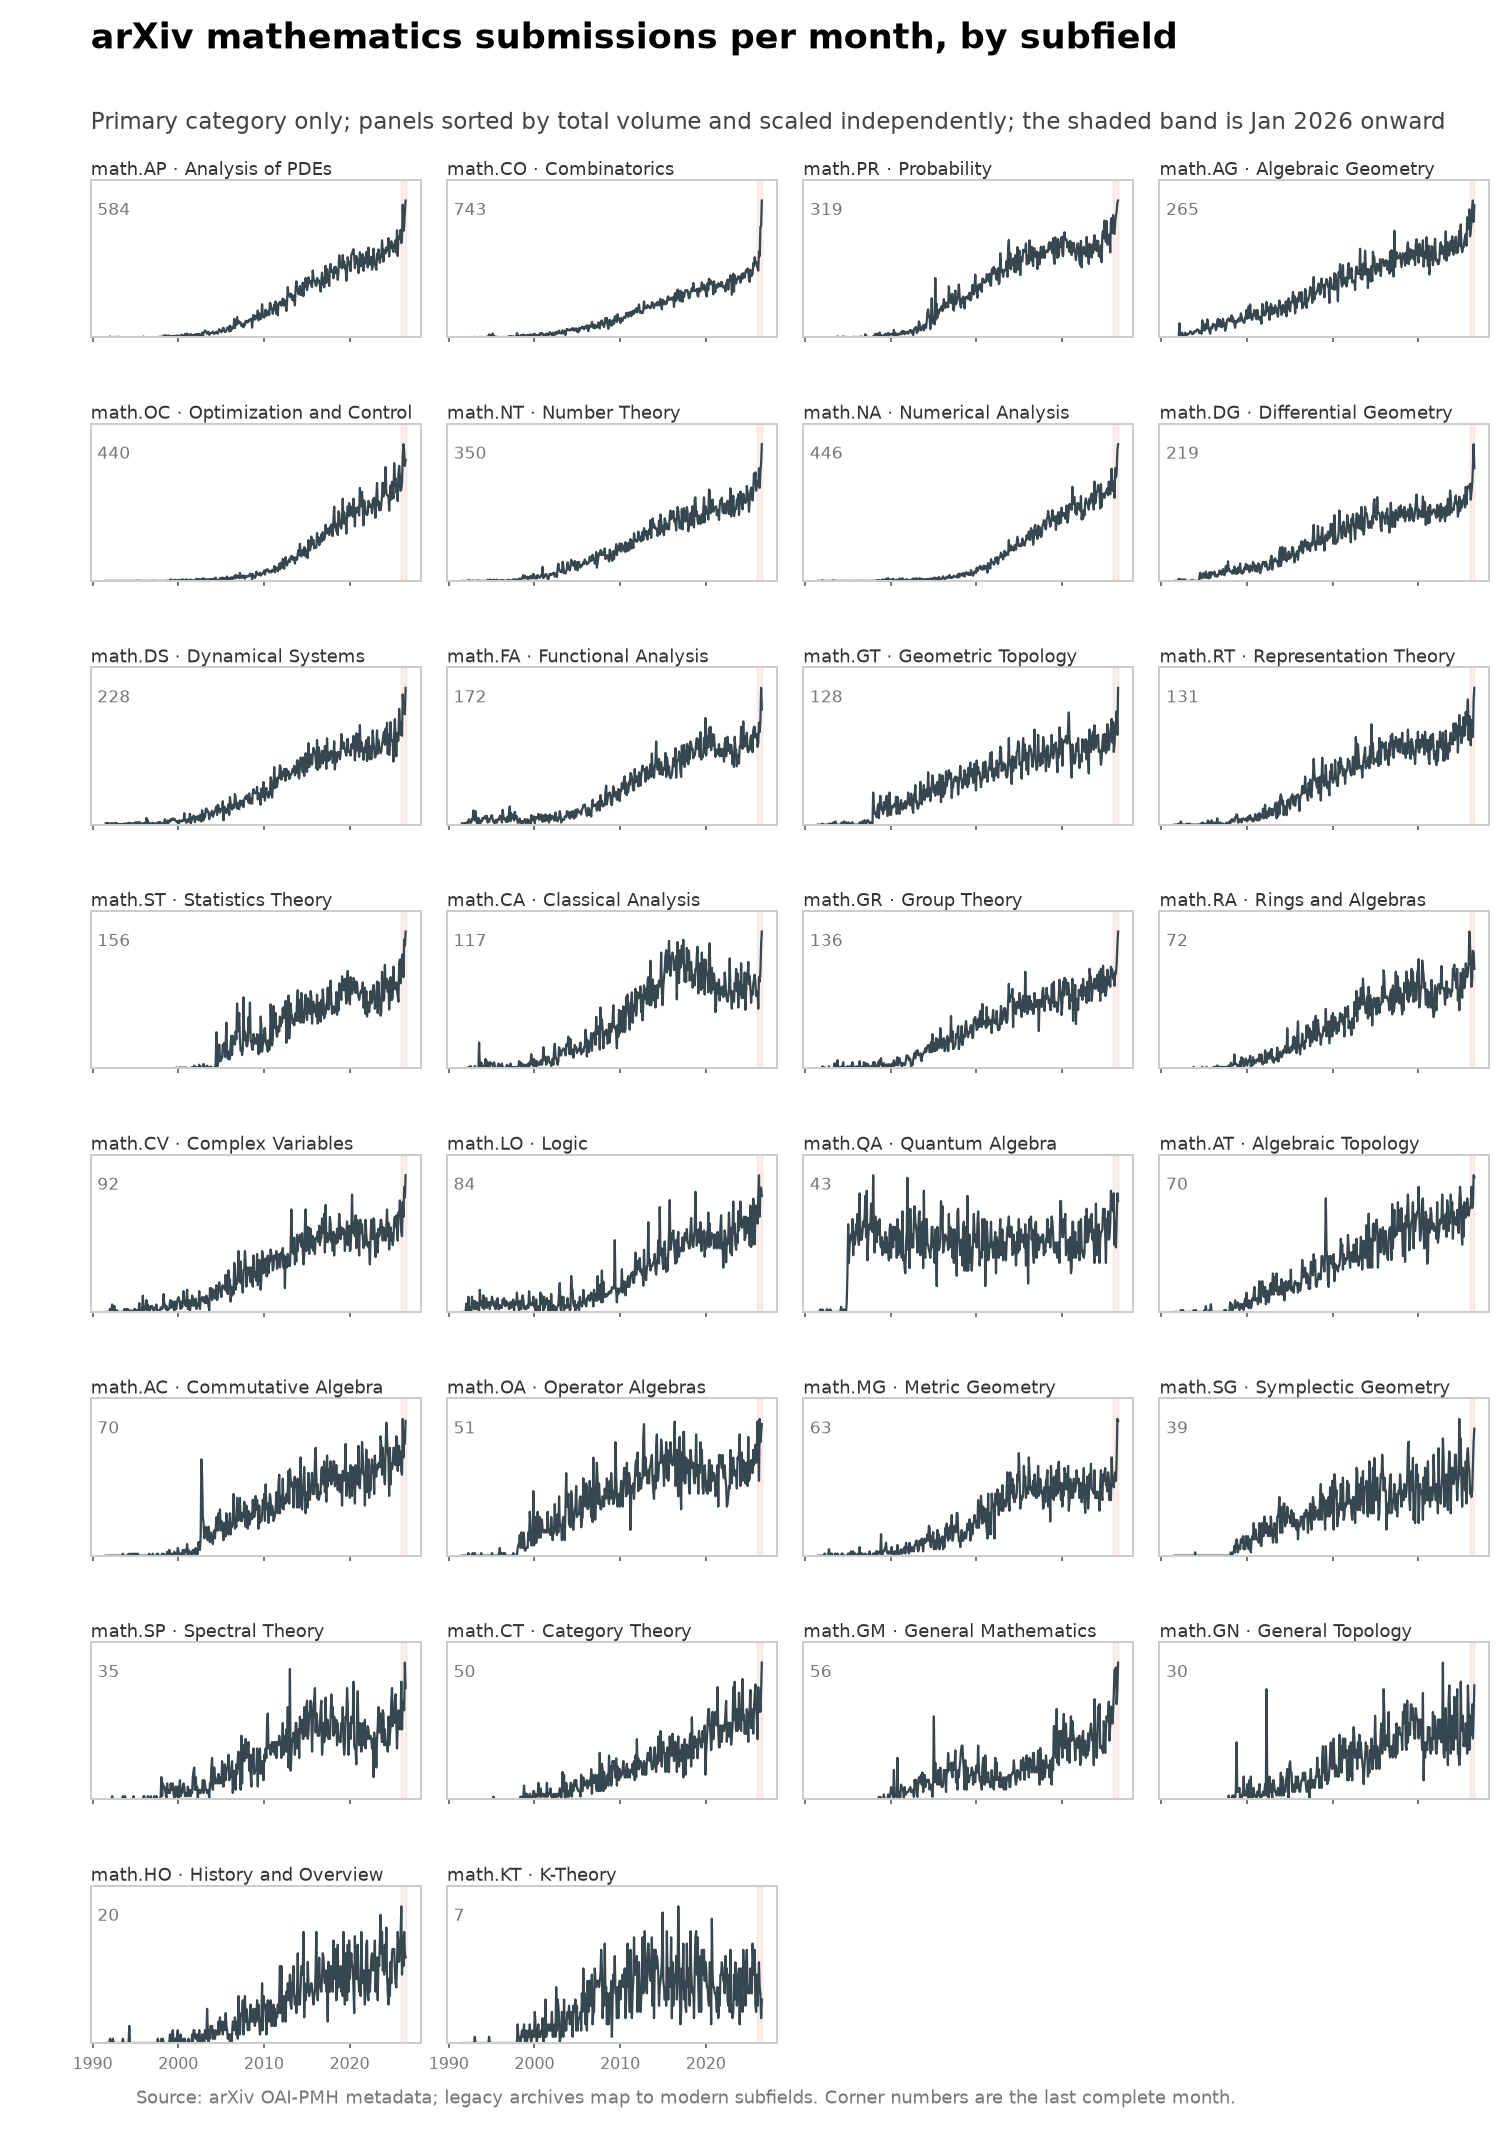
bucket. The subfield grid draws every math.* primary category, one panel
each, sorted by total volume and scaled independently.
check.py recomputes the fact lines from both CSVs.
The dataset carries no authorship field; no AI share can be computed from
it. arxiv-by-month.csv holds a month and a count per
row, and arxiv-categories-by-month.csv
holds a month, a category and a count; no AI credit appears in either
vendored file or in arXiv's published monthly-submissions series as of the
2026-08 fetch.
arxiv-by-month.csv.arxiv-categories-by-month.csv.