Cumulative progress

Every series in the collection, redrawn in one format: a single step function of progress to date. Rising lines are cumulative counts of events — disclosures, resolutions, record steps, submissions. Where a series has a known denominator, the line instead counts what remains and declines toward zero: open problems on a fixed list, unproven instances in a fixed cohort. Where a series tracks a standing record, the staircase is the record's own value, and the panel says which direction is better.

The format trades information for comparability. The README index keeps each series' native view — attribution splits, severity cuts, partial-year markers; these panels are one slate line each, so that a difference between two of them is a difference in the data rather than in how it was plotted. Each chart is drawn by its own folder's figure.py from the same vendored CSVs, and the tables below are regenerated by make index alongside the README's.

Vulnerabilities

Series Chart
curl vulnerability disclosures
Metric: vulnerabilities disclosed per quarter,
split by whether the finder credit carries an
AI marker
Coverage: 2000–2026, partial through
2026-06-24
Acceleration? 📈 accelerating — 36 disclosures
through 2026-06-24 annualize to roughly 75
against 9 in 2025 and a 13.1/year mean over
2014–2023
Discussion · Data · Source · Interactive
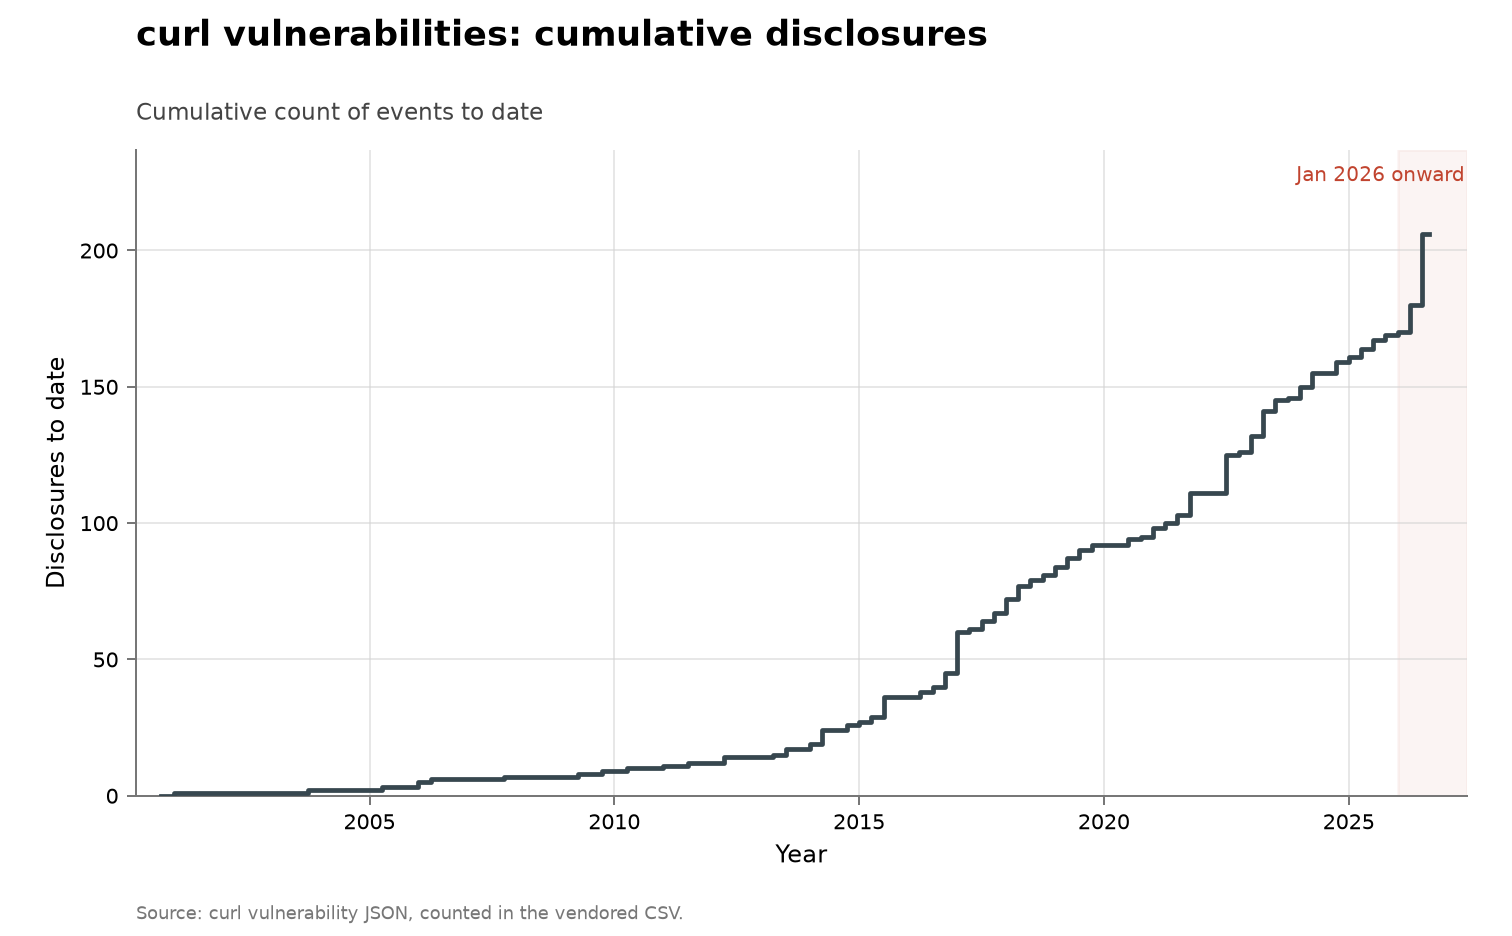
curl vulnerability disclosures, cumulative view
Firefox vulnerability disclosures
Metric: distinct CVEs per quarter, split by
whether the reporter credit names an AI
method, an AI-security employer, a fuzzer, or
none of these; advisory–CVE mentions retained
as a sensitivity count
Coverage: 2016–2026, partial through
2026-08-04, the latest advisory in the
snapshot
Acceleration? 📈 accelerating — 342 distinct
CVEs through 2026-08-04 against 210 in 2025;
the part year alone is 1.6 times the 2025 full
year
Discussion · Data · Source · Interactive
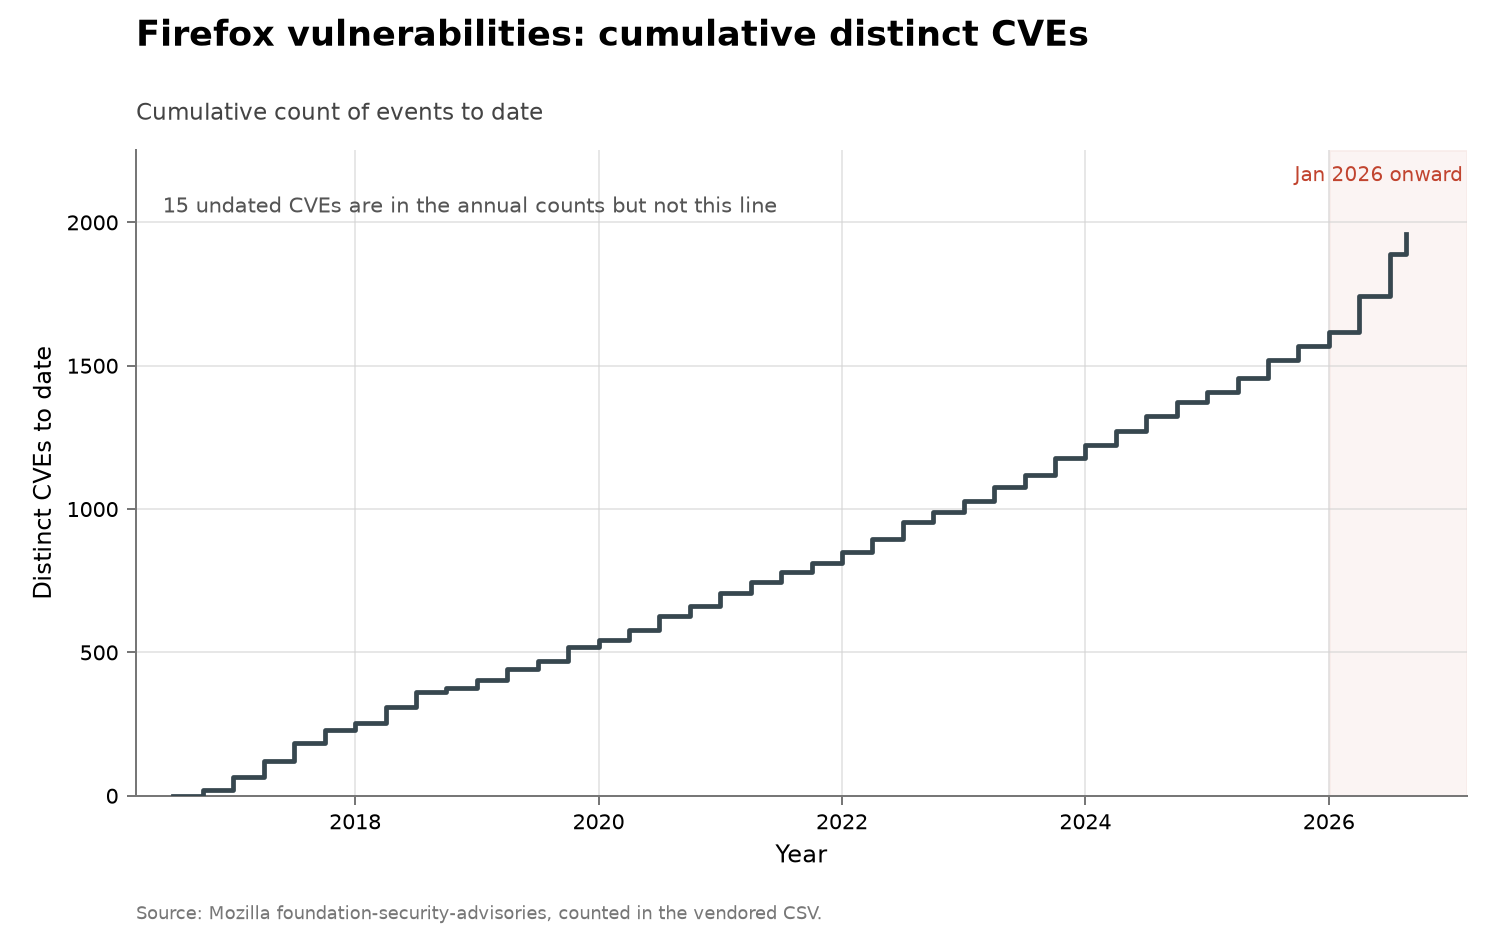
Firefox vulnerability disclosures, cumulative view
All software: vulnerabilities known exploited
Metric: CVEs added per quarter to CISA's Known
Exploited Vulnerabilities catalogue
Coverage: 2021–2026, from the catalogue's
November 2021 launch, partial through
2026-08-10
Acceleration? ➡️ no acceleration — 178
additions through 2026-08-10 annualize to
about 293 against 245 in 2025 and a 206/year
mean over 2023–2025
Discussion · Data · Source · Interactive
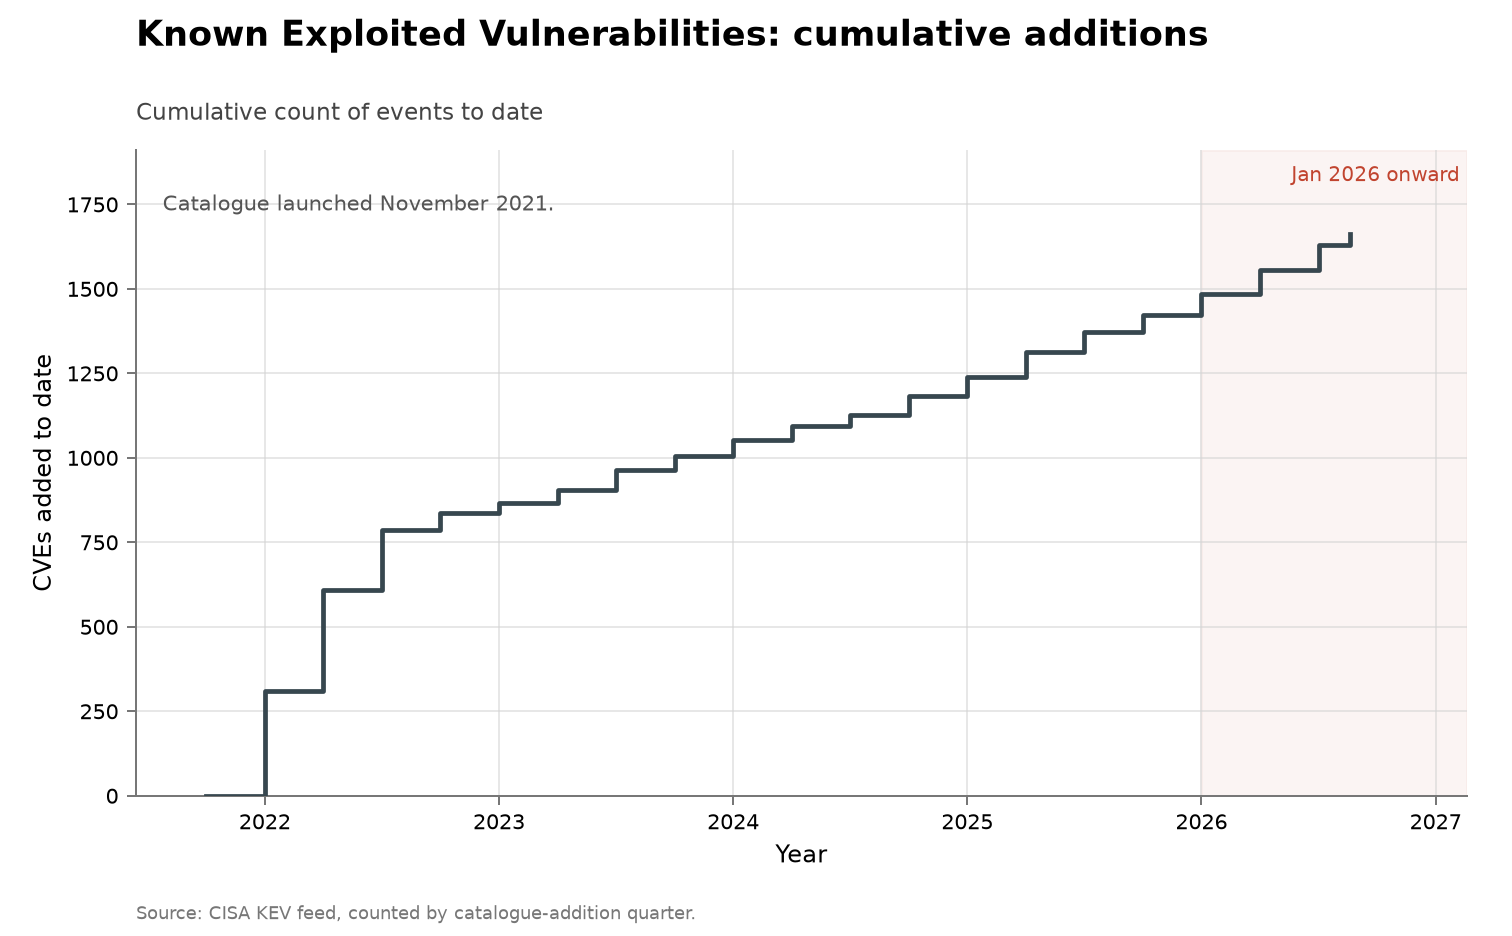
All software: vulnerabilities known exploited, cumulative view
Microsoft security-update CVEs
Metric: CVEs issued by Microsoft's own CNA per
month, dated by first publication in the
Security Update Guide, split by whether an
acknowledgment credit names an AI method, an
AI-security employer, a fuzzer, or none of
these
Coverage: 2016–2026, partial through
2026-08-11; no February or March 2016 document
exists upstream, so the first year is ten
months
Acceleration? 📈 accelerating — 1,927 CVEs
through 2026-08-11 against 1,243 in 2025; the
part year annualizes to about 2.5 times 2025
Discussion · Data · Source · Interactive
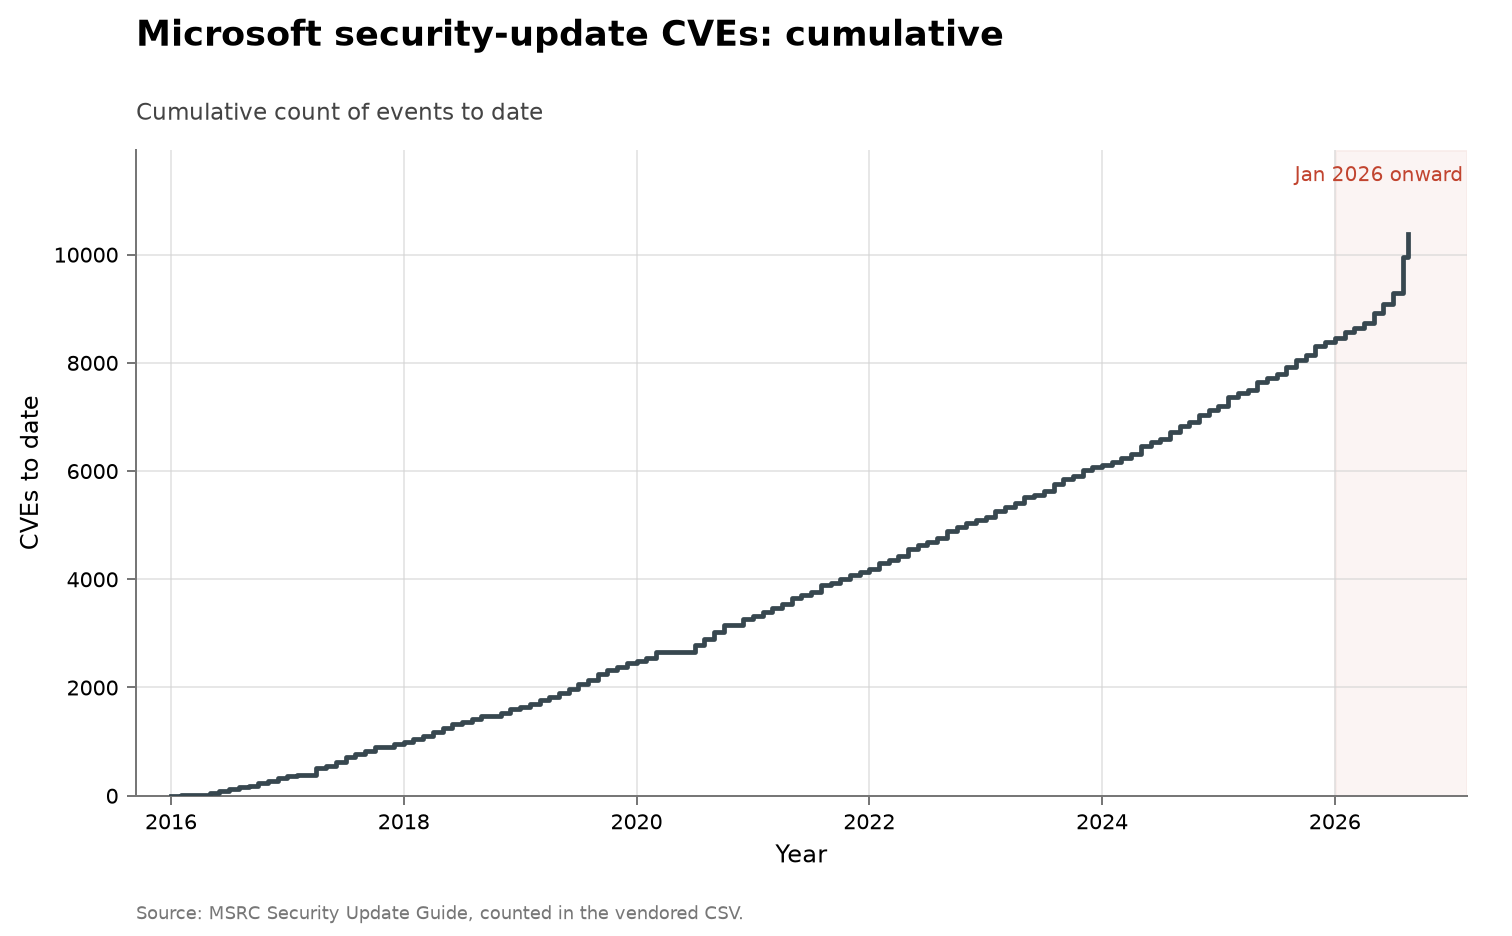
Microsoft security-update CVEs, cumulative view
All software: vulnerabilities disclosed
Metric: CVEs published per quarter in the US
National Vulnerability Database
Coverage: 2016–2026, partial through
2026-08-10
Acceleration? 📈 accelerating — 49,838 CVEs
through 2026-08-10 annualize to about 82,000,
roughly 1.6 times 2025's 49,972, after +32%
growth into 2024 and +23% into 2025
Discussion · Data · Source · Interactive
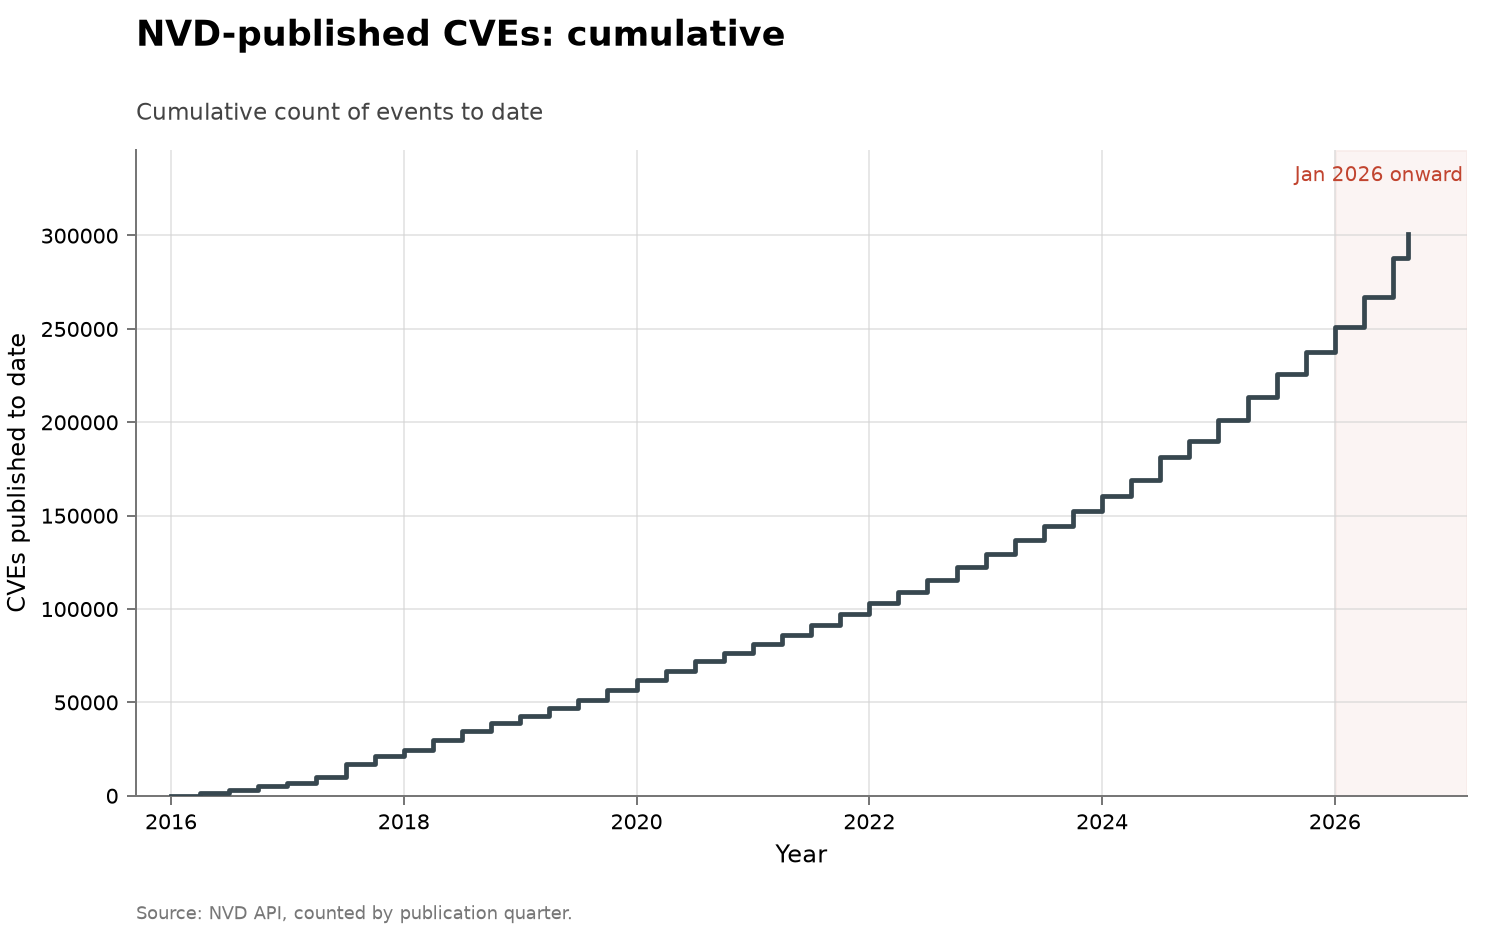
All software: vulnerabilities disclosed, cumulative view
OpenSSL vulnerability disclosures
Metric: vulnerabilities disclosed per quarter,
split by finder provenance: corroborated AI
method, AI affiliation with method unverified,
conventional or fuzzing credit, or no reporter
credit
Coverage: 2002–2026, partial through
2026-08-05
Acceleration? 📈 accelerating — 39 CVEs by
2026-08-05 against 6 in all of 2025; the
largest prior full years were 35 in 2016 and
32 in 2015
Discussion · Data · Source · Interactive
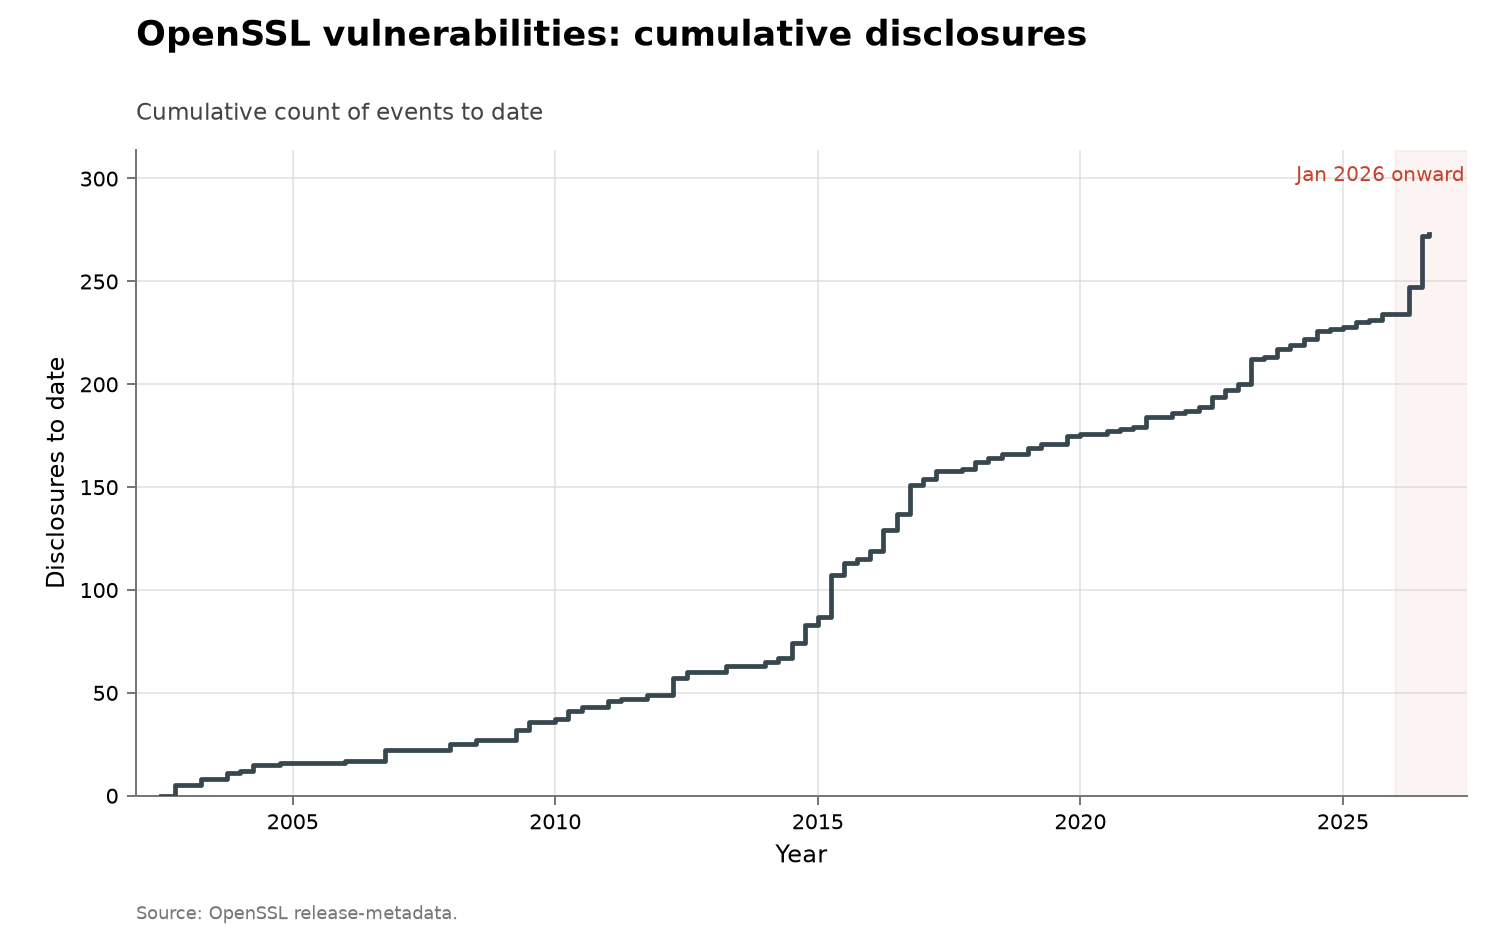
OpenSSL vulnerability disclosures, cumulative view
OSS-Fuzz vulnerability discoveries
Metric: vulnerability records published per
quarter by an automated fuzzing programme
Coverage: 2020–2026, partial through
2026-08-10
Acceleration? 📉 declining — 1,041 records in
2020 to 244 in 2025; 2026 annualizes to
roughly 396
Discussion · Data · Source · Interactive
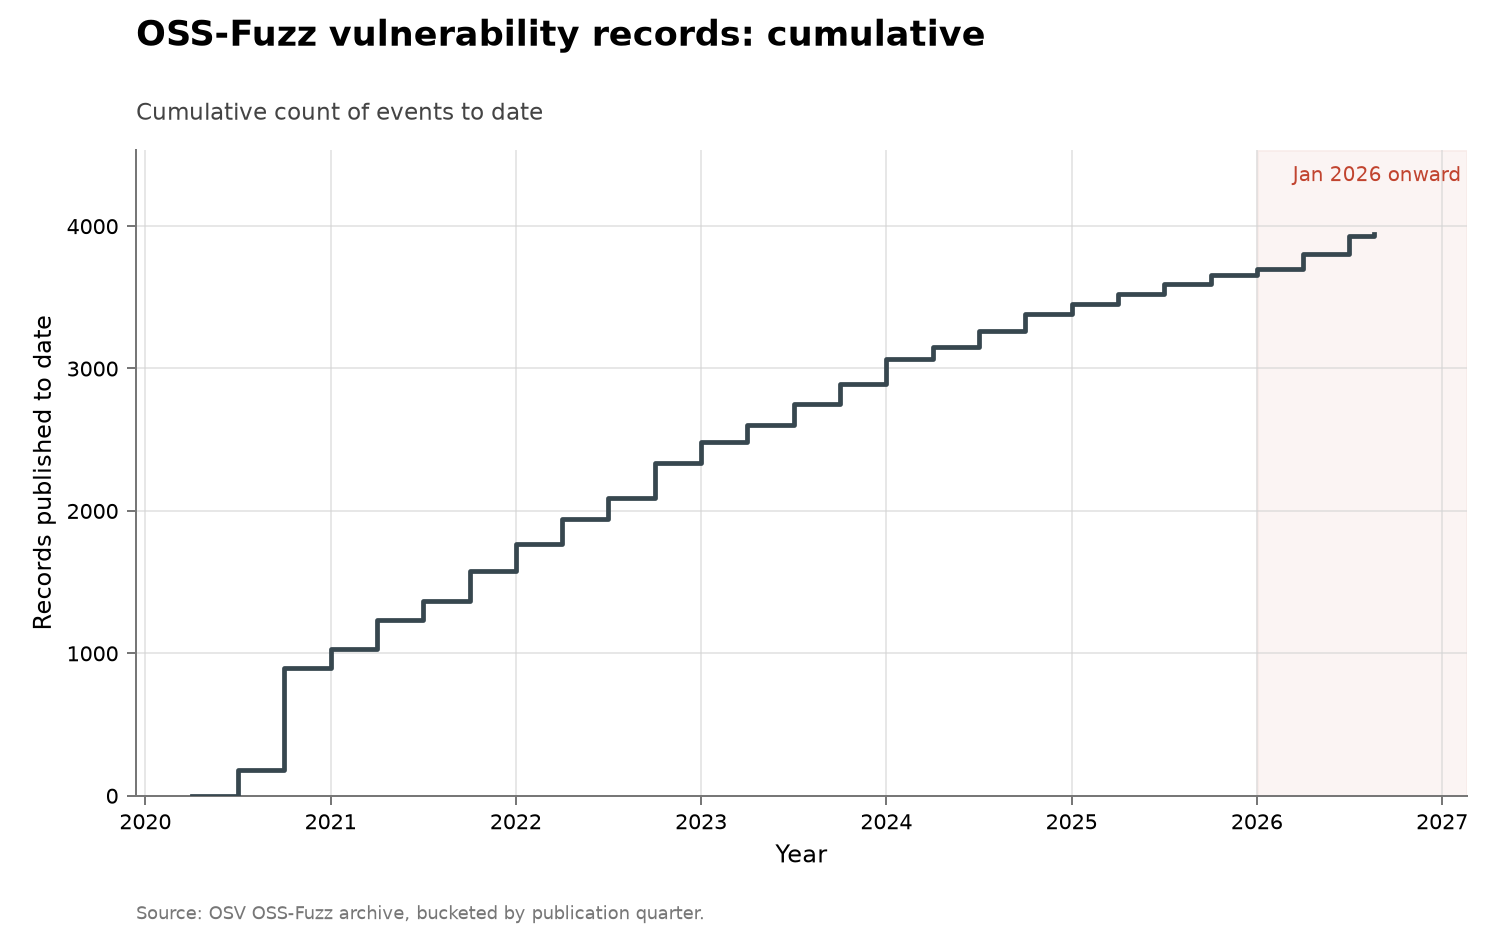
OSS-Fuzz vulnerability discoveries, cumulative view
Open-source CVEs represented in OSV
Metric: distinct CVE IDs linked to at least
one active affected-package record in OSV, per
quarter by earliest OSV publication date
Coverage: 2016–2026, partial through
2026-08-10
Acceleration? 📈 accelerating — 21,321 distinct
CVEs through 2026-08-10 annualize to about
35,100, 2.3 times 2025's 15,146
Discussion · Data · Source · Interactive
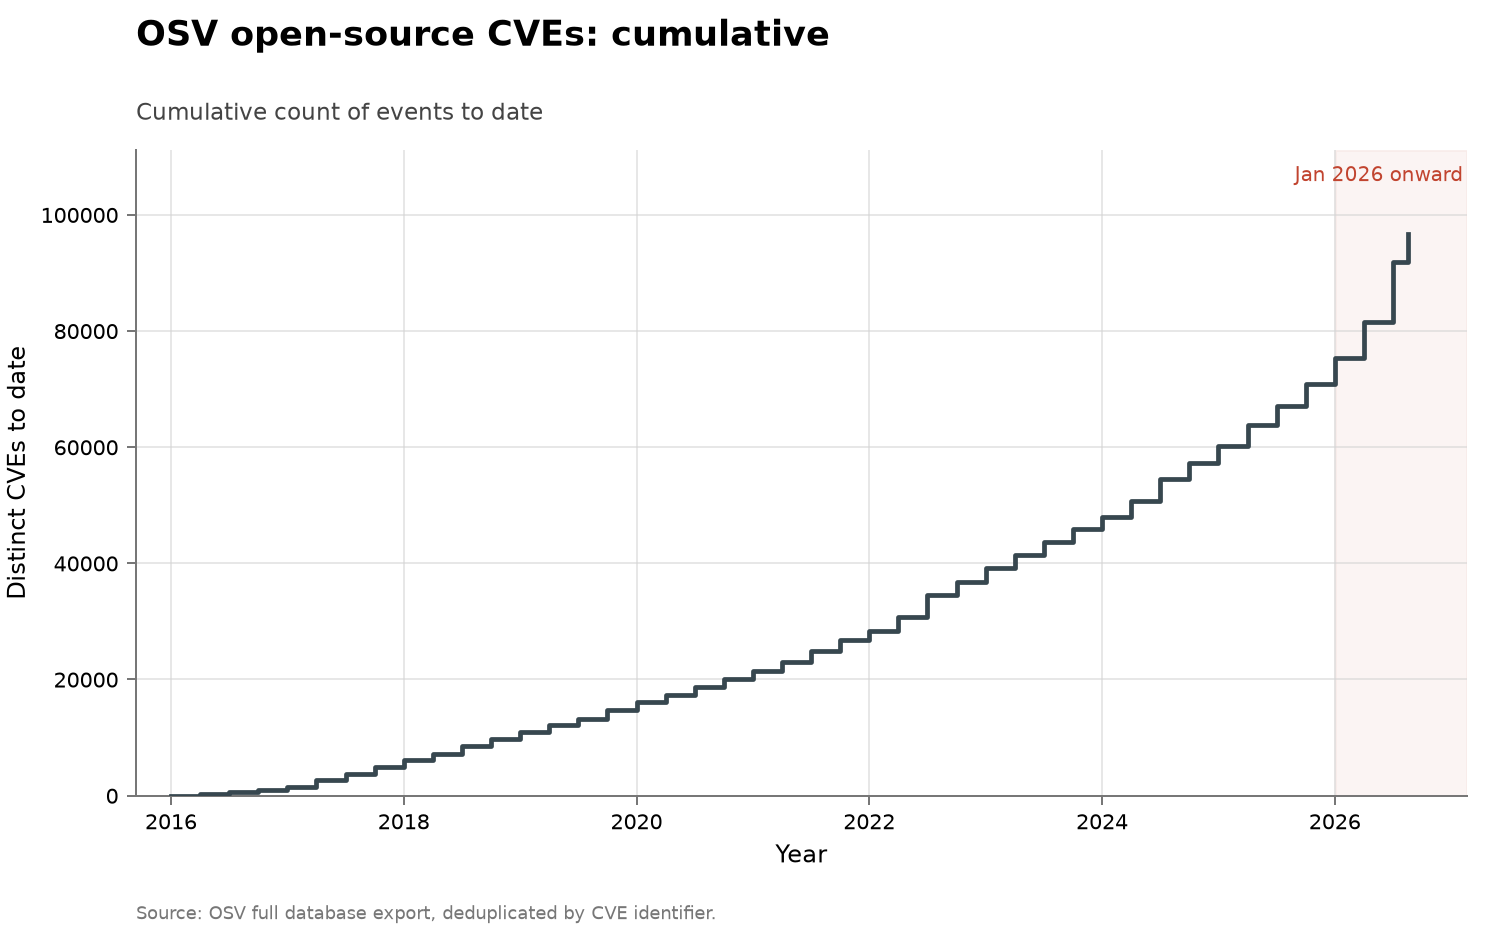
Open-source CVEs represented in OSV, cumulative view

Open problems

Series Chart
Erdős problems catalogue
Metric: problems catalogued, statuses marked
solved, and statements formalized in Lean, at
monthly site snapshots; plus an imputed
solution year per solved problem
Coverage: thirteen monthly snapshots,
2025-08-31 to 2026-08-10; imputed solution
years 1940–2026
Acceleration? ❓ inconclusive — 55 imputed
resolutions in 2026 through 2026-08-10,
against 33 in 2025 and a 5.9/year mean over
2000–2023
Discussion · Data · Source · Interactive
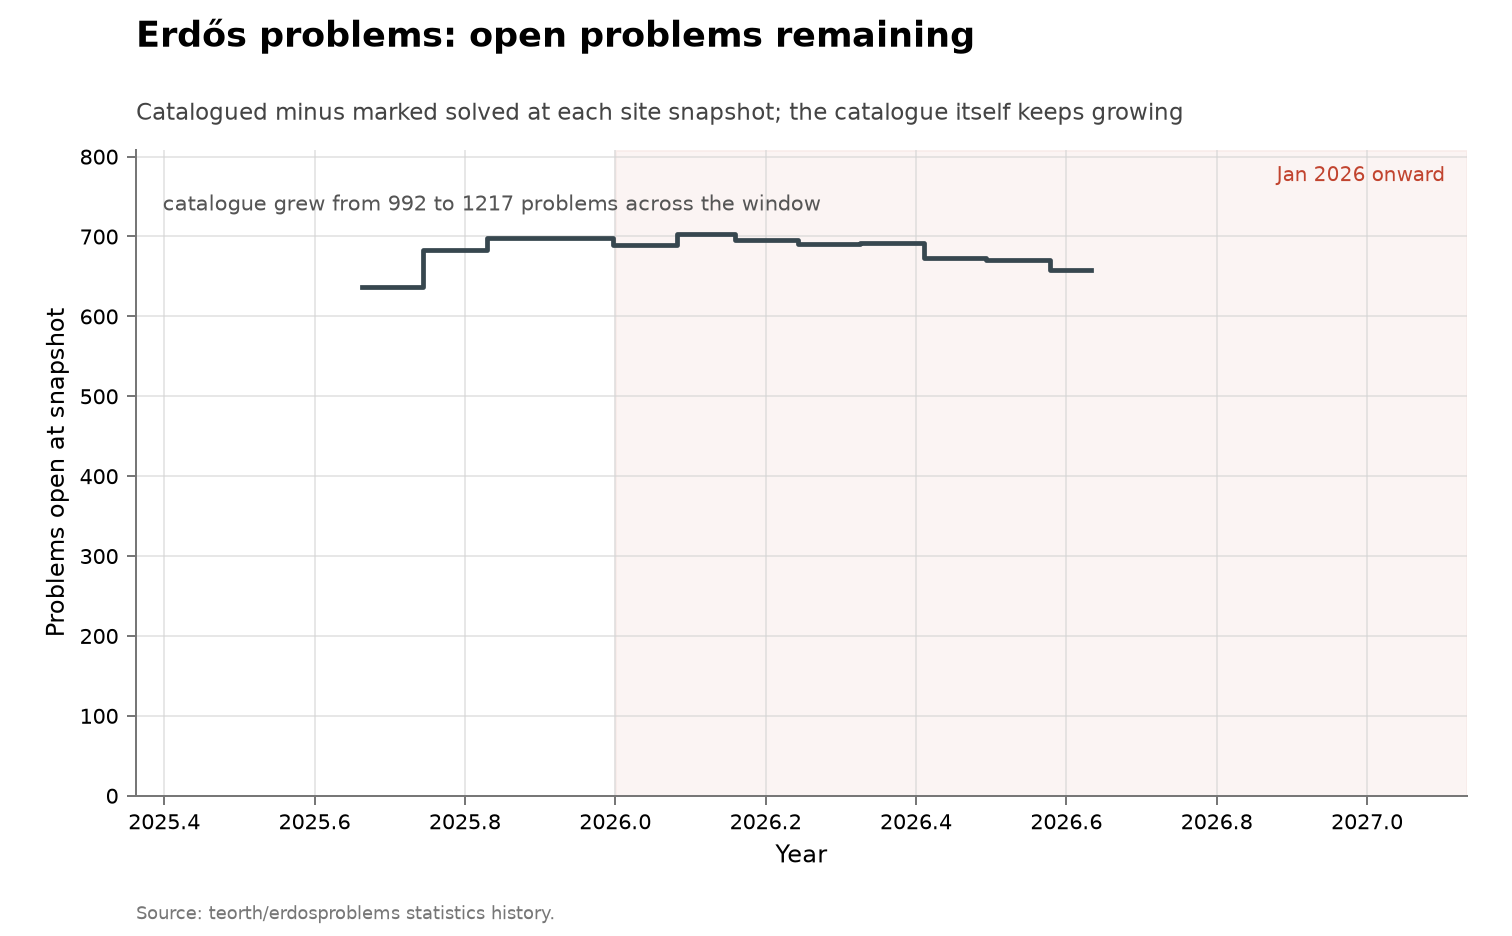
Erdős problems catalogue, cumulative view
Top 10 Erdős problems
Metric: dated resolutions per year across 12
scored rows
Coverage: list posed 2026-04-16; dated
resolutions 1975–2026; statuses read
2026-08-14
Acceleration? ❓ inconclusive — 1 resolution in
2026 against 3 in the 90 years since 1936; a
series this small sets no rate
Discussion · Data · Source · Interactive
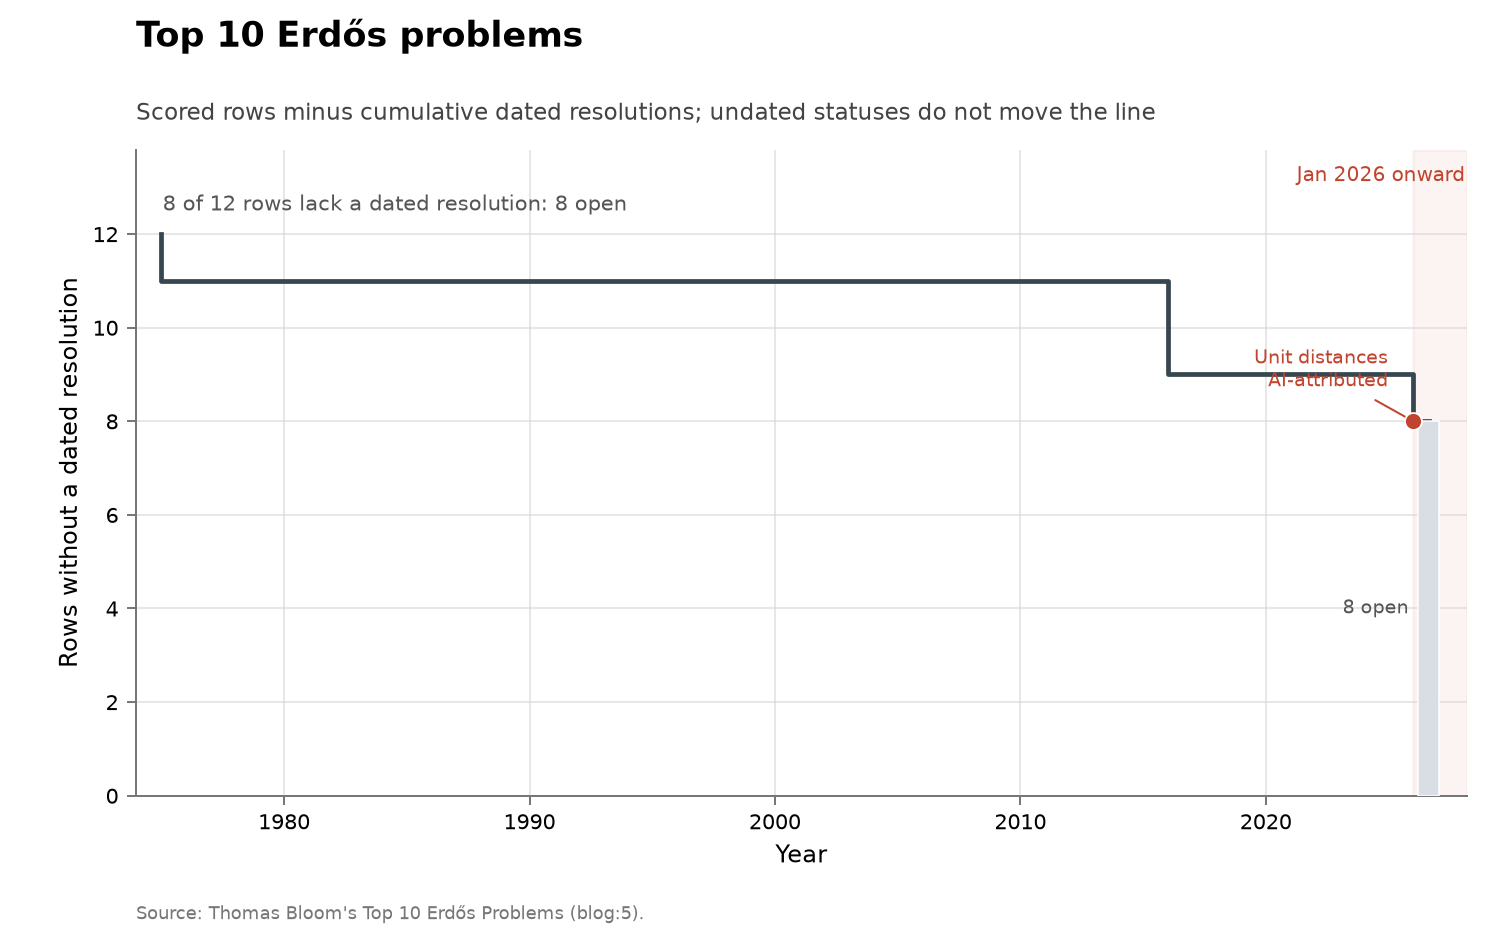
Top 10 Erdős problems, cumulative view
FrontierMath Open Problems
Metric: dated solution events on Epoch AI's
pool of open research problems, placed by
curator-assigned notability tier
Coverage: benchmark announced 2026-02-26;
pages read 2026-08-14, with recorded solves
from 2026-03-23 to 2026-08-12
Acceleration? ⏳ too early — 6 dated solves
between 2026-03-23 and 2026-08-12; the pool
was announced 2026-02-26 and no prior-year
rate exists
Discussion · Data · Source · Interactive
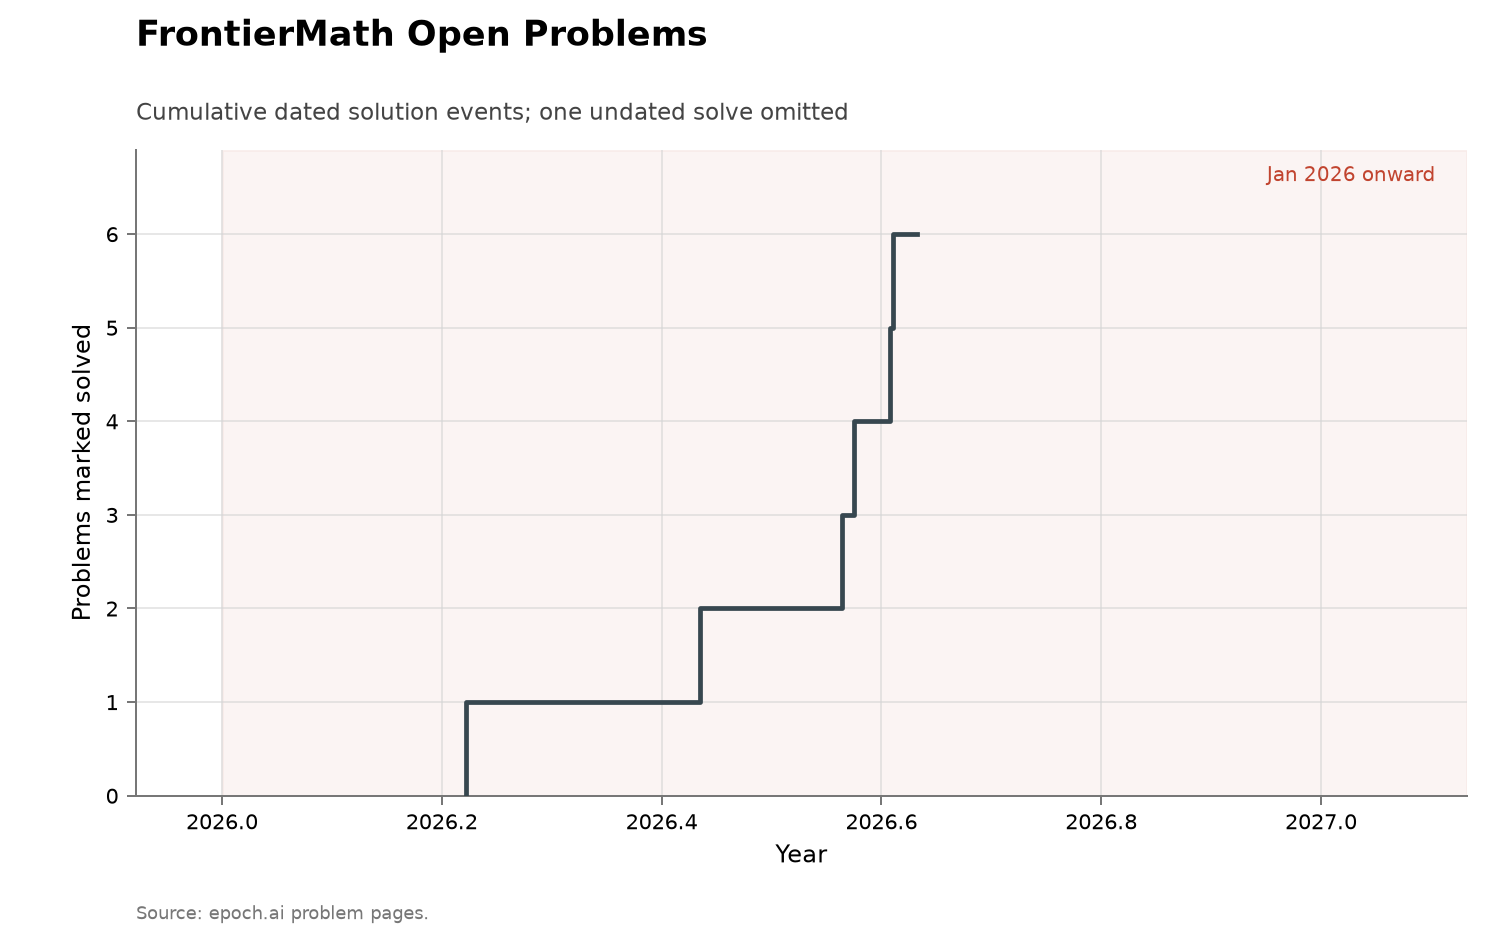
FrontierMath Open Problems, cumulative view
Ben Green's 100 open problems
Metric: dated resolutions per year across 101
scored rows
Coverage: 2018–2026; statuses as the December
2025 revision records them, read 2026-08-13;
dated resolutions 2019–2025
Acceleration? ➡️ no acceleration — 0 dated
resolutions in 2026 against 3 in 2025 and a
1.9/year mean over 2019–2025
Discussion · Data · Source · Interactive
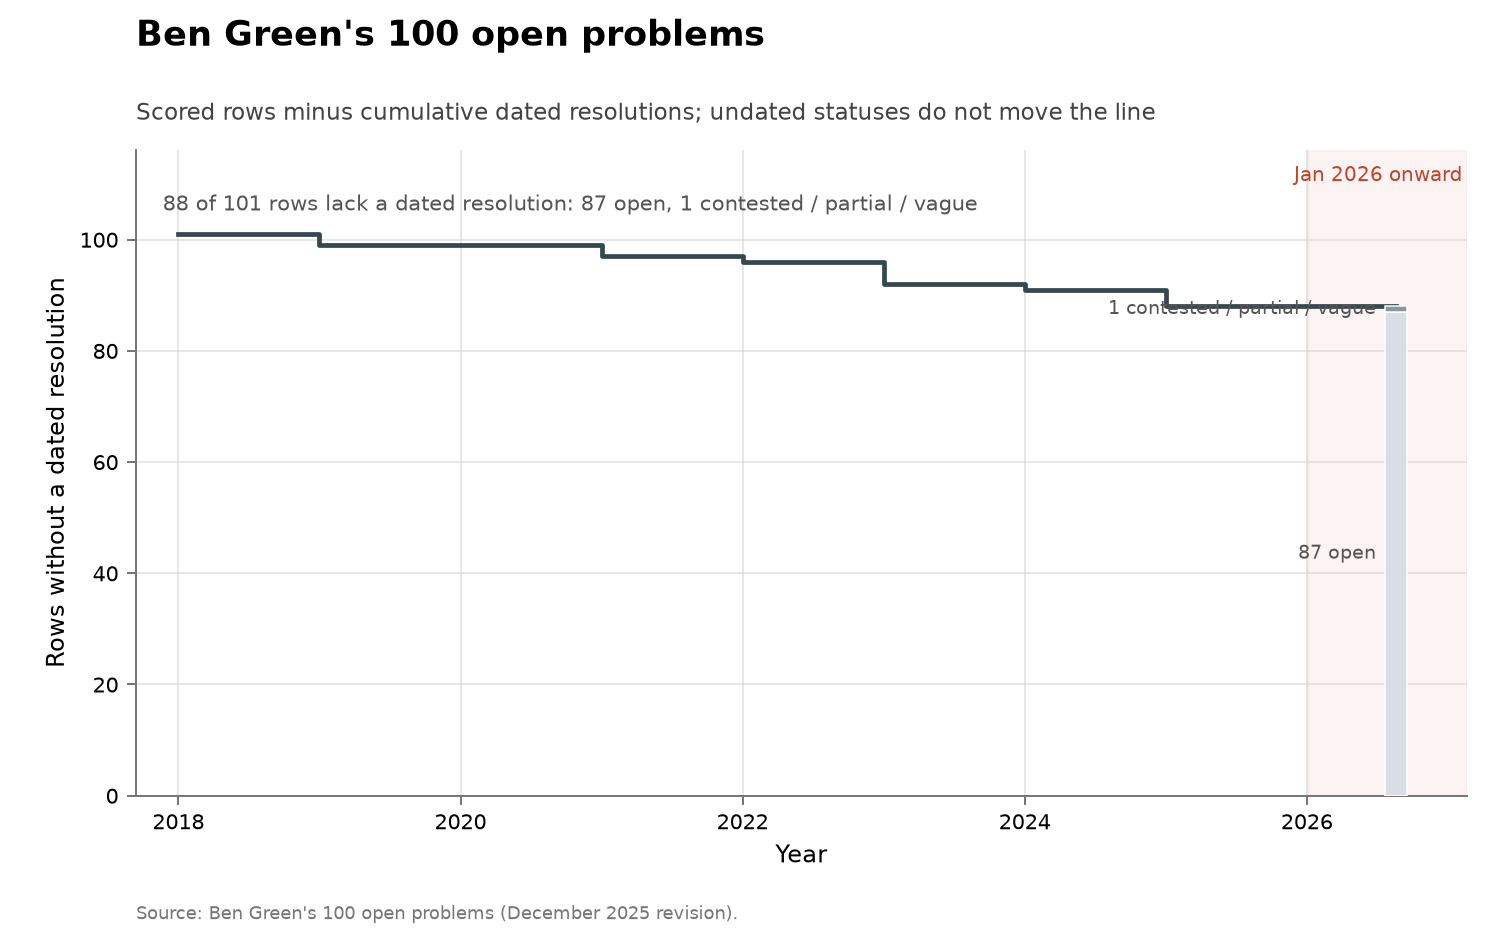
Ben Green's 100 open problems, cumulative view
Hilbert's problems
Metric: dated resolutions per year across 28
scored rows
Coverage: list posed 1900; dated resolutions
1900–1998; statuses read 2026-08-14
Acceleration? ➡️ no acceleration — 0
resolutions in 2026 and 0 since 1998; 12 dated
resolutions over 1900–1998
Discussion · Data · Source · Interactive
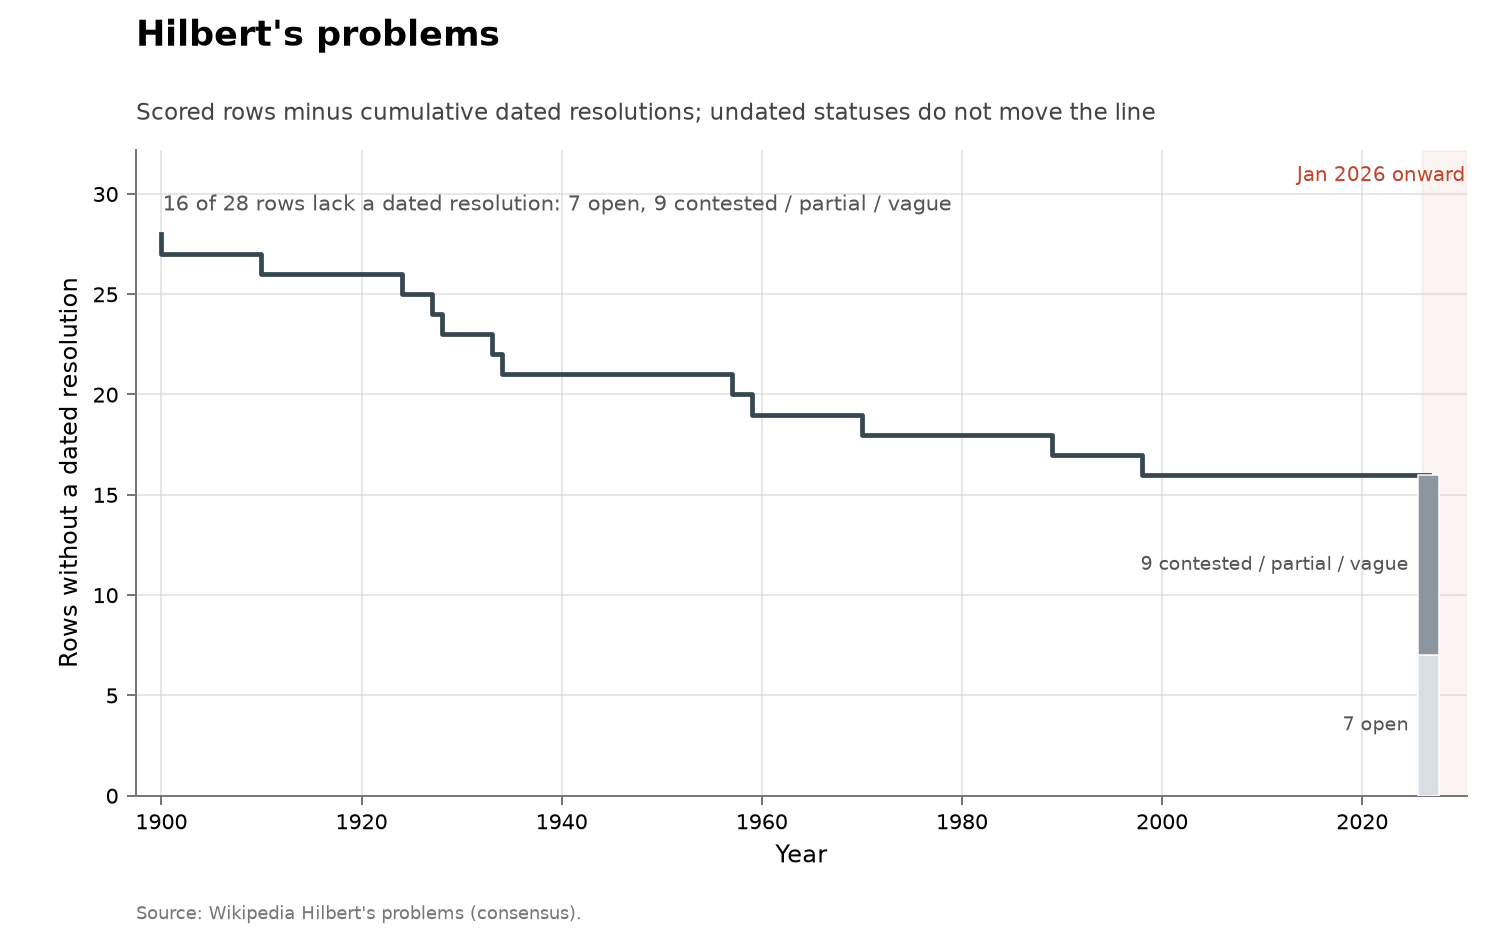
Hilbert's problems, cumulative view
Landau's problems
Metric: dated resolutions per year across 4
scored rows
Coverage: list posed 1912; no dated resolution
1912–2026; statuses read 2026-08-14
Acceleration? ➡️ no acceleration — 0
resolutions in 2026; 0 dated resolutions over
1912–2025
Discussion · Data · Source · Interactive
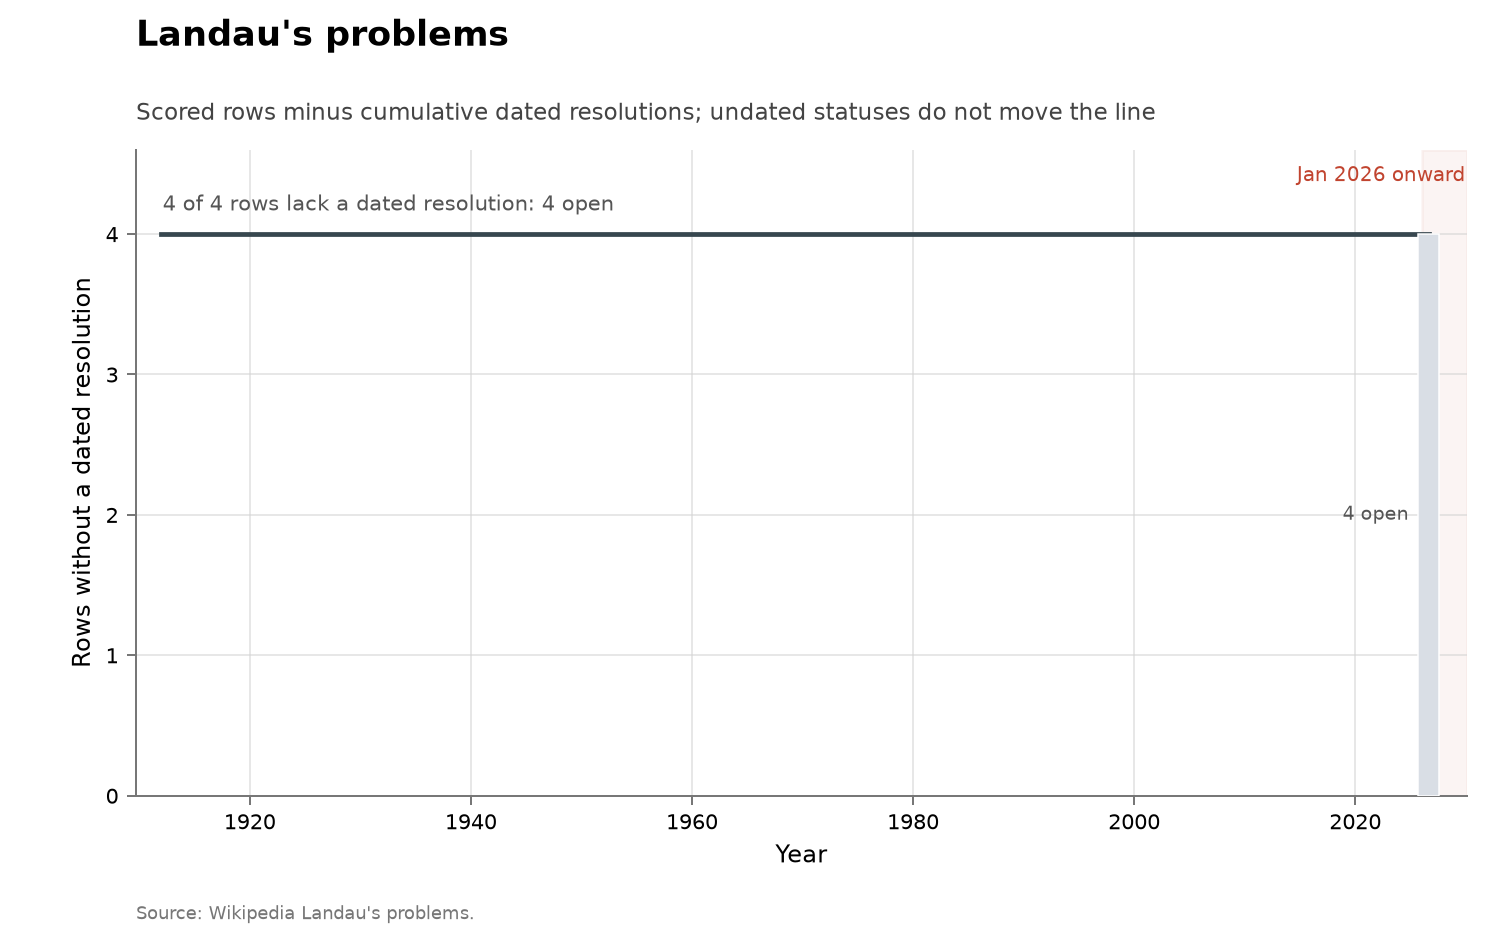
Landau's problems, cumulative view
Millennium Prize Problems
Metric: dated resolutions per year across 7
scored rows
Coverage: list posed 2000; one dated
resolution, 2003; statuses read 2026-08-14
Acceleration? ➡️ no acceleration — 0
resolutions in 2026; 1 dated resolution (2003)
over 2000–2025
Discussion · Data · Source · Interactive
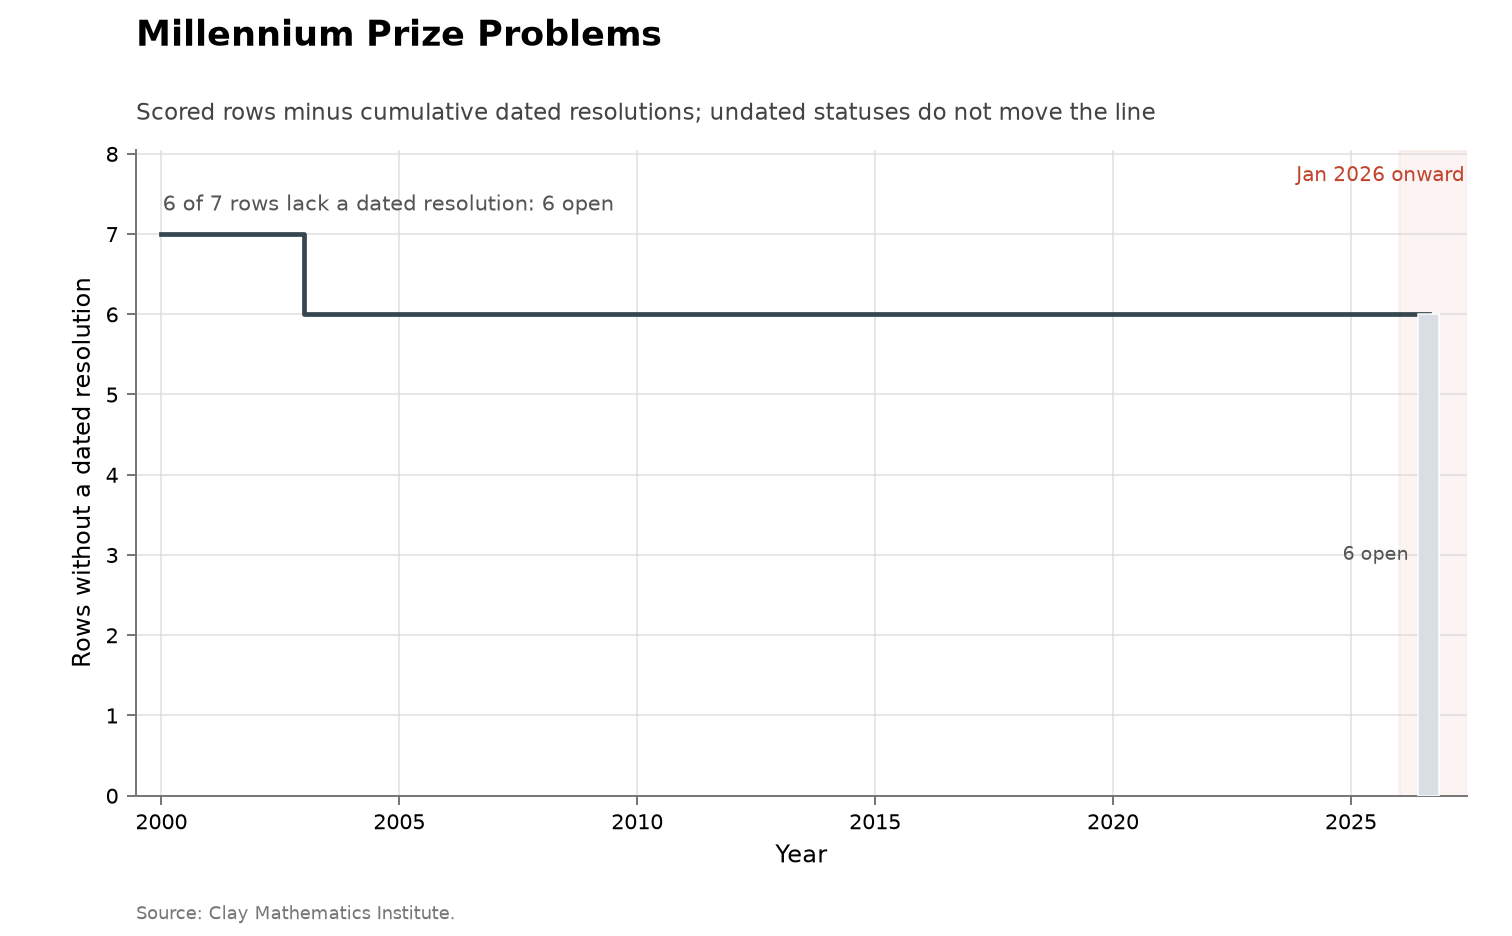
Millennium Prize Problems, cumulative view
Smale's problems
Metric: dated resolutions per year across 19
scored rows
Coverage: list posed 1998; dated resolutions
2002–2026; statuses read 2026-08-14
Acceleration? ❓ inconclusive — 1 resolution in
2026 against 4 over 2002–2016; a series of 5
events sets no rate
Discussion · Data · Source · Interactive
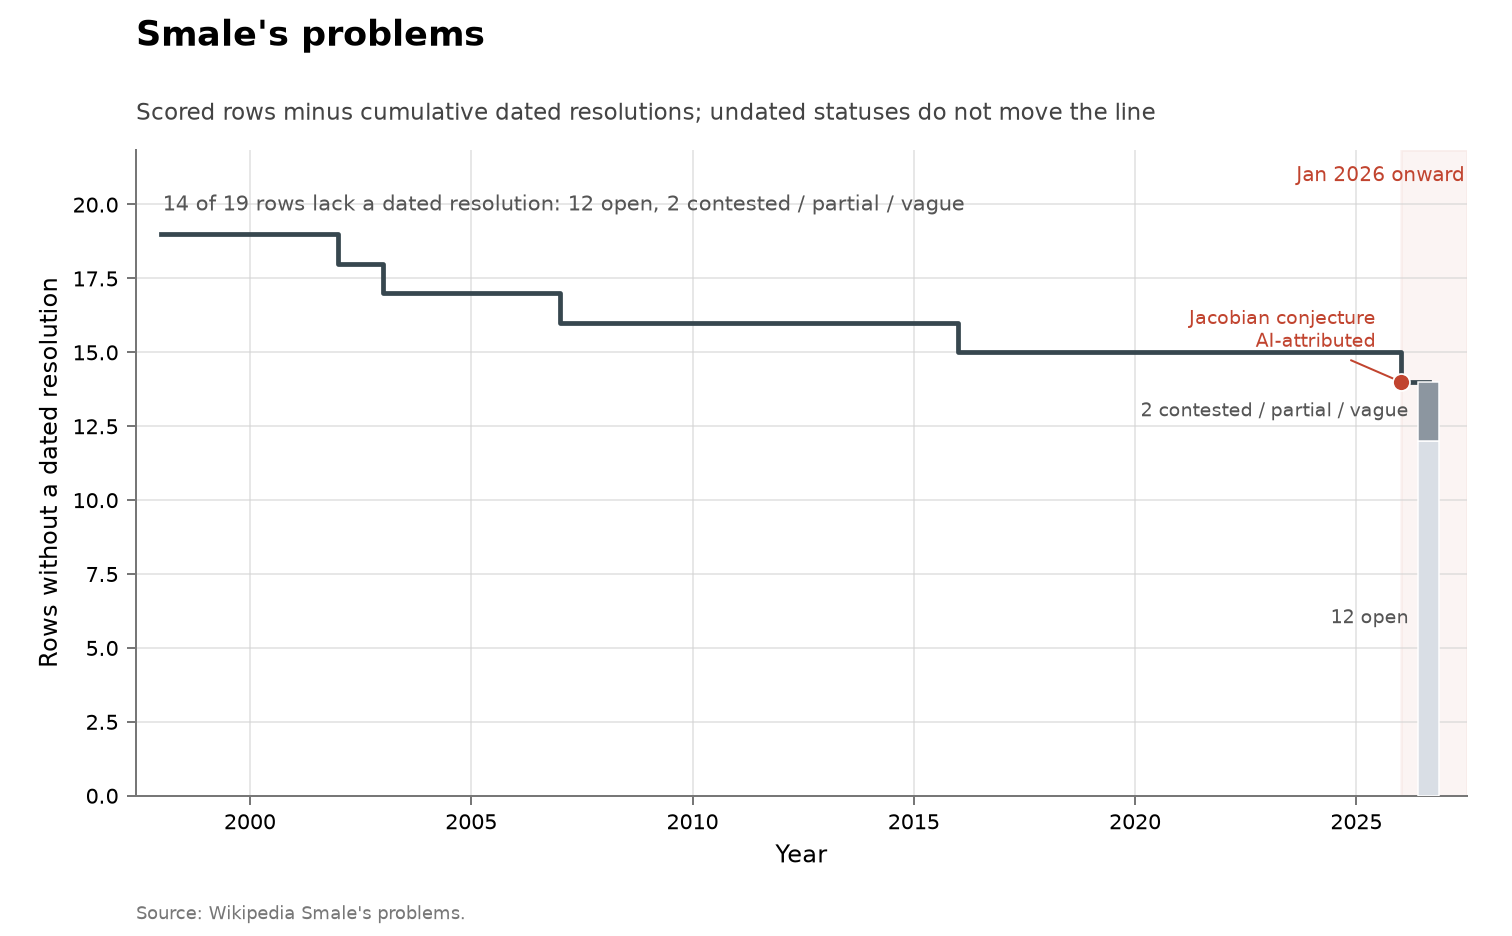
Smale's problems, cumulative view
Thurston's 24 questions
Metric: dated resolutions per year across 24
scored rows
Coverage: list posed 1982; dated resolutions
1993–2013; statuses read 2026-08-14
Acceleration? ➡️ no acceleration — 0
resolutions in 2026 and 0 since 2013; 22 dated
resolutions over 1993–2013
Discussion · Data · Source · Interactive
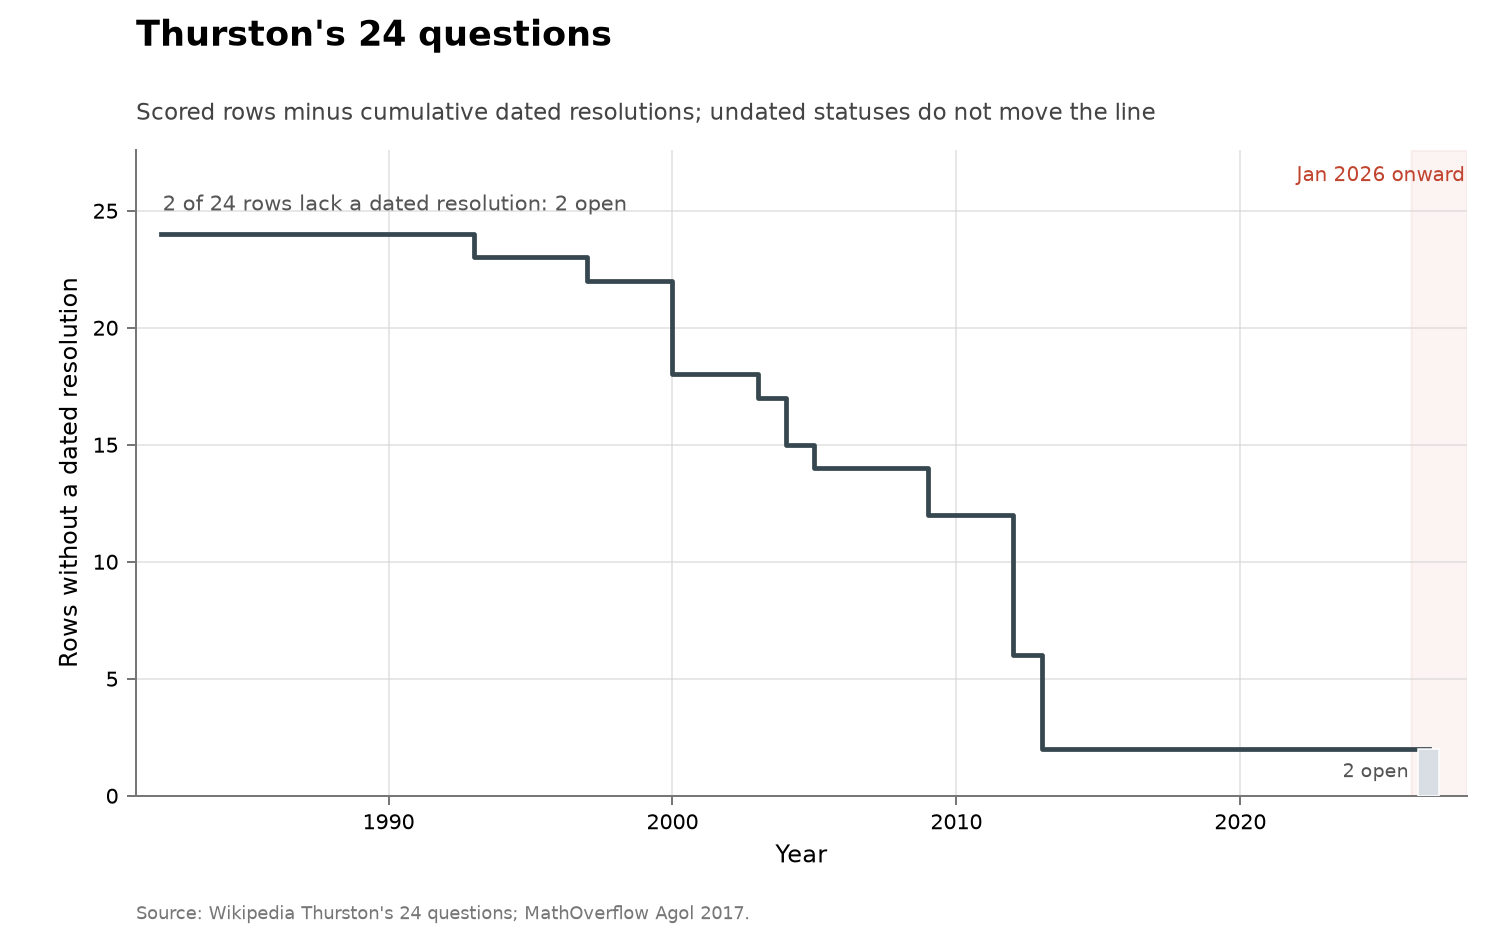
Thurston's 24 questions, cumulative view
The Open Problems Project
Metric: dated resolutions per year across 78
scored rows
Coverage: list begun 2001; dated resolutions
2000–2024; statuses read 2026-08-14
Acceleration? ➡️ no acceleration — 0
resolutions in 2026 and 0 since 2024; 17 dated
resolutions over 2000–2024
Discussion · Data · Source · Interactive
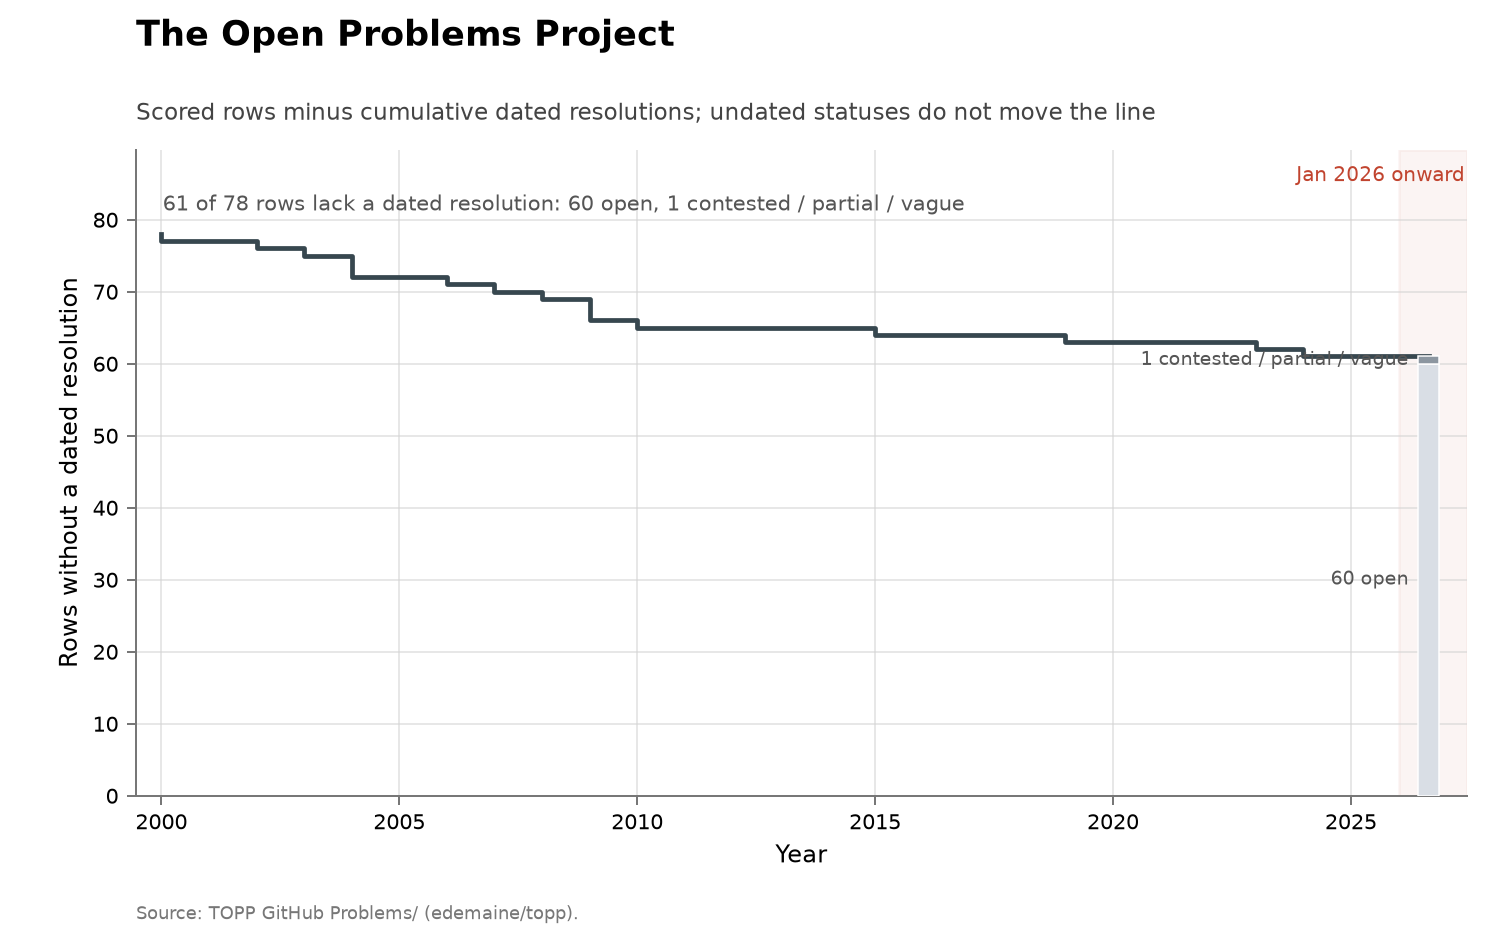
The Open Problems Project, cumulative view

Mathematical bounds and records

Series Chart
Inventory of the AlphaEvolve problem set
Metric: per problem, whether it has a live
numeric record and how many dated prior works
the paper cites
Coverage: the 65 problems the paper numbers
6.1 to 6.65; cited works span 1852–2025; built
2026-07-26
Acceleration? ⚪ baseline — 65 problems
inventoried, 31 with a live numeric record;
built 2026-07-26
Discussion · Data · Source · Interactive
no cumulative view: not a time series
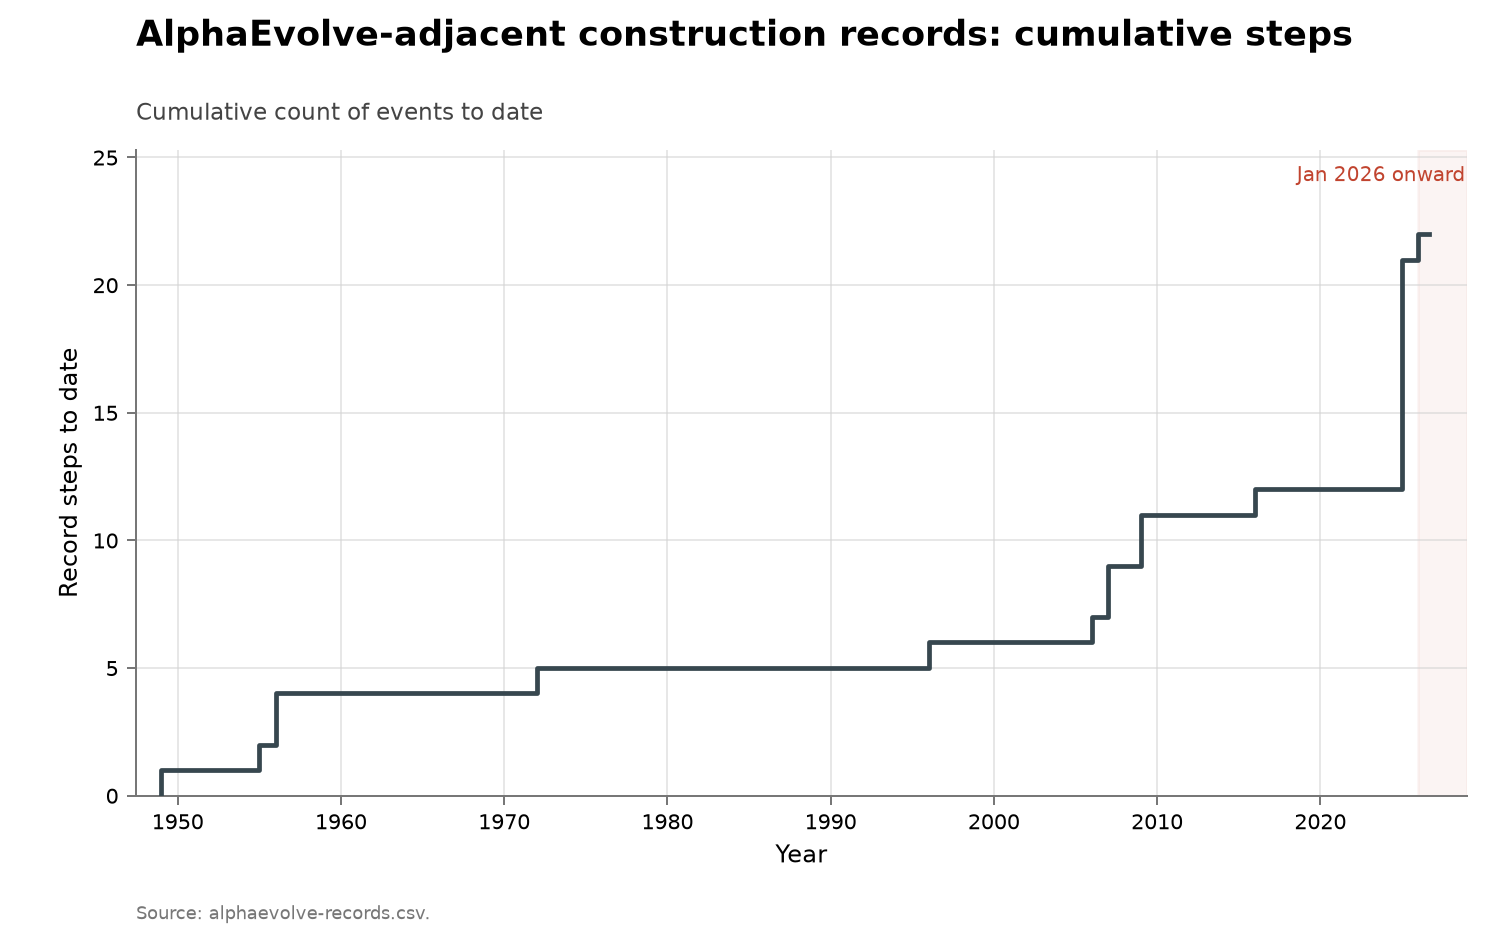
Finite construction records around AlphaEvolve
Metric: cumulative record steps in five groups
of finite construction and packing problems
Coverage: 1949–2026, 22 record steps across
the five groups; transcription current to
2026-08-12
Acceleration? ❓ inconclusive — 1 record step
in 2026 against 9 in 2025 and a 0.2/year mean
over 1949–2024
Discussion · Data · Source · Interactive
Finite construction records around AlphaEvolve, cumulative view
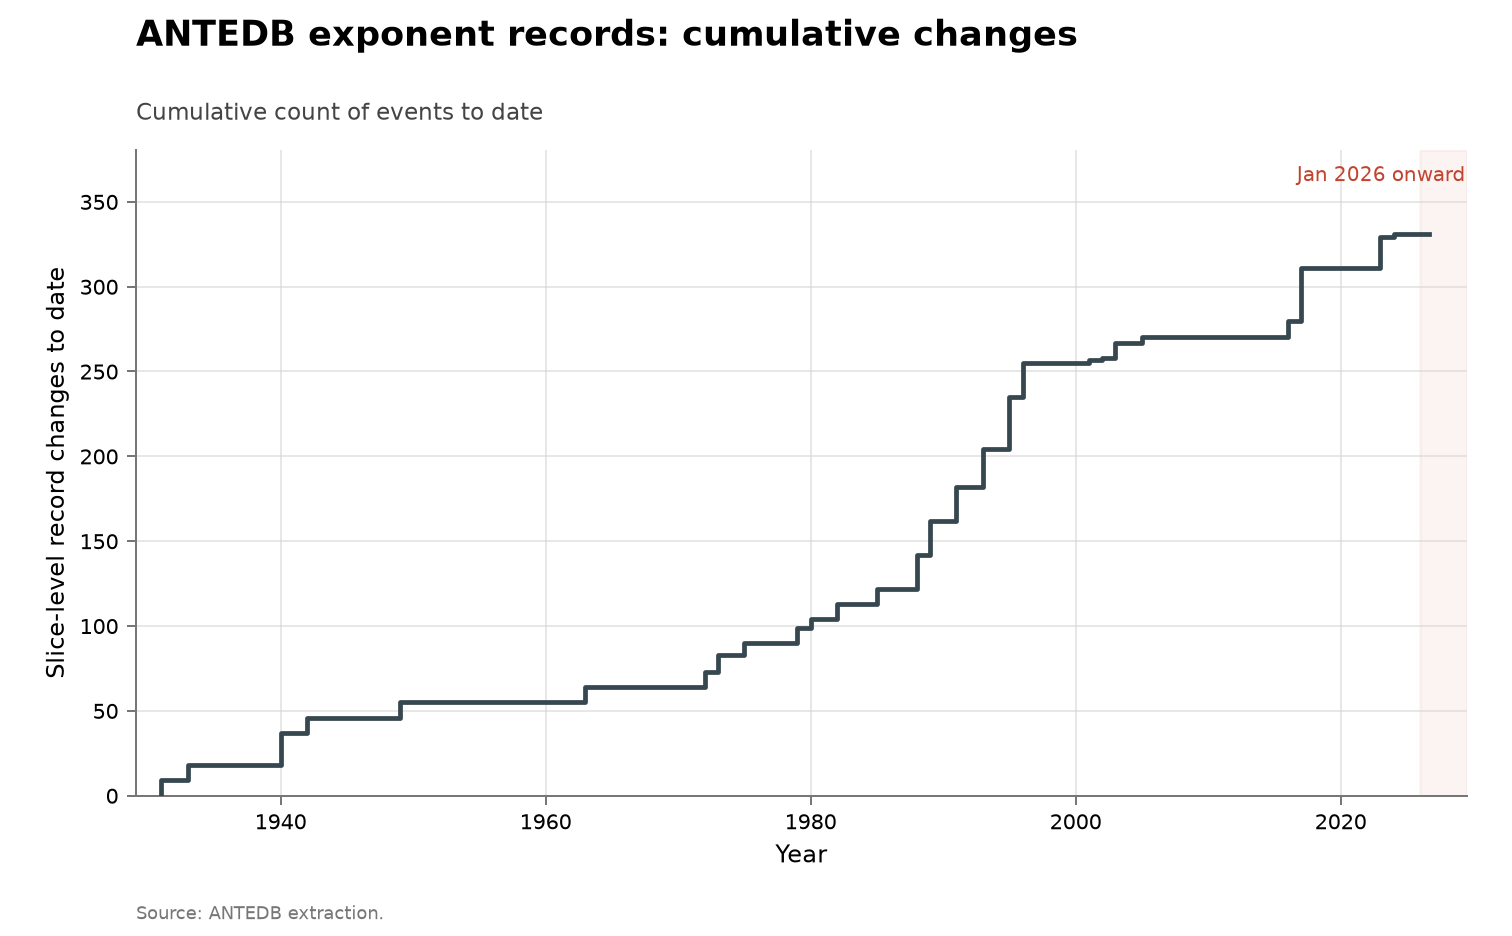
ANTEDB analytic-number-theory exponents
Metric: cumulative slice-level record changes
across 58 exponent slices in the three
families $\mu$, $A$ and $\beta$
Coverage: 1920–2024 in the underlying
literature; extracted from the database as of
2026-07-26
Acceleration? ➡️ no acceleration — 0 slice
changes in 2025 or 2026 against 2 in 2024 and
a 3.5/year mean over 1931–2024
Discussion · Data · Source · Interactive
ANTEDB analytic-number-theory exponents, cumulative view
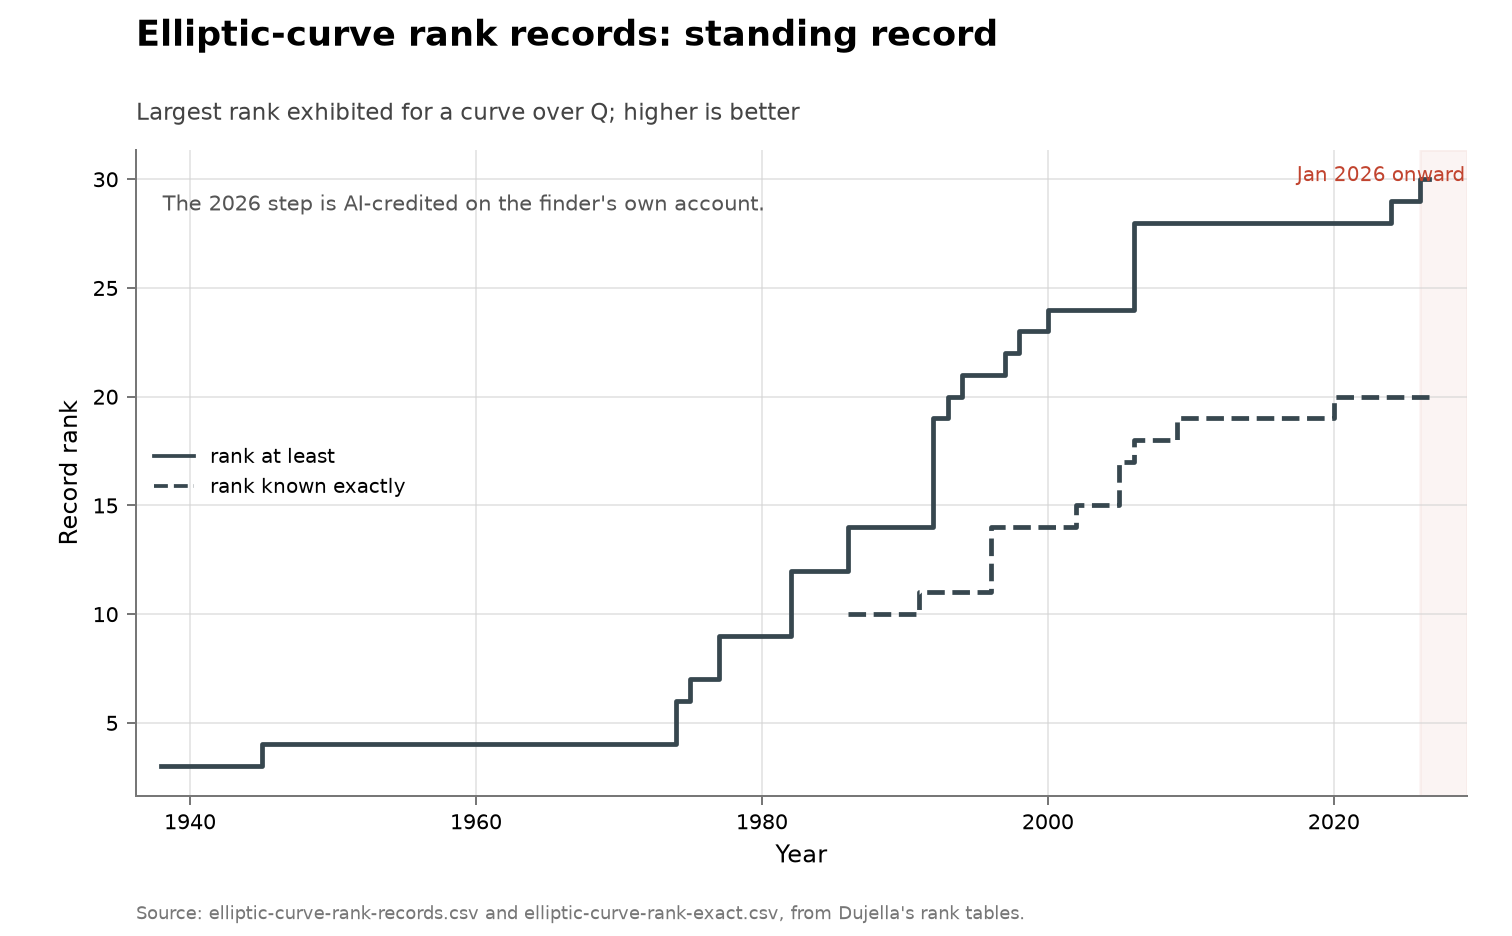
Elliptic-curve rank records
Metric: the largest rank exhibited for an
elliptic curve over Q, counted as one step per
record, split into a proved-lower-bound
frontier and a frontier of ranks known
exactly; a third table holds every curve on
the ICARM leaderboard with its rank and its
size, and a fourth dates the posts around the
2026 record
Coverage: nineteen record steps, 1938 to 2026,
dated by year; the leaderboard snapshot spans
2026-05-27 to 2026-08-20, read 2026-08-20
Acceleration? ❓ inconclusive — 1 record step
in 2026 against 0 in 2025 and 1 in 2024; 3
steps over 2001–2026 against 14 over 1974–2000
Discussion · Data · Source · Interactive
Elliptic-curve rank records, cumulative view
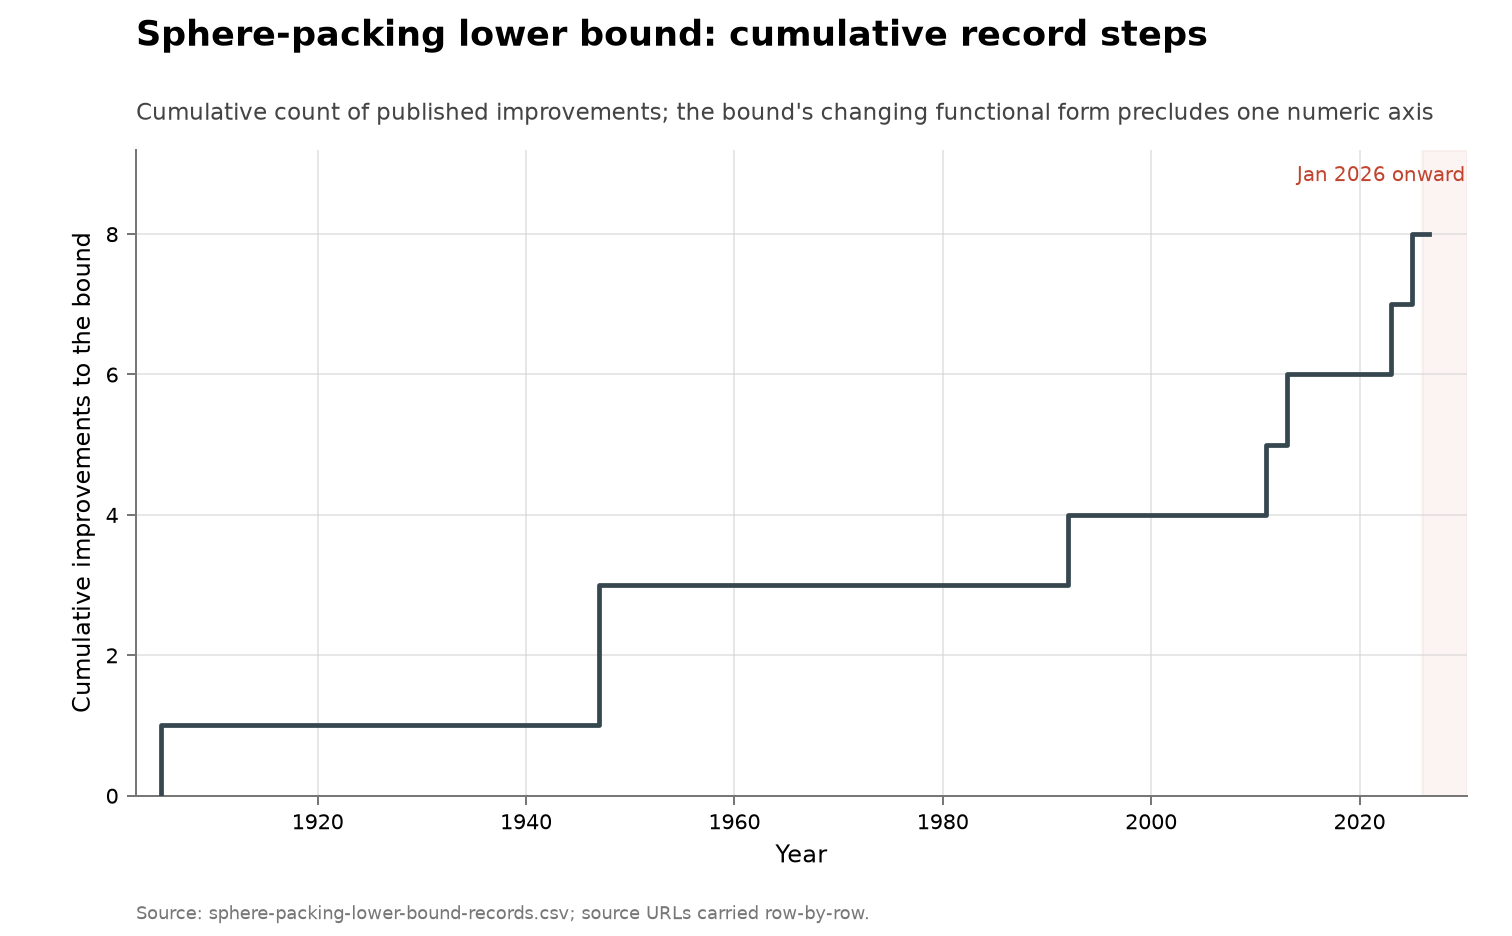
Sphere-packing lower-bound ladder
Metric: cumulative improvements to the
asymptotic lower bound on sphere-packing
density in high dimension
Coverage: 1905–2025, eight recorded steps;
statuses read 2026-08-14
Acceleration? 📈 accelerating — 4 steps over
2011–2025 (2.7/decade) against 4 over
1905–2010 (0.4/decade); 0 steps dated 2026
Discussion · Data · Source · Interactive
Sphere-packing lower-bound ladder, cumulative view
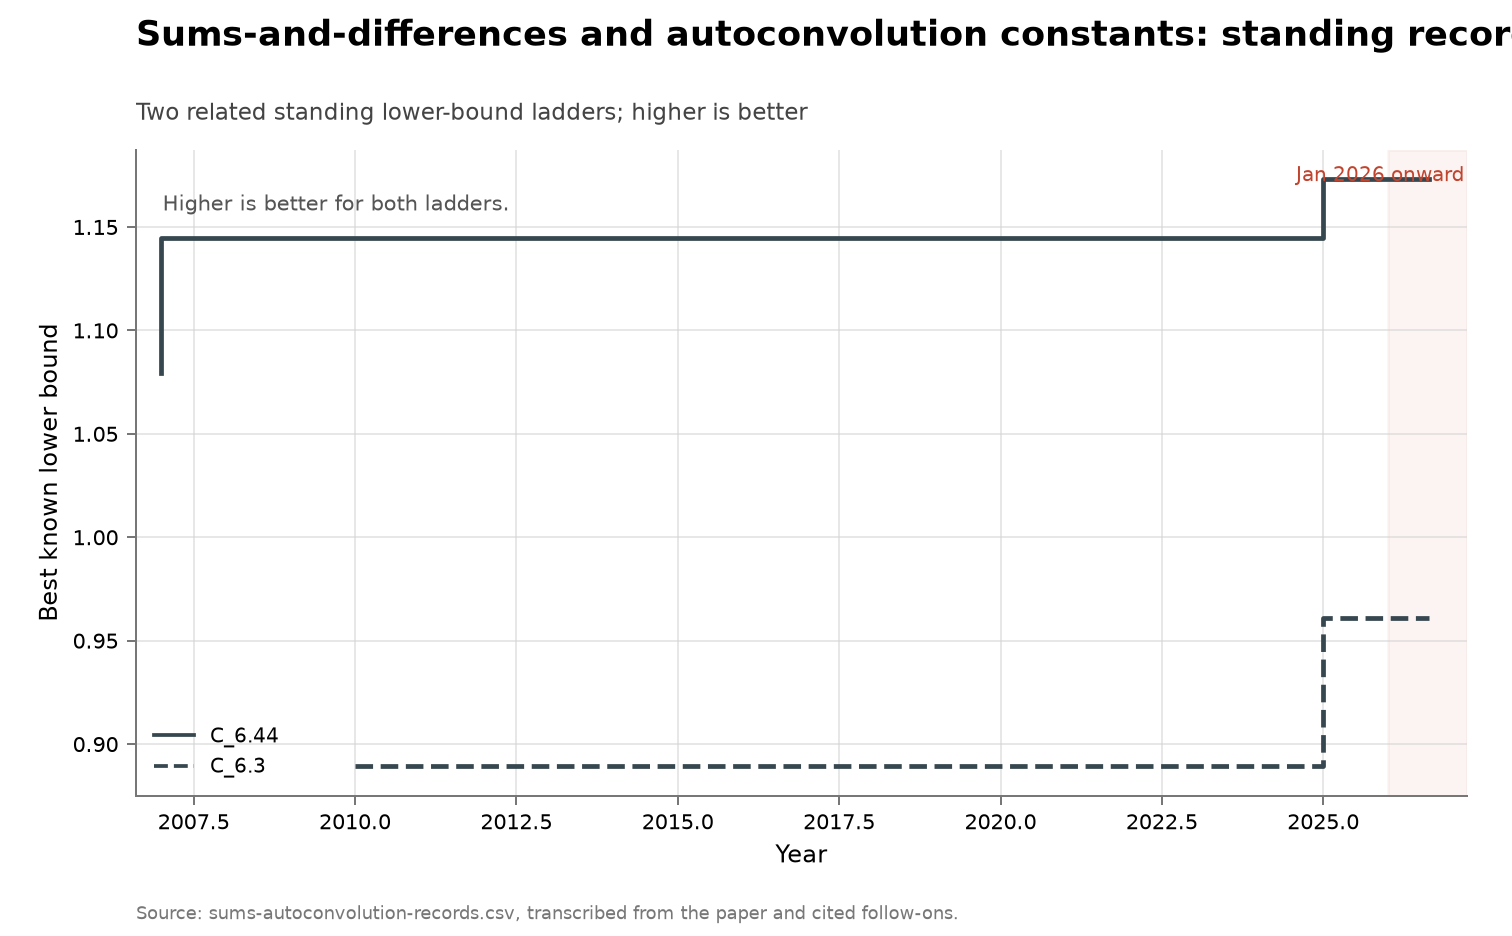
Sums-and-differences and autoconvolution constants
Metric: best known lower bounds on two
additive-combinatorics constants, $C_{6.44}$
and $C_{6.3}$ in the AlphaEvolve numbering
Coverage: 2007–2025, twelve record steps
across the two ladders; source bibliography
read 2026-08-14
Acceleration? ❓ inconclusive — 0 record steps
in 2026 against 7 in 2025; the other 5 fall in
2007 and 2010
Discussion · Data · Source · Interactive
Sums-and-differences and autoconvolution constants, cumulative view
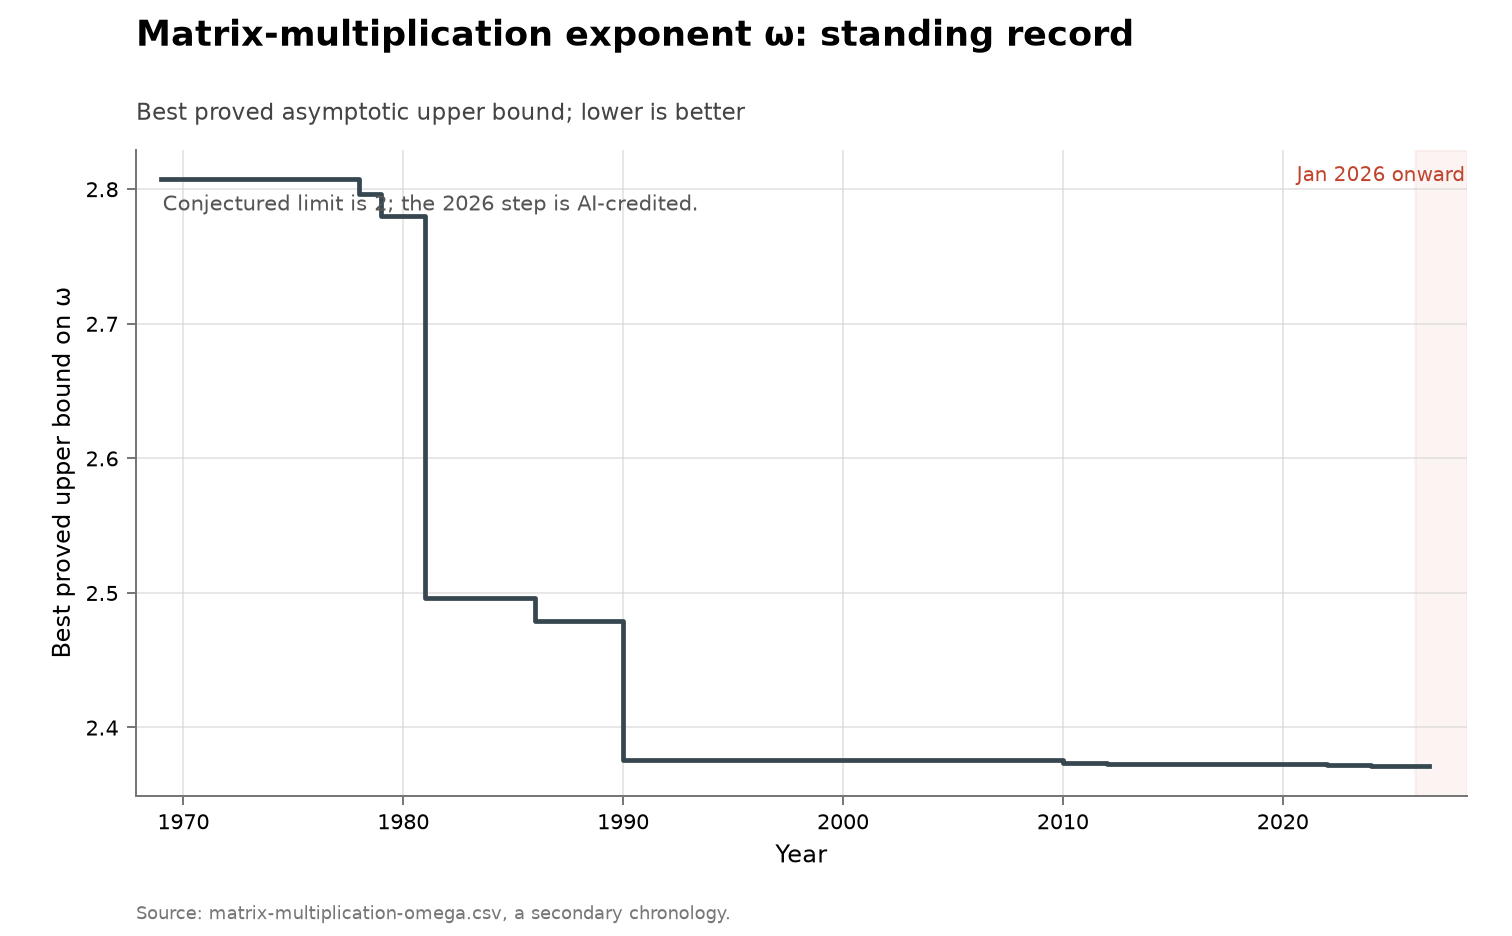
Matrix-multiplication exponent ω
Metric: best proved upper bound on the
asymptotic exponent ω of n×n matrix
multiplication; lower is better
Coverage: 1969 to 2026, sixteen recorded
steps; transcription current to 2026-08-18
Acceleration? ❓ inconclusive — 1 new bound in
2026 against 0 in 2025 and 2 in 2024; movement
of 0.0025 over 2010–2026 against 0.4319 over
1969–1990
Discussion · Data · Source · Interactive
Matrix-multiplication exponent ω, cumulative view

Algorithms

Series Chart
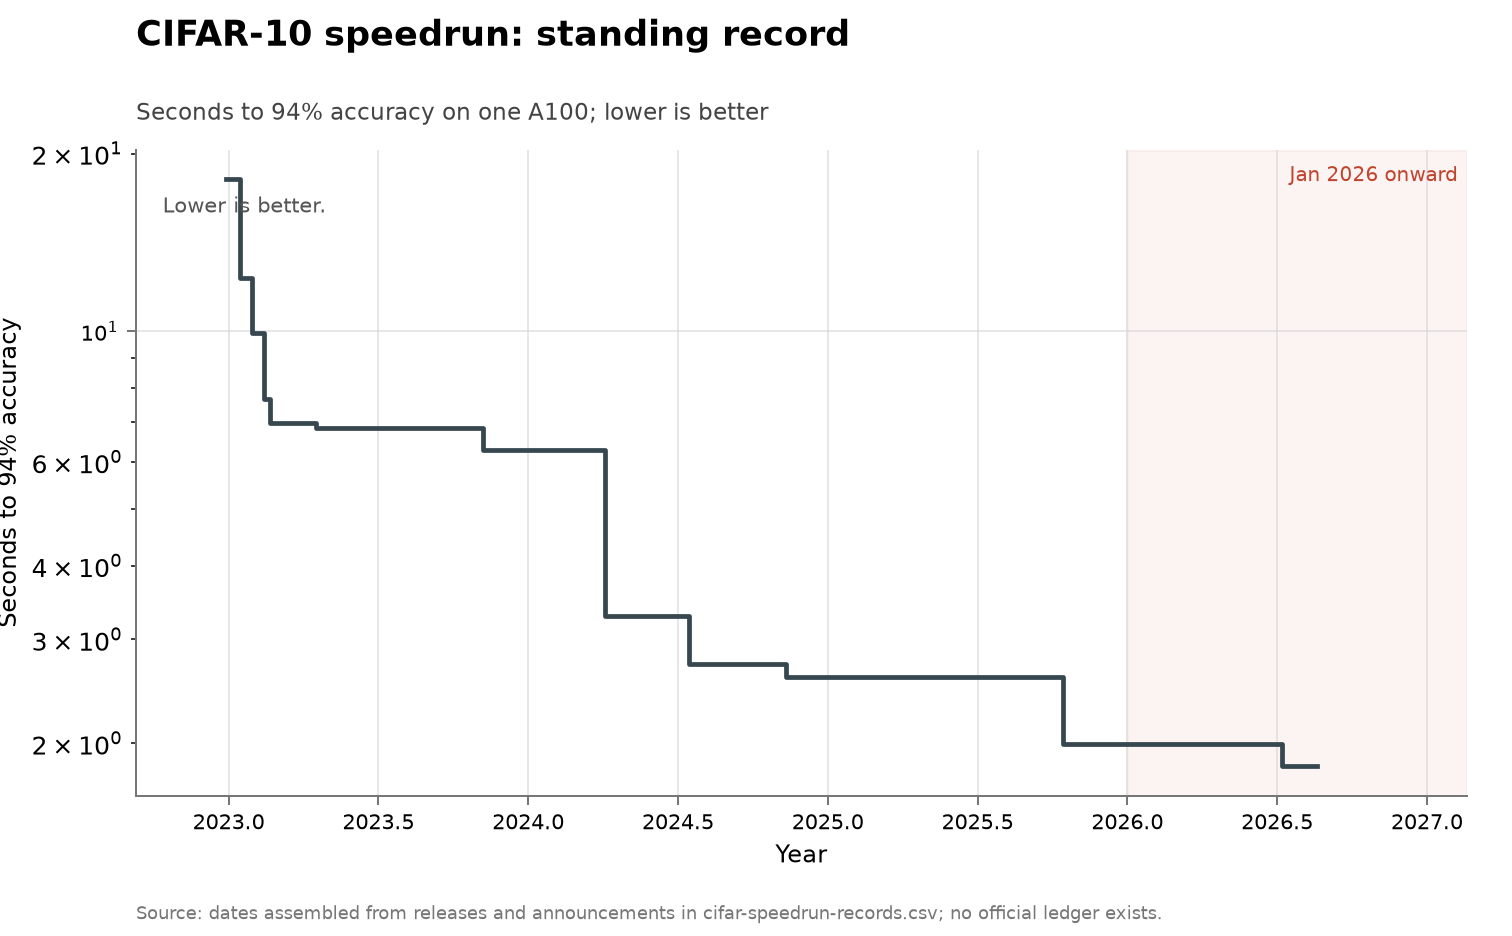
CIFAR-10 speedrun
Metric: seconds of training to 94% test
accuracy on CIFAR-10 on a single A100, per
claimed record
Coverage: 2018–2026; the plotted series runs
2022-12-29 to a claim of 2026-07-09, with
acknowledgment last checked 2026-07-28
Acceleration? 📉 declining — yearly improvement
factor 1.09 in 2026 (through 2026-07-09, claim
included) against 1.3 in 2025 and 2.4 in 2024
Discussion · Data · Source · Interactive
CIFAR-10 speedrun, cumulative view
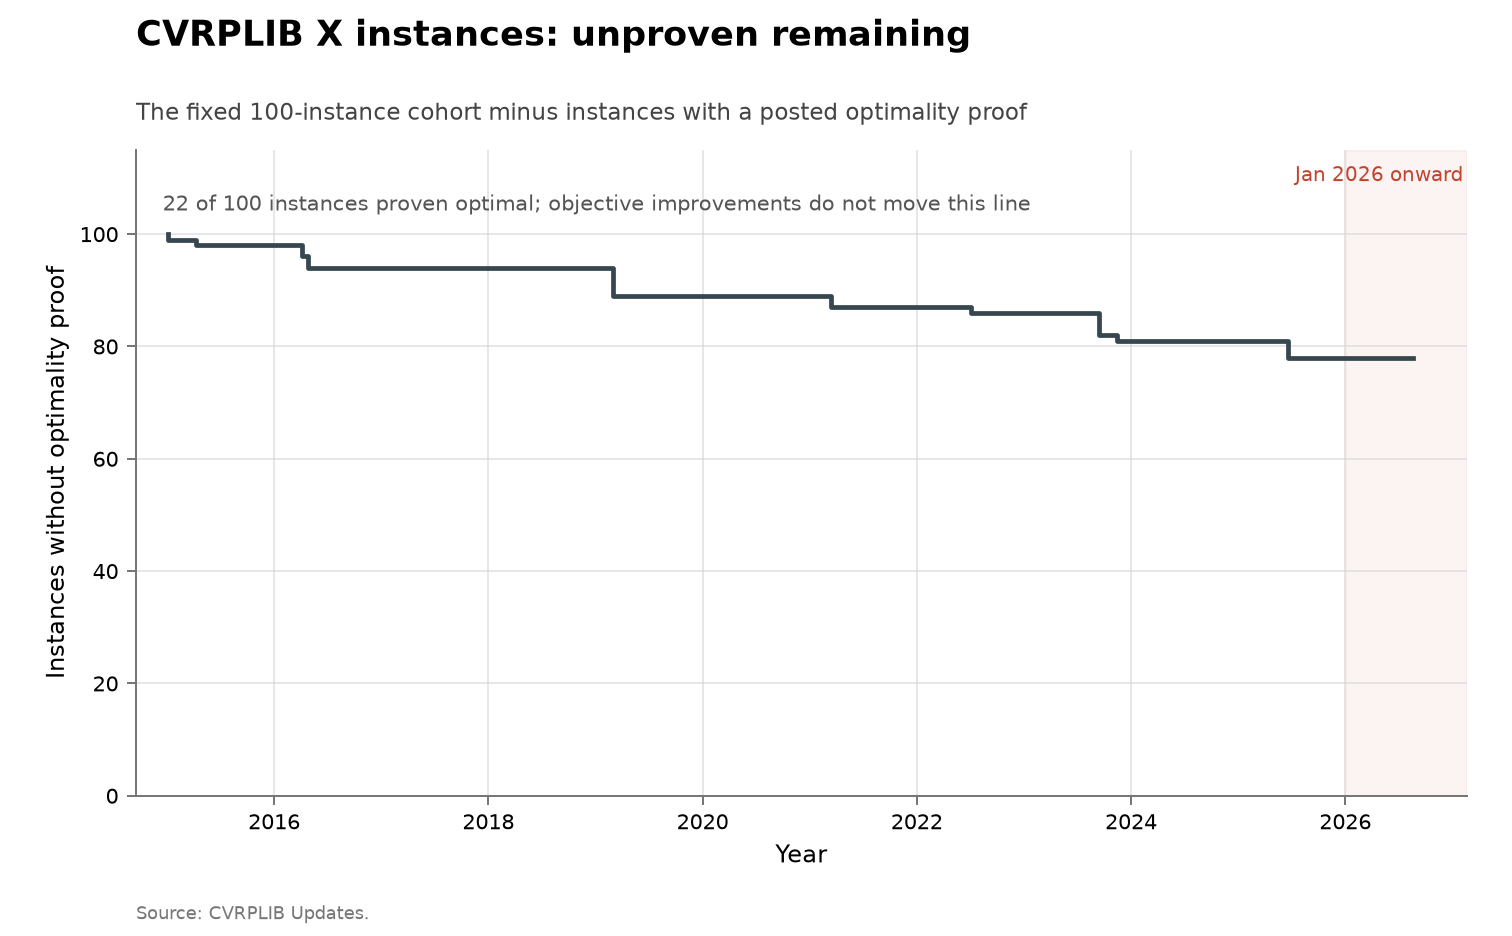
CVRPLIB X-instance record frontier
Metric: better best-known objectives and later
optimality proofs recorded for a fixed cohort
of 100 CVRP X instances, one event per posting
Coverage: 2015–2026, 289 event rows posted
through 2026-07-04
Acceleration? 📉 declining — 3 events in 2026
against 3 in 2025; 264 of the 267 better-
objective events were posted 2015–2021
Discussion · Data · Source · Interactive
CVRPLIB X-instance record frontier, cumulative view
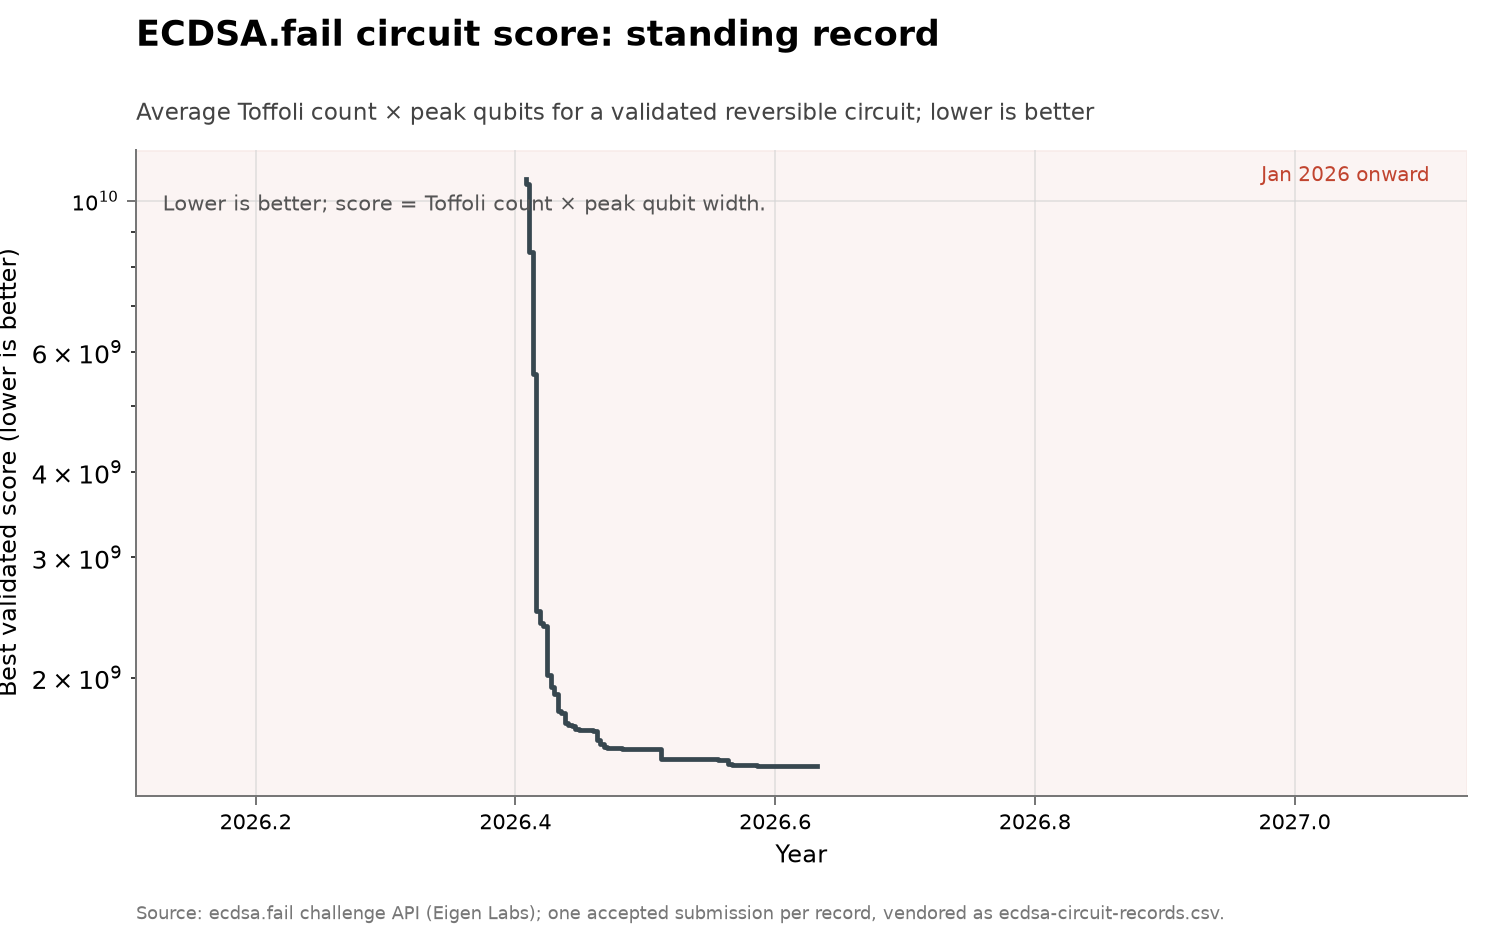
ECDSA.fail secp256k1 point-addition circuit
Metric: best validated score (average executed
Toffoli count × peak qubit width) for a
reversible secp256k1 point-addition circuit;
lower is better
Coverage: 2026-05-30 to 2026-08-10, 433
accepted records
Acceleration? ⏳ too early — first record
2026-05-30, so no prior-year rate exists; the
2026 series is a 7.3× fall over 72 days
Discussion · Data · Source · Interactive
ECDSA.fail secp256k1 point-addition circuit, cumulative view
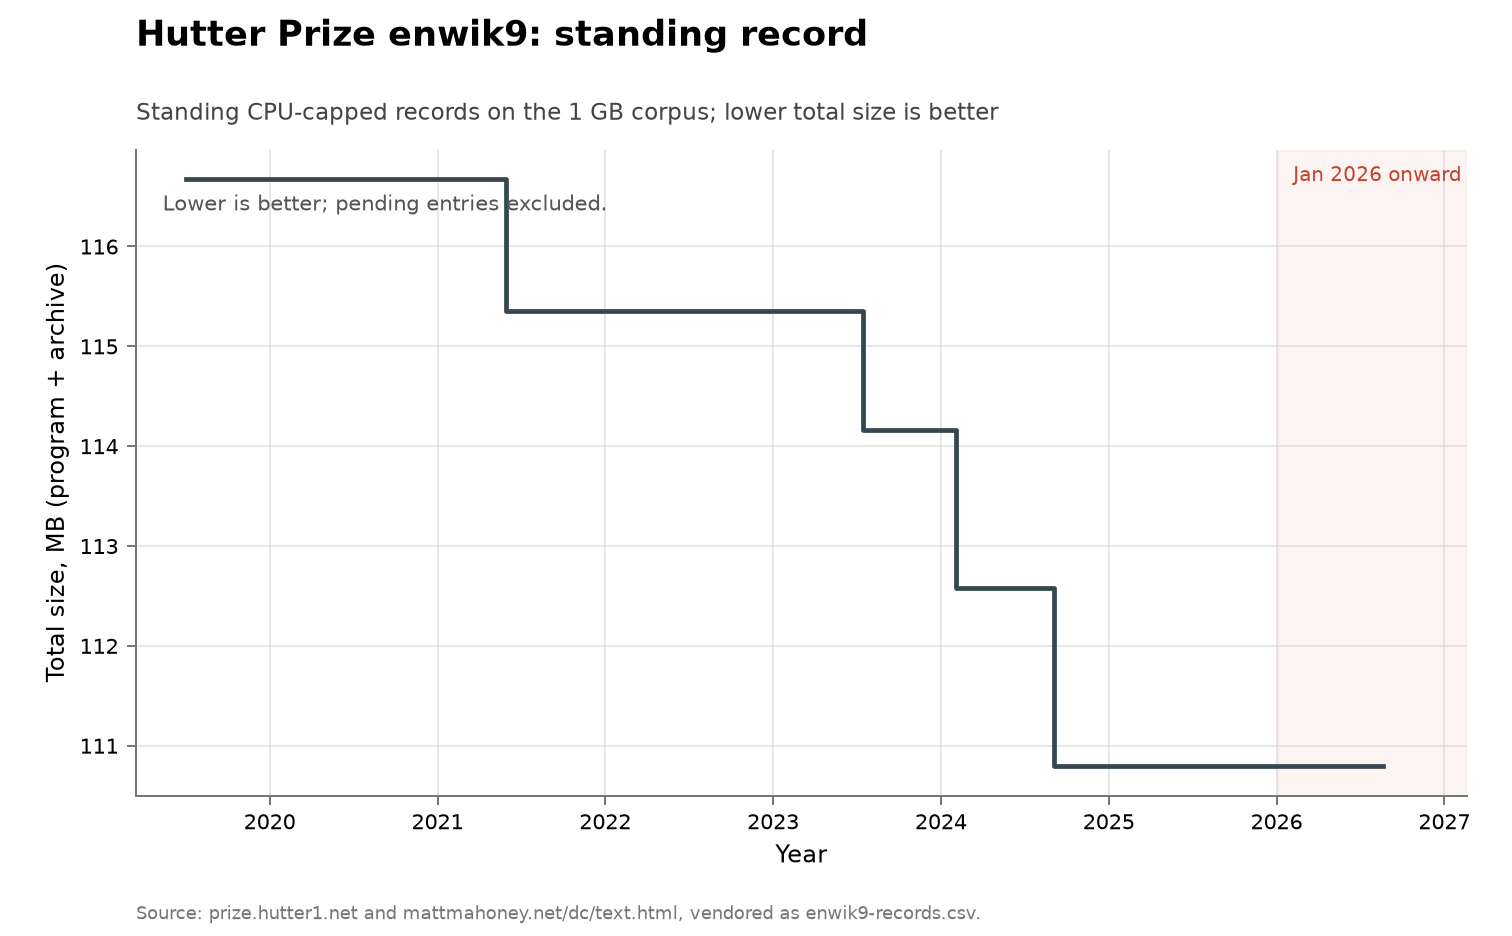
Hutter Prize compression: enwik9
Metric: total size in bytes of decompressor
plus archive for a fixed 1 GB text corpus,
under a CPU-time and memory cap, per awarded
record
Coverage: 2019 baseline to 2026; the prize
moved to enwik9 on 2020-02-21; prize site read
2026-07-28, benchmark page's own update dated
2026-07-08
Acceleration? ➡️ no acceleration — 0 awarded
records in 2026 (one pending claim of
2026-06-26) against 2 in 2024 and 4 over
2021–2024; the uncapped comparator is
unchanged since 2023-10-23
Discussion · Data · Source · Interactive
Hutter Prize compression: enwik9, cumulative view
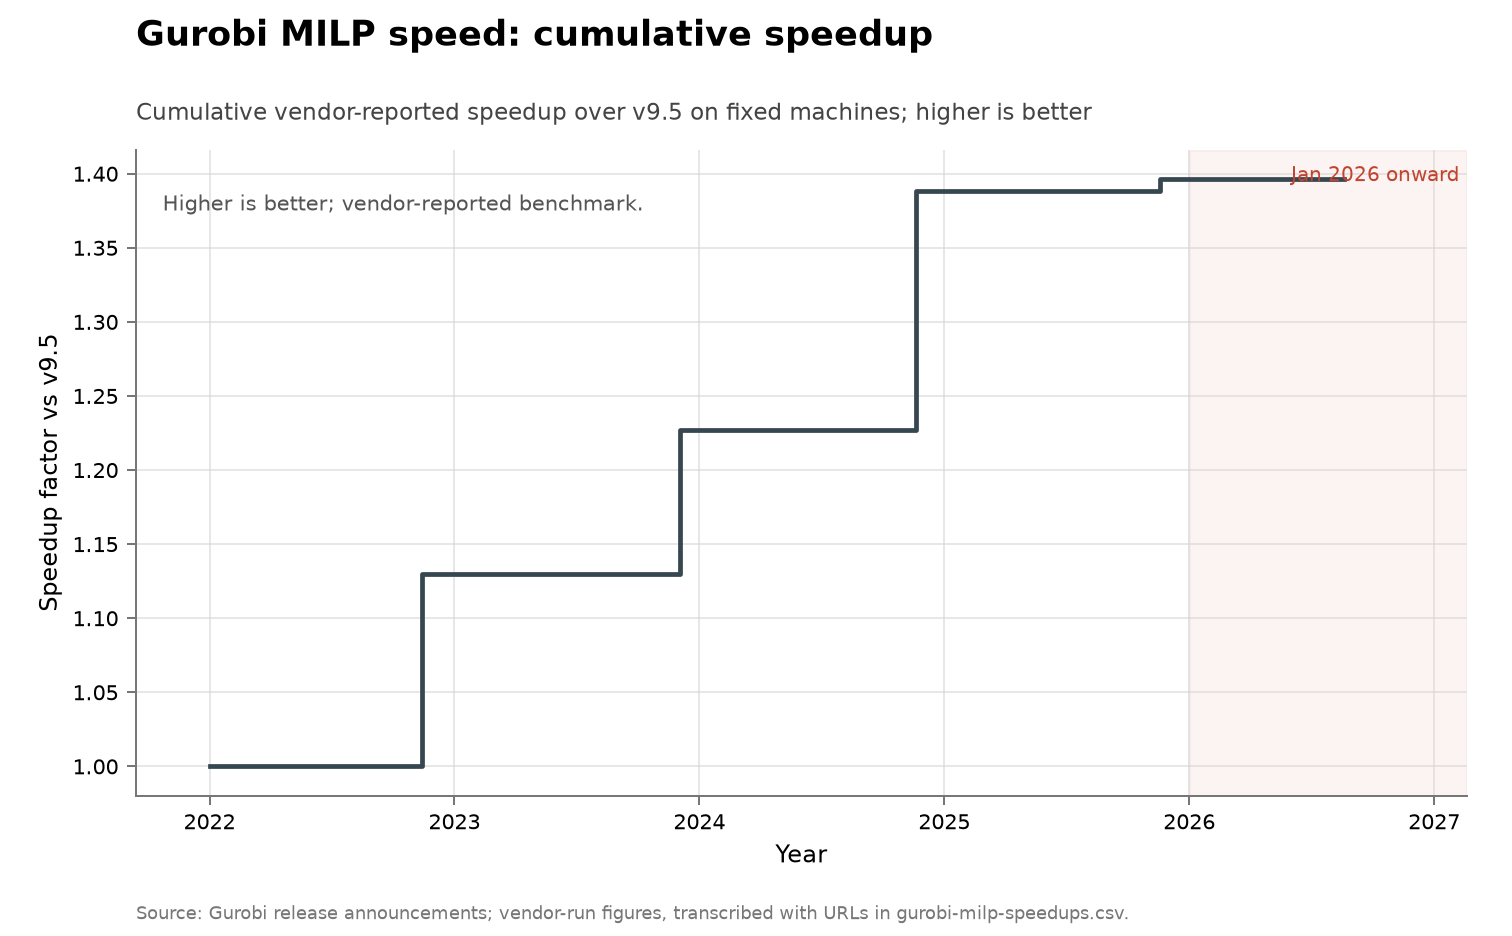
Gurobi mixed-integer programming speed
Metric: cumulative vendor-reported MILP
speedup across releases, every version rerun
on one machine
Coverage: releases 10 through 13, announced
2022-11-14 to 2025-11-18, baselined at version
9.5; transcription current to 2026-08-10
Acceleration? ➡️ no acceleration — no 2026
release exists (series ends 2025-11-18); the
2025 release gained 0.6% against 13.1% in 2024
and a cumulative 1.40× over 2022–2025
Discussion · Data · Source · Interactive
Gurobi mixed-integer programming speed, cumulative view
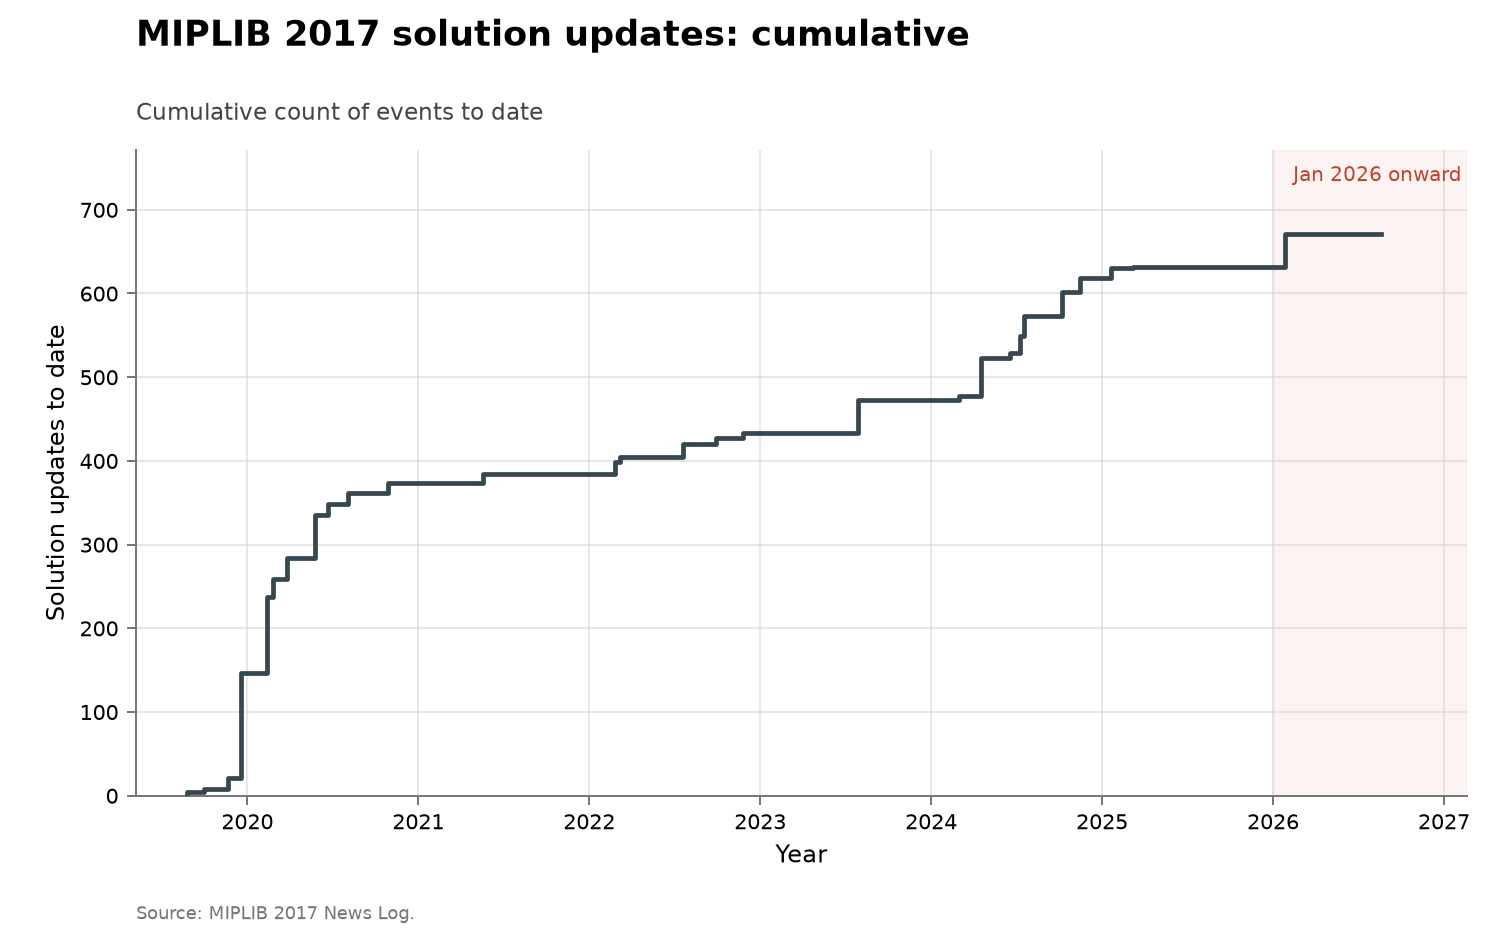
MIPLIB 2017 solution frontier
Metric: better feasible incumbents, first
feasible solutions and optimality updates
announced in MIPLIB 2017 solufile releases
Coverage: 2019-08-26 through 2026-01-26, 28
releases with explicit solution counts
Acceleration? ➡️ no acceleration — 40
announced updates in the single 2026 release
against 13 in 2025 and a 90.1/year mean over
2019–2025
Discussion · Data · Source · Interactive
MIPLIB 2017 solution frontier, cumulative view
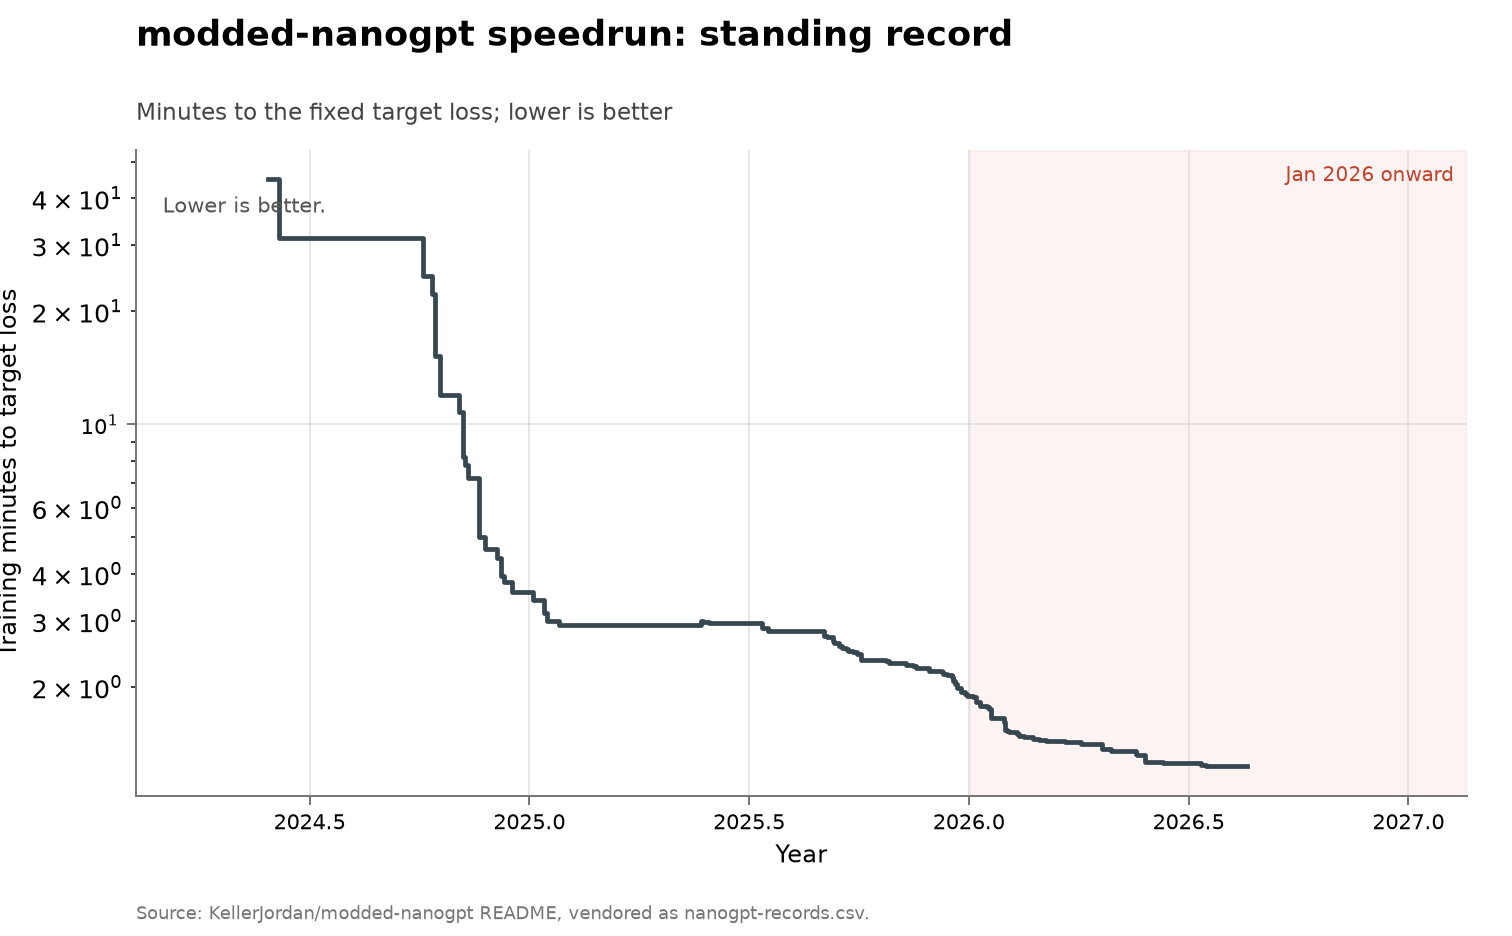
modded-nanogpt training speedrun
Metric: minutes of training to a fixed target
validation loss, per accepted record
Coverage: 2024-05-28 to 2026-07-17, all 89
records listed in the repository README
Acceleration? ➡️ no acceleration — the
standing record fell 1.5× in 2026 (33 records
through 2026-07-17) against 1.9× in 2025 (39
records) and 12.6× in 2024 (17 records)
Discussion · Data · Source · Interactive
modded-nanogpt training speedrun, cumulative view
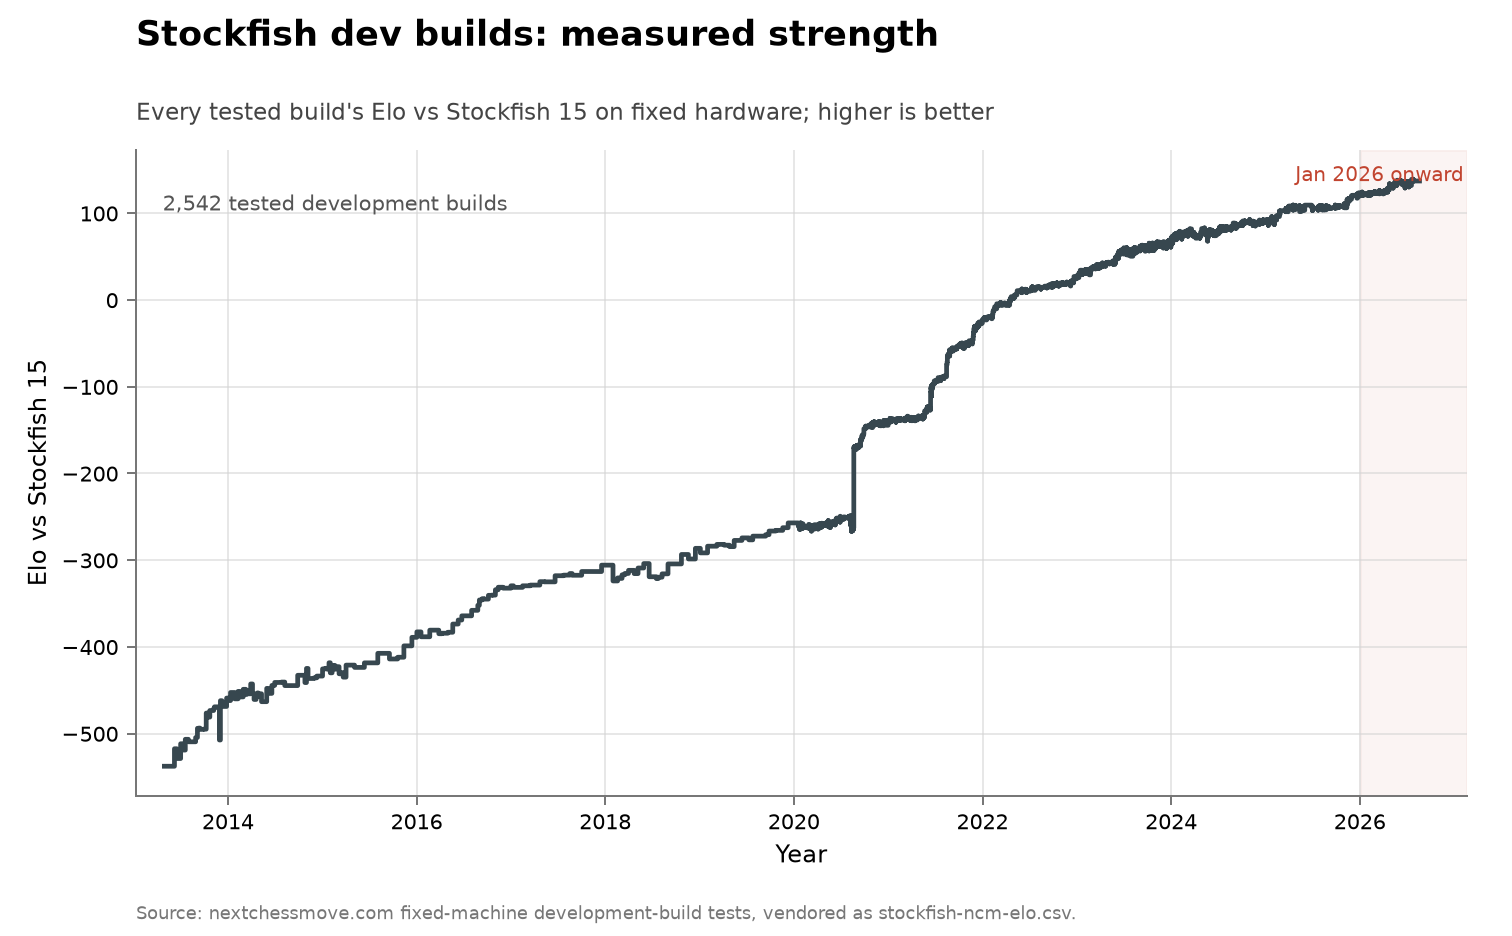
Stockfish development builds on fixed hardware
Metric: Elo relative to Stockfish 15, from
20,000 games per build on one fixed machine
and time control
Coverage: 2013-04-30 to 2026-07-26, 2,542
tested development builds
Acceleration? ➡️ no acceleration — 14 Elo
through 2026-07-26 (annualizing to about 24
Elo/year) against 32 Elo in 2025 and a 51
Elo/year mean over 2013–2026
Discussion · Data · Source · Interactive
Stockfish development builds on fixed hardware, cumulative view

Outside the three domains

Series Chart
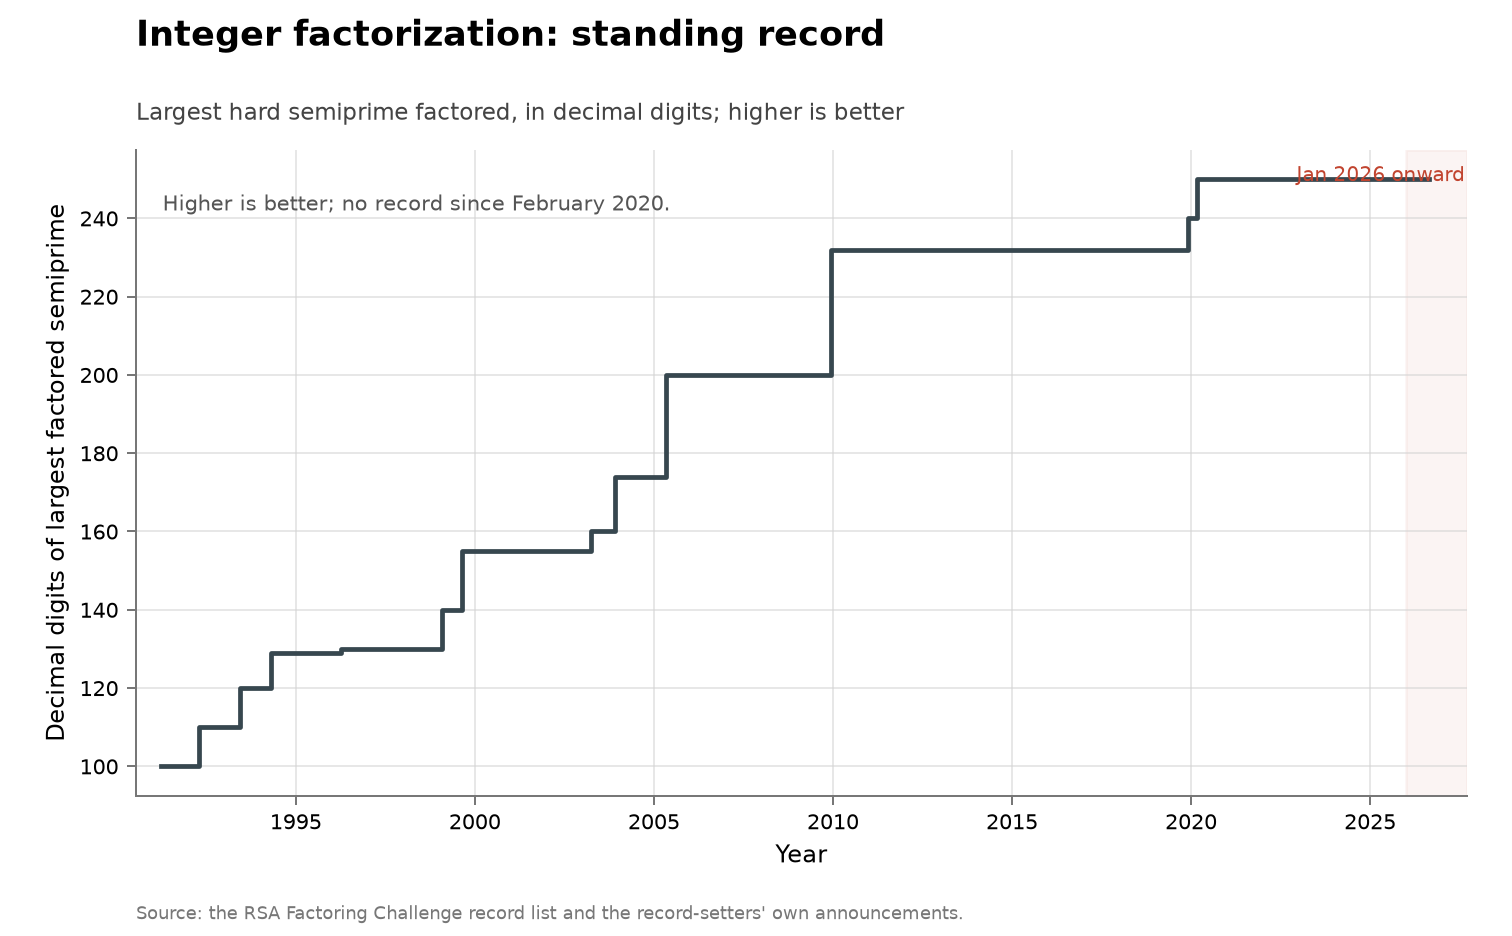
Integer factorization records
Metric: cryptanalysis; decimal digits in the
largest hard semiprime factored, as a running
maximum over dated records
Coverage: 1991-04 to 2020-02, confirmed
unmoved as of 2026-08-10
Acceleration? ➡️ no acceleration — 0 records
in 2026 against 0 in 2025 and a 0.4/year mean
over 1991–2025; the standing record is 250
digits, set 2020-02-28
Discussion · Data · Source · Interactive
Integer factorization records, cumulative view
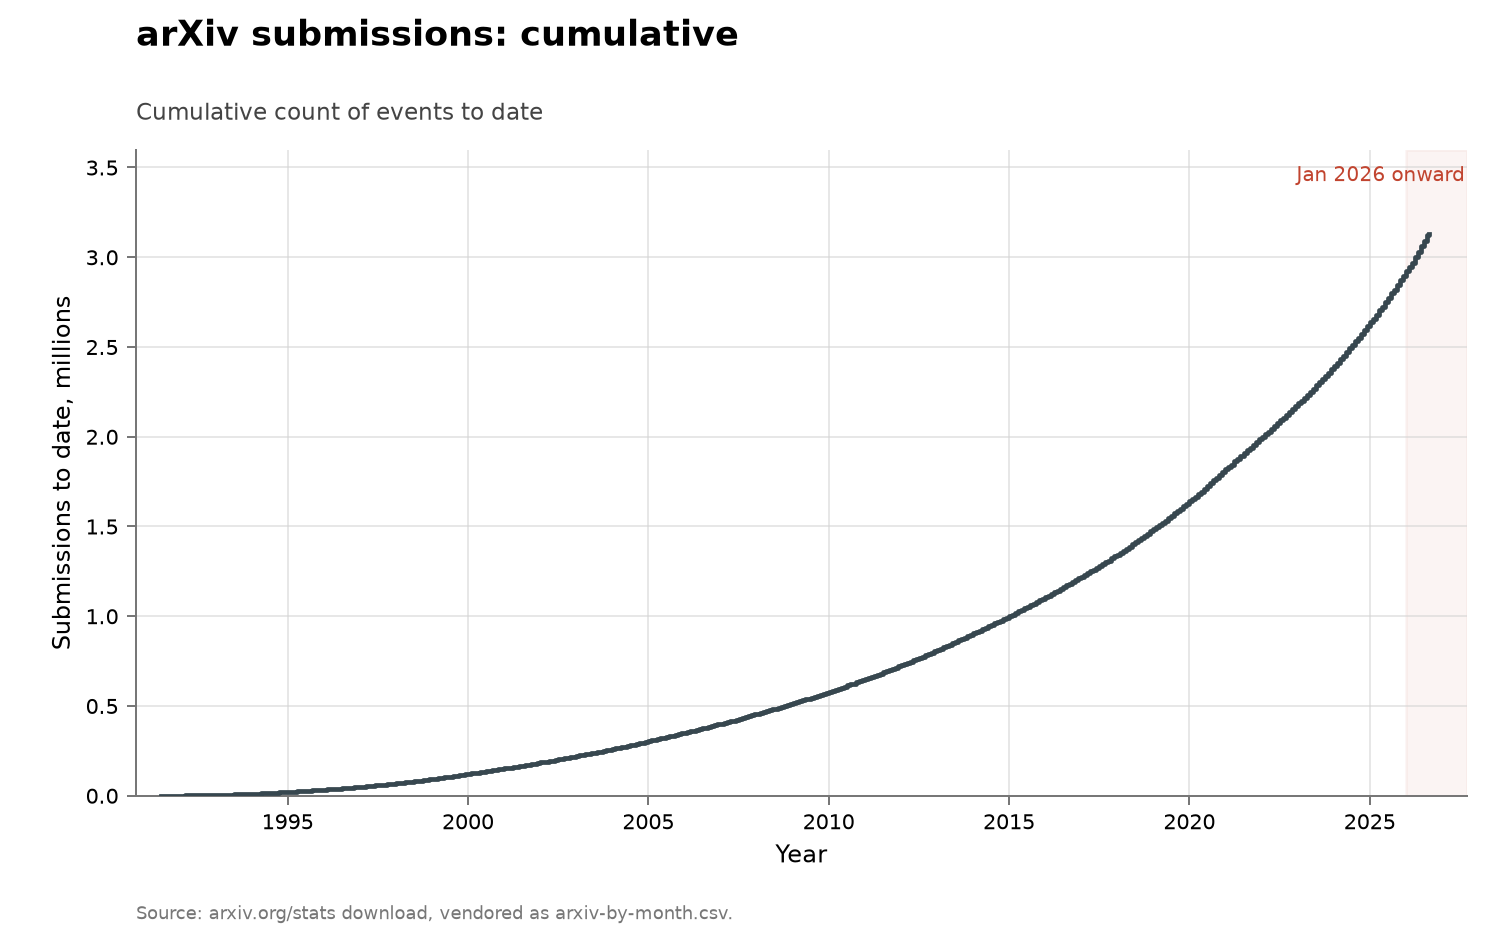
arXiv submissions
Metric: research output; preprints submitted
to arXiv per month
Coverage: 1991-07 to 2026-08, monthly, the
last month partial at the 2026-08-10 fetch
Acceleration? 📈 accelerating — a 28,450
submissions/month mean over 2026-01 to 2026-07
against monthly means of 23,707 in 2025 and
20,336 in 2024
Discussion · Data · Source · Interactive
arXiv submissions, cumulative view
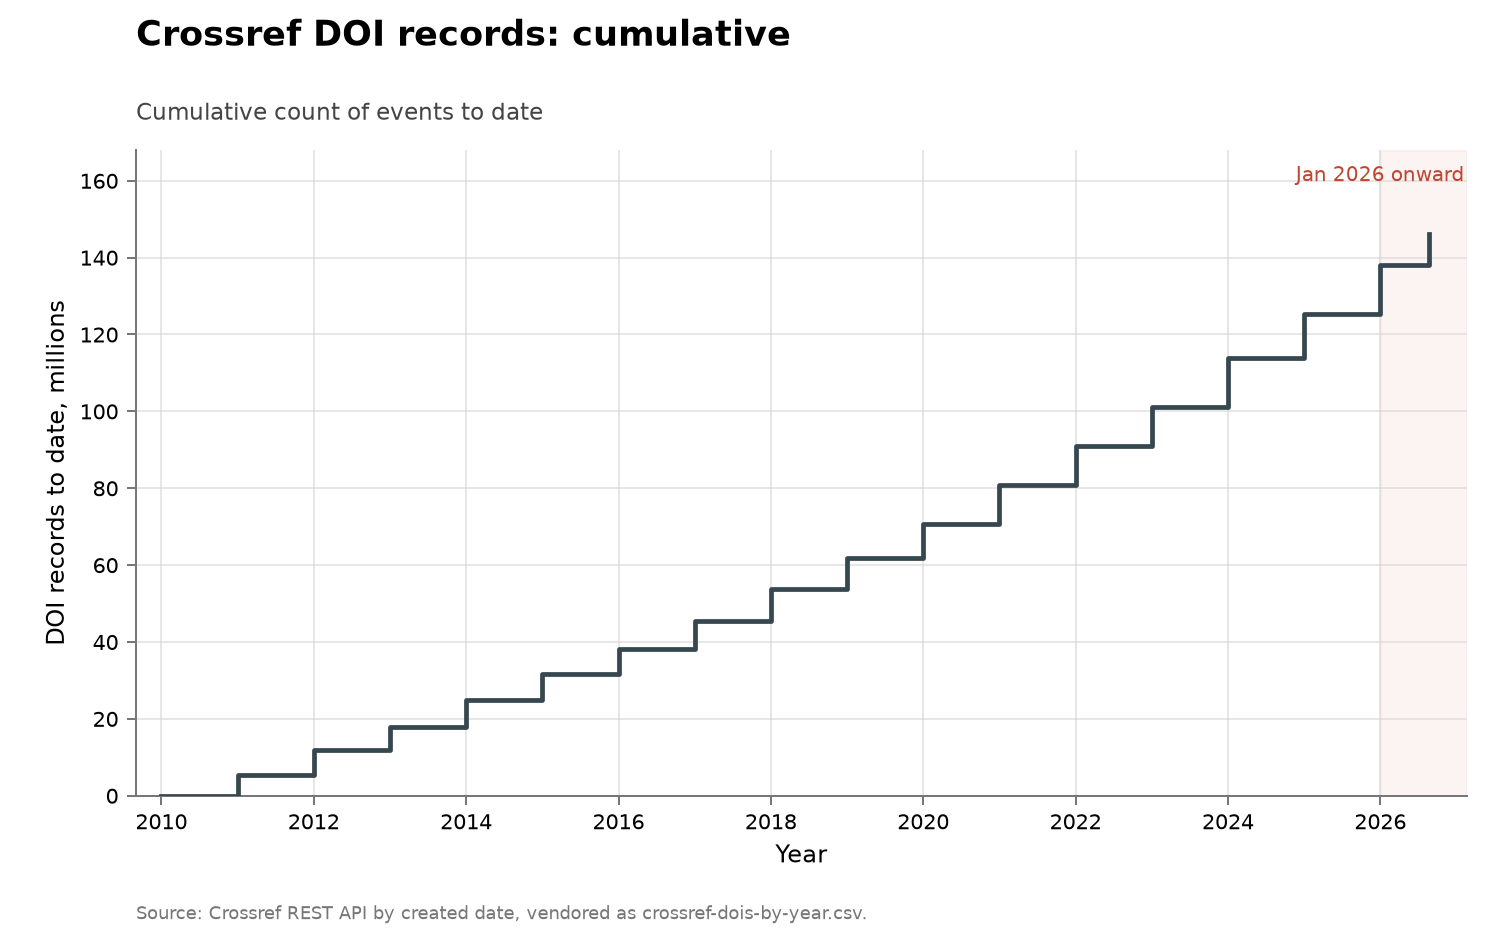
DOI records deposited with Crossref
Metric: formal publishing volume; DOI records
deposited with Crossref per year, by created
date
Coverage: 2010 to 2026, annual, the last year
partial through 2026-08-10
Acceleration? ➡️ no acceleration — 2026
annualizes to roughly 13.3 million records
against 12.80 million in 2025 and an 8.63
million/year mean over 2010–2025
Discussion · Data · Source · Interactive
DOI records deposited with Crossref, cumulative view
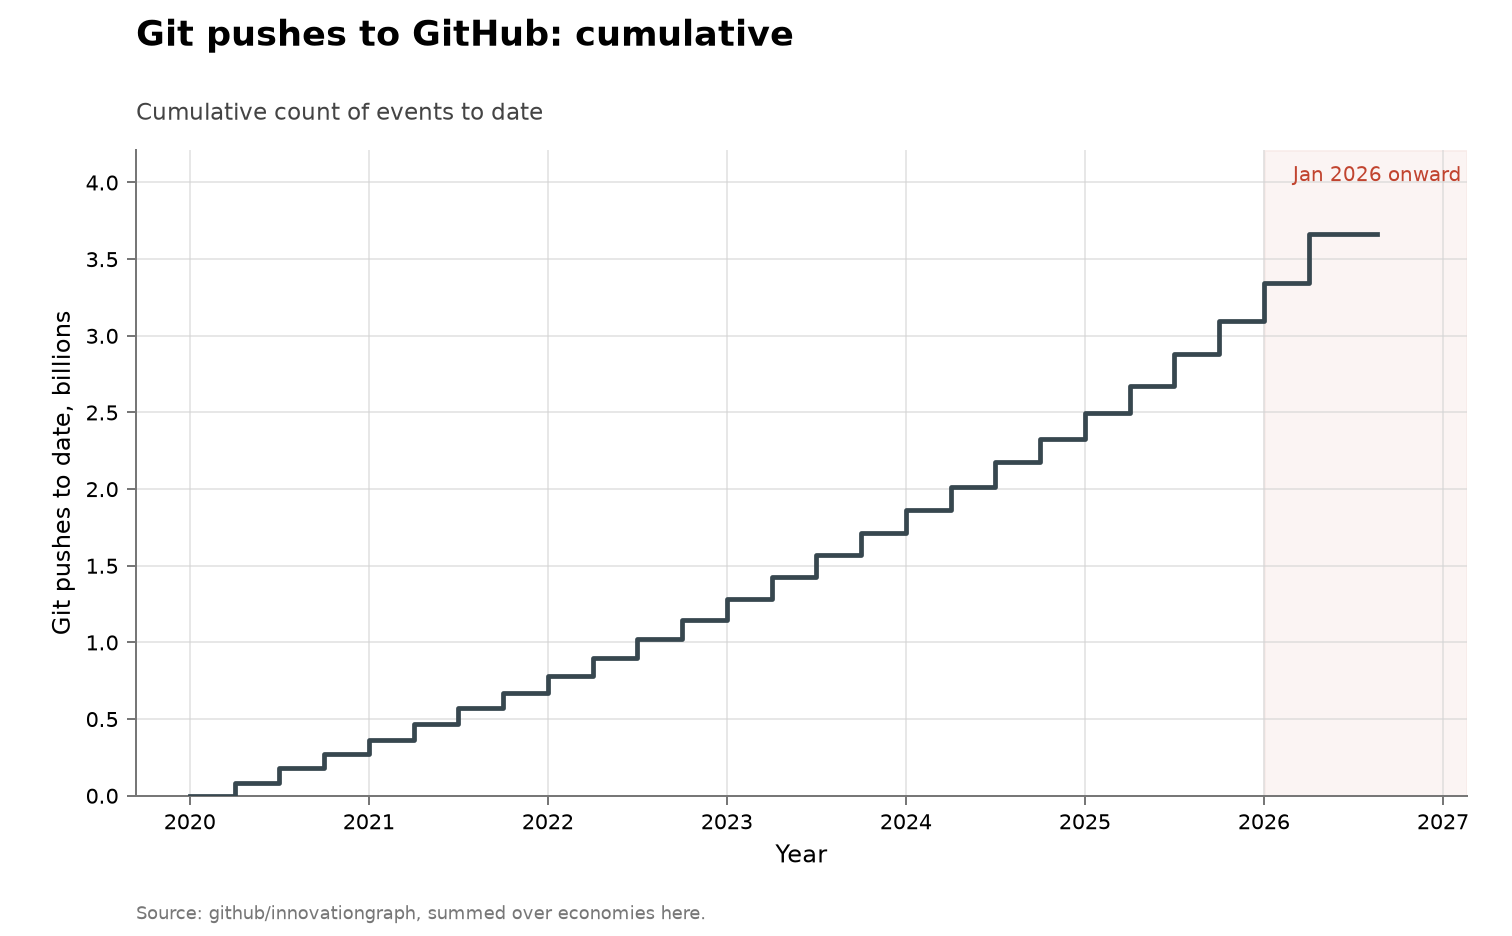
Git pushes to GitHub
Metric: code output; git pushes to GitHub per
quarter, summed over economies
Coverage: 2020-Q1 to 2026-Q1, quarterly;
fetched 2026-08-10
Acceleration? 📈 accelerating — 319.8 million
pushes in 2026-Q1 against 246.8 million in
2025-Q4 and a 2025 quarterly mean of 212.2
million
Discussion · Data · Source · Interactive
Git pushes to GitHub, cumulative view