Verdict: accelerating — 73,400 CVEs through 2026-09-28 annualize to about 99,000, roughly 2.0 times 2025's 49,972, after +32% growth into 2024 and +23% into 2025
CVEs published
The final bar is a partial quarter; hover for the flag.
Definition
This series counts every CVE published in the US government's vulnerability
database, across all software. There is no fixed codebase, so the population
being searched grows along with the count. There is no finder attribution.
A CVE is published when a numbering authority's process publishes it, so a
single organization's pipeline can move the aggregate without the world's
stock of bugs changing.
A "discovery" here is one CVE record, counted in the quarter NVD published
it. The 2016-to-2017 near-tripling is a process break — the expansion of CVE
numbering authorities — so the series is comparable only from about 2018.
2026 (through 2026-09-28): 73,400 CVEs, day 271 of the year;
annualizes to about 99,000, roughly 2.0 times 2025
growth: +32% into 2024 and +23% into 2025, against about +98%
annualized for 2026
2026 quarters: Q1's 16,255 topped every quarter before it; Q2's
20,871 is another 28% above Q1 and 59% above 2025's largest quarter
doubling arithmetic: a 2026 double of 2025 would require about 99,900
disclosures; the annualized pace is about 99,000, or roughly 2.0 times
The annualization, the growth rates and the doubling arithmetic are this
repository's calculations over the vendored counts, not figures any source
states.
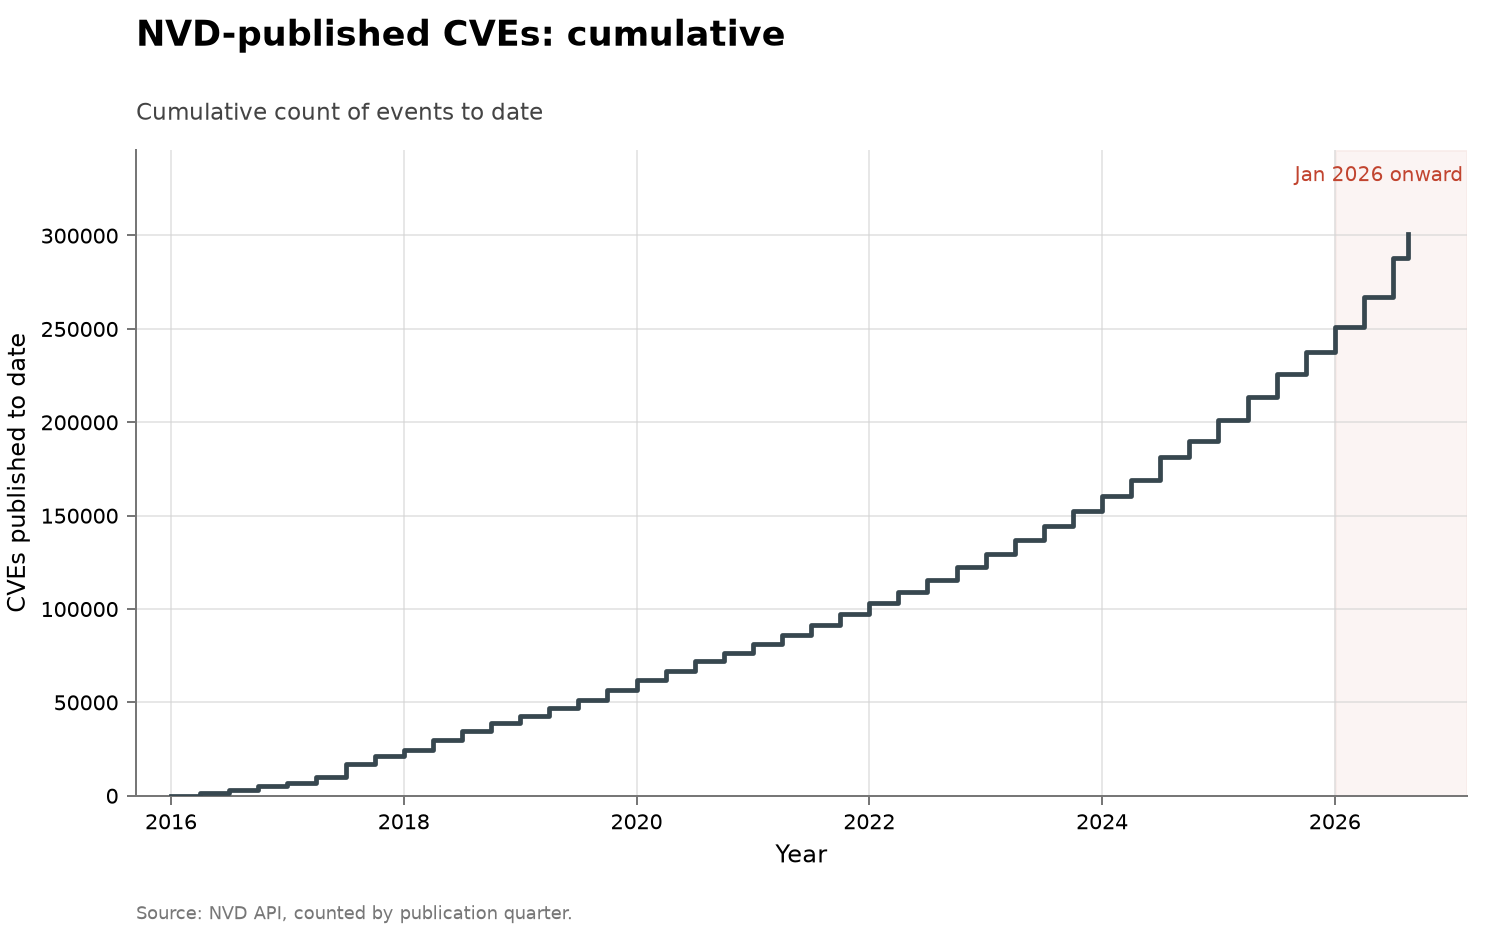
The collection-wide cumulative index redraws this
series as cumulative CVEs published to date:
Method
The CSVs are built by fetch.py. NVD caps a query window at
120 days and rate-limits unkeyed callers, so each year is fetched as four
quarterly windows with a pause between calls and a backoff for the HTML
error pages the API returns when the limit is hit; the script reads
totalResults rather than the records themselves. Quarters are therefore
the query's native grain, and the annual file is their sum.
figure.py calls the shared periodic_stacked() shape in
../../lib/families.py, drawing one bar per
quarter from the nvd_published column of nvd-by-quarter.csv. The bars
are blue, the colour this collection uses for human or uncredited finders,
because nothing in this series is attributed to anyone; there is no red band
to draw. The partial_quarter row is outlined in dark grey and annotated
with the data_through value. The axis is linear and January 2026 onward is
shaded, as in every figure here. The kev_added counts plotted in
all software: known exploited were once
a second column of this file and now live in that folder; the two are drawn
as separate figures because they differ by two orders of magnitude.
check.py recomputes the fact lines above from the CSVs.
Limitations
a disclosure count is not a discovery count. It rises when vendors
process and publish more reports, whatever produced the reports.
no attribution of any kind. Not one row here is credited to AI, to a
human, or to a tool, so any AI reading of this chart is imported from
elsewhere.
the population grows with the count. There is more software every
year and more numbering authorities publishing about it, so this is not a
depletion curve on a fixed target the way the curl and OpenSSL series
are.
one vendor can move the aggregate. A CVE is published when a
numbering authority's process publishes it, so one organization's
internal pipeline shift shows up in the national count.
the enrichment step lags the submissions. NIST reports 263% growth in
submissions between 2020 and 2025, and enrichment of nearly 42,000 CVEs
in 2025 that still fails to keep pace, so the published series reflects a
processing constraint as well as a discovery one [@nist2026cvegrowth].
AI attribution
No CVE record in this series carries a finder credit; nothing here can be
attributed to AI, to a human, or to a tool, as of the 2026-09-28 read of the
API [@nvd2026api]. Claims connecting the 2026 records to AI sit outside the
series: Anthropic's Mythos preview claims "thousands" of previously unknown
vulnerabilities, an unaudited vendor figure [@anthropicmythos2026], and
press reporting frames the 2026 records as AI-driven
[@bloomberg2026recordflaws]. Neither maps to identifiable rows here; for
attribution that can be counted, the fixed-codebase series under Sources
are the instrument.
Sources
[@nvd2026api] — the query interface behind every count here; windows are
capped at 120 days and unkeyed callers are rate-limited.
[@nist2026cvegrowth] — NIST's account of record CVE growth and its
enrichment backlog, cited for the processing-constraint limitation.
[@bloomberg2026recordflaws] — press reporting of record 2026 disclosure
counts; the counts here are this repository's own query against the
government API behind that reporting.
[@anthropicmythos2026] — the Mythos preview, an unaudited vendor claim
with no per-CVE mapping into this series.
[@darpa2025aixcc] — the AI Cyber Challenge: seven autonomous systems
measured on a fixed task set, which no aggregate disclosure count
supplies.
Sibling series:
all software: known exploited counts
catalogue additions for observed exploitation, a different unit on a
different clock; curl is a fixed codebase with
named finders; Microsoft counts one
vendor's own CVEs, a subset of this aggregate.