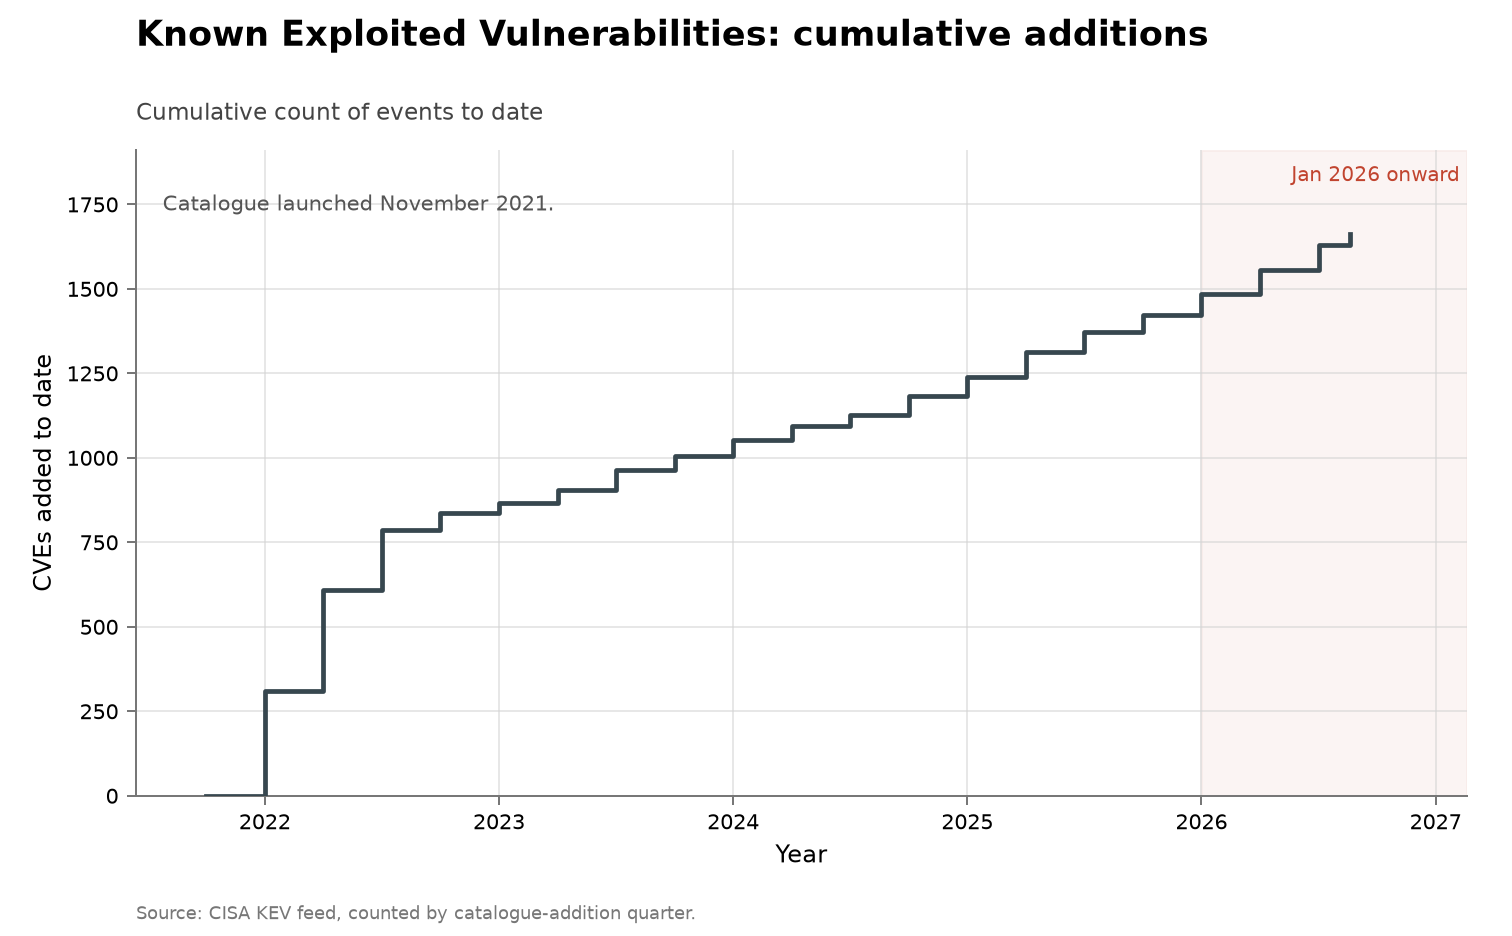
kev-by-quarter.csv; annual totals in kev-by-year.csvThe final bar is a partial quarter; hover for the flag.
CISA's Known Exploited Vulnerabilities catalogue lists CVEs that have been
observed being used against someone. An entry is dated by its dateAdded
field — when CISA added it, which can be years after the CVE was published.
The catalogue launched in November 2021, and its opening quarters populated
it with older entries.
A "discovery" in this series is one catalogue addition. It is a statement about observed exploitation and about one agency's publication process, not about when a flaw was found. The other series in this domain count what gets found or disclosed; this one counts what gets used. The two clocks are not aligned by cohort: dividing one year's additions by the same year's disclosures does not give the share of that year's vulnerabilities that turned out to be exploited.
The collection-wide cumulative index redraws this series as cumulative catalogue additions to date:
The CSVs are built by fetch.py, which reads CISA's JSON feed
and buckets every entry by the year and quarter in its dateAdded field.
The catalogue was read complete at 1,728 entries on 2026-09-28. At that
read, 191 of the 311 entries added in 2021 and 464 of the 555 added in 2022
carried CVE identifiers from earlier years; the per-entry identifiers are
not vendored here, so those two counts are a fetch-time observation rather
than a fact recomputable from these CSVs. The identifier year is a
lower-bound diagnostic of the launch backfill: the tall 2021–2022 bars are
catalogue population, not a contemporaneous exploitation rate.
figure.py calls the shared periodic_stacked() shape in
../../lib/families.py, drawing one bar per
quarter from the kev_added column of kev-by-quarter.csv. The bars are
blue because the catalogue carries no finder attribution to colour by. The
partial_quarter row is outlined in dark grey and annotated with its
data_through date; the axis is linear and January 2026 onward is shaded,
as in every figure here. The CSV starts in 2016, a range inherited from the
disclosure series this one is read against, but the chart drops the leading
all-zero quarters — found in the data, not hardcoded to a year — because
the catalogue did not exist before November 2021, and a zero drawn there
would read as a quarter in which nothing was added rather than a quarter
with no catalogue to add to. A note on the chart states the launch date.
This series and all software: disclosed
once shared a file and are drawn as separate figures because they differ by
two orders of magnitude; sharing an axis previously required a log scale.
check.py recomputes the fact lines above from the CSVs.
dateAdded values,
neither of which this folder vendors; no claim about the exploited share
of any cohort is made here.The catalogue records neither who found a flaw nor who exploited it. No entry carries any AI credit, and none can, as of the 2026-09-28 read of the feed [@cisa2026kev]. AI-side discovery claims sit in the finder-credited series listed under Sources, not in this one [@googlebigsleep2024].