This is a draft. It asks a single question: when an AI system makes a discovery — finds a vulnerability, proves a bound, sets a speed record — which theory of AI’s contribution best fits the evidence? Three domains are worked through in detail: cybersecurity, mathematics, and algorithms. They are not a natural kind of intellectual activity; they are the places where somebody keeps score, so that a machine’s contribution can be dated, attributed to it, and set against the human record. A few other scored fields — weather forecasting, integer factorization — are tracked in Scope as extra tests of the one thing a curve can answer: did the rate bend when AI arrived? The evidence itself lives in a companion source log; this document cites it by anchor and stays focused on the argument. Load-bearing claims are dated and sourced there so a later reader can check and update them.
Scope
We want to know how AI is going to bend these efficiency curves. : We plot declining cost (increasing efficiency) for a bunch of different technologies, and most of them fall in fairly consistent pattern [→ OWID cost curves]. We’re expecting AI to bend those curves down, and it’s starting to happen, but hard to say how much.
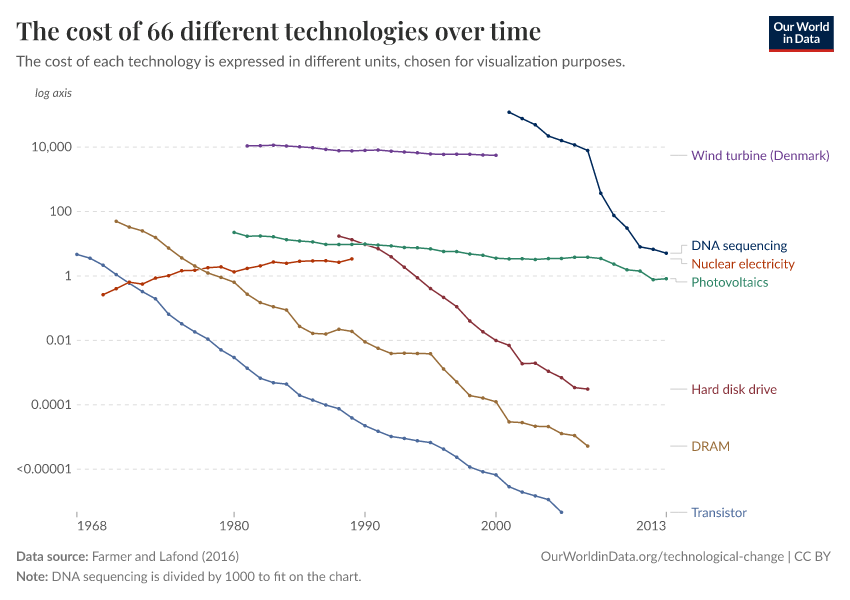
“Discovery” is the object, and it is a measurement convention rather than a claim about where results come from. : The word covers finding a vulnerability, tightening a bound, and shipping a speedup, because all three are cases of a result that can be dated, attributed, and checked against a prior record. That is chosen for tractability, not for theory: a domain is in this post because someone keeps score in it, not because it is a natural kind, and the selection criterion — public, dated, finder-attributed records — does more work than any topical label. Two cautions come with it. The word discovery implies a result that pre-existed and was found, which is apple-picking’s own ontology; recombinant-search and task-replacement accounts would say results are combined or produced rather than picked, so the frame must not be read as already conceding the question. And of the three worked domains, algorithms fits the word worst: much of what is measured there — kernel fusion, hyperparameter tuning, library substitution — is optimization throughput rather than discovery, and the domain’s own headline benchmark finds models doing “surface-level optimizations” instead of algorithmic innovation [→ AlgoTune]. That mismatch is treated as a finding below, not smoothed over.
Ordering domains by how expensive their verifier is turns the argument’s main mechanism into a test. : The account that survives best below is that AI produces complete contributions where checking a candidate is cheap and fast. The three worked domains are all cheap-verifier domains — an exploit either fires, a formal proof either checks, a kernel is either faster — so on their own they cannot test that claim, only illustrate it. The extra fields tracked in this section are chosen to span the cost of verification instead: weather forecasting is checked against reality in days [→ weather forecasting], integer-factorization records are checked instantly but arrive rarely [→ factoring records], and drug discovery is checked in years and billions, where the log already finds the proxy clearing while the objective does not [→ AI-discovered drugs]. If the verification-cost story is right, the bend should be largest where the check is cheapest. It is not: the cheapest-verifier field of the three shows no bend in its skill trend, and the one whose verification is instant has produced no record at all since February 2020.
- Those curves are already fast without AI, and they differ by three orders of magnitude.
- A theory that predicts AI bends the curve has to beat rates that were this fast before AI existed. Of the 66 technologies, only five halve faster than every two years, and the fastest — DNA sequencing at about 8.6 months — is the same number as the fastest measured AI algorithmic-efficiency rate [→ efficiency rates]. At the other end, analytic number theory’s exponents halve on timescales of 82 to 1,204 years [→ ANTEDB rates], and classical algorithmic progress moves in jumps every three to five years [→ SAT Museum]. “Does AI raise the rate” is therefore three different questions, and a contribution invisible against the first would be transformative against the last.
- The volume of research output has already bent. The discovery curves have not.
-
This is the wedge the rest of the post is about, and it is visible in five series that need no interpretation. Papers: arXiv submissions rose from 17,271 in the month ChatGPT was released to 32,040 in June 2026, an 85% rise after decades of much steadier growth [→ arXiv]. Code: quarterly git pushes to GitHub roughly doubled in five quarters, 168 million in late 2024 to 320 million in early 2026 [→ GitHub]. Packages: PyPI’s growth rate roughly doubled after 2024 [→ PyPI]. Against that, the series that measure asking another human collapsed: Stack Overflow questions fell about 98% from their pre-ChatGPT level [→ Stack Overflow questions]. And formal publishing, the control, rose through the period with no clean bend at all [→ Crossref].
None of those series has authorship labels, so no AI share can be read off them, and a push is not a unit of working code. What they establish is that the artifact count is accelerating. Whether the stock of results is accelerating is a different question, and it is the one the three domains below are chosen to answer, because in each of them somebody records what was actually found, proved, or made faster.
There turns out to be a third thing a curve can do, and weather forecasting is the case that shows it. Four machine-learning models beat the physics incumbent between 2022 and 2025, and ECMWF then made its own ML model operational — but the skill gains are 4 to 25% against a reported thousandfold cut in the energy cost of producing a forecast, and nothing in the sources claims the forty-year trend of about a day of skill per decade has steepened [→ weather forecasting]. So the categories are: volume up sharply, cost down by orders of magnitude, and the discovery rate roughly unchanged. Most of this post is about the third one, and it is worth keeping in view that the second is where the most dramatic measured effect in any field examined here actually sits.
- The macro estimates cannot settle this, because they exclude the channel in question.
-
The background fact every theory here is a story about is that research productivity has been falling: more researchers are needed for each doubling of progress [→ ideas harder to find]. The two headline macro estimates of AI’s effect both leave out the mechanism that would reverse it — Acemoglu’s modest total-factor-productivity estimate and Aghion and Bunel’s larger one are both explicit that the ideas channel, AI improving research itself, is not in them [→ Acemoglu, Aghion and Bunel]. So the number that would answer this post’s question is by construction absent from the papers most often cited for it, which is why the argument works from three domains instead.
Two other curves belong in view for scale. Hardware price-performance improves at a measured rate that any algorithmic estimate should be compared against rather than reported alone [→ hardware price-performance]. And model capability itself is rising on a dated trend, in the length of task a model can complete [→ task horizons] — a capability series, not a progress series, which is exactly the distinction the rest of the post turns on.
- The short answer is that almost no discovery curve bends where the volume curves do.
- Of the record and discovery series in the three domains, exactly one bends in the agent era: vulnerability discovery on fixed codebases, which rose about fivefold on curl with AI credited on a large share of it [→ curl vulnerabilities]. Everything else with a long enough baseline to show a bend does not — compression records, chess engine strength, MIP solver speedups, the matrix-multiplication exponent, analytic number theory’s exponent bounds, and the two ML speedruns all continue at or below their previous pace [→ compression records, Stockfish, Gurobi, nanogpt, CIFAR-10, ANTEDB rates]. One series has not merely failed to bend but has stopped outright: no integer-factorization record has fallen since February 2020, in a domain where verification is instant and the previous rate was about seven digits a year [→ factoring records]. That gap between accelerating output and unbent progress is what the four theories below are competing to explain.
Four theories of AI’s contribution
Before looking at the evidence it helps to be explicit about the competing accounts of what AI is doing to R&D. Four are worth putting head-to-head. Some are formal models and some are verbal mechanisms; they overlap, but they make different enough predictions to earn separate columns in the evidence below. Three further accounts — a verification bottleneck, recombinant search, and recursive feedback — are set out in Other theories at the end, either because they refine task replacement rather than rivalling it or because they speak to aggregate dynamics rather than to the shape of an individual result.
- Human acceleration: AI multiplies human output by a constant.
- On this view AI is a better tool, like a faster compiler or a search engine. It makes every researcher some factor more productive but contributes nothing a human didn’t drive, and it doesn’t change the shape of what gets done — the mix of easy and hard results is the same, just arriving faster. Signature prediction: no result appears that a human didn’t direct step-by-step.
- Human replacement: AI is a researcher, and the only limit is cost.
- The “late-RSI” view (Davidson and Houlden 2025; Eth and Davidson 2025): AI has already reached human-level research ability, so the binding constraint is the compute cost of running more of it. Signature prediction: contributions are additive and scale with spend — N agents are worth roughly N humans — and there is no reachable task a sufficiently-funded agent cannot do.
- Task replacement: AI substitutes on component tasks while bottlenecks determine the result.
- The standard R&D version is Benjamin Jones’s task model [→ Jones]. Research progress combines a continuum of complementary task outputs. Humans can perform every task; AI performs a share \(s_t\), with productivity \(M_t\) on those tasks and bottleneck strength \(\theta\). AI therefore produces inputs into a result, not generally a standalone result: while \(s_t<1\), humans still perform the remaining tasks, which can severely constrain progress. This is not an intrinsic human requirement — at \(s_t=1\), the model permits fully automated R&D — nor is the task boundary fixed, since Jones explicitly studies it expanding. Signature prediction: gains track task coverage, relative task productivity, and complementarity; extreme performance on a narrow subset has limited effect when human-only tasks remain bottlenecks.
- Apple-picking: AI picks real but low fruit, with a moving ceiling.
- The apple-picking model: an AI agent is like a robot that picks apples cheaply but can only reach up to a height \(\lambda\). It finds genuine, previously-unpicked fruit, but disproportionately low fruit; its returns diminish sharply and are non-additive (running it twice is not worth two humans); it contributes most where humans have picked least; and each model generation raises \(\lambda\) by a band. Formally, apples remaining after human and agent expenditure \(x_H, x_A\) is \[\text{apples remaining}= \underbrace{\lambda\, e^{-r_Hx_H-r_Ax_A}}_{\text{apples on bottom}}+\underbrace{(1-\lambda)\,e^{-r_Hx_H}}_{\text{apples on top}}.\] Signature prediction: genuine new finds, but shallow, bounded, non-additive, front-loaded, and staircased by model generation.
- The theories are separated by eight questions.
- Everything below is an attempt to answer these, because they are where the four accounts disagree. The table is deliberately outside this definition-list cell so it can use the full page width.
| Question | Human acceleration | Human replacement | Task replacement | Apple-picking |
|---|---|---|---|---|
| Rate of efficiency growth | One-off level jump, slope unchanged | Slope rises with AI spend, no ceiling | Slope rises only as far as the bottleneck allows | Burst then decay, re-steepening each generation |
| Autonomous contribution | None; every result is human-directed | Complete results at any reachable difficulty | Only where AI covers the whole task bundle | Yes, but concentrated in easy results |
| Demand for humans | Rises; AI complements every researcher | Falls; researchers substitutable at the AI price | Falls on automated tasks, rises on bottleneck tasks | Falls for low fruit, holds for high fruit |
| Expertise of discoverers | Unchanged; the same experts, working faster | Irrelevant; a budget substitutes for expertise | Shifts to whoever holds the non-automated skills | Lower on average; experts keep the hard remainder |
| Diminishing returns to AI spend | None to trade off; AI spend scales with headcount | Constant returns; N agents ≈ N humans | Sharp, once AI’s own tasks are saturated | Sharp; repeat runs re-find picked fruit |
| Intertemporal substitution of AI spend | None; the multiplier applies as work arrives | High; spend earlier to pull results forward | Deferred as coverage widens, but early spend costs nothing later | Deferred, and early spend cannibalizes later yield |
| Where the impact lands | No differential beyond routine workload | Where research labor is the largest cost | Where the automatable task share is highest | Where humans have searched least |
| Benchmarks most predictive of value | Human time saved on a real task | Cost per solved task, at any difficulty | End-to-end workflow coverage, not per-task scores | Realistic starting points and repeat-run yield |
The last row asks about measurement rather than about the world, but the theories disagree about it sharply enough to be worth asking, and it is the row a reader can act on soonest. Rows two, three, four, five, seven and eight are the ones the evidence below can now speak to — the expertise row was the thinnest of them until randomized evidence accumulated, and is now among the best identified [→ experimental evidence]. Row one can be answered only where a series has a pre-AI baseline, which is rarer than it sounds and is why the record series carry so much weight below. Row six remains untested everywhere, for a reason the formalization explains rather than excuses.
The clean reading is unchanged at the extremes: autonomous end-to-end results kill human acceleration, and non-additivity plus a ceiling kills human replacement. The live comparison is between the last two columns, which agree about autonomy and about diminishing returns and differ on why — task coverage versus a depleting stock of reachable results.
The next section scores the eight questions by domain, as a map of what follows. Then each domain section takes the same eight questions in the same order, one or two slugs to a question, so a question can be read across cyber, math, and algorithms. Each opens by saying what “efficiency” means in that domain, because the OWID curves have a unit and these domains need one too.
Evidence summary
The same eight questions, now scored by domain, as a map of the three sections that follow. Each cell asks one thing only: is the evidence in that domain consistent with apple-picking? ✅ consistent, ❌ inconsistent, ❓ unclear or untested. The scores are judgments about the sources set out below, not measurements, and a reader who weighs the counterexamples differently should expect to move two or three cells.
- Consistency is a weaker test than discrimination.
- Most ✅ cells are equally consistent with task replacement, because the two theories agree about far more than they disagree about — as the formal section shows, they differ in whether the ceiling on AI’s contribution scales with headcount, not in whether returns diminish. So the table below is a scorecard for one theory, not a comparison between theories. The three tests at the end of the formal section are the comparison, and none of them has been run. The table sits outside this cell so it can use the page width.
| Question | Cyber | Math | Algorithms |
|---|---|---|---|
| Q1 growth rate | ✅ a real fivefold bend, in shallow finds | ❓ AI steps median +1%, century curves untouched | ❓ shallow finds, no burst in seven record series |
| Q2 autonomy | ✅ zero-days and CVEs at scale, mechanical classes | ✅ autonomous, ordinary-sized steps, one deep exception | ✅ records and a competition win, where verifiers are cheap |
| Q3 demand | ✅ triage revalued, enumeration devalued | ✅ each result pulled in more experts | ✅ the deep gains are still human, and Q&A collapsed |
| Q4 expertise | ❌ concentrated in a few named people | ❌ verification is expert-only | ❓ compression in routine work, concentration at records |
| Q5 returns | ✅ duplicates, once disaggregated | ❓ an 8B model matched it, but no return curve | ✅ humans overtake by 8 hours; solver gains collapsed |
| Q6 intertemporal | ❓ smooth path is the wrong test | ❓ generation clusters confounded | ❓ harness effects, also wrong test |
| Q7 incidence | ❓ under-audited fits, hardened code doesn’t | ✅ obscurity rather than difficulty, and non-uniform returns | ✅ collapse on mature repositories |
| Q8 benchmarks | ✅ denominators travel, scores don’t | ✅ bounds series beat problem counts | ✅ real baselines predict, multipliers don’t |
Fourteen cells consistent, two inconsistent, eight unclear. The distribution matters more than the count, because the marks are not scattered: they cluster by row, and two rows changed when the record series arrived.
- Expertise splits by tier, which is a correction to an earlier version of this argument.
-
Q4 used to be uniformly ❌ here, on the reading that all three domains show the expertise requirement moving rather than falling — which is task replacement’s prediction, not apple-picking’s. That reading was built from discovery-level observation only, and the log now carries eight randomized or quasi-experimental studies on who gains from AI [→ experimental evidence]. They point the other way in ordinary work: three coding trials find less-experienced developers gain most, with a pooled 26.08% task increase where “less experienced developers had higher adoption rates and greater productivity gains” and an earlier trial finding the same interaction [→ pooled RCTs, Copilot RCT], and three writing, support, and problem-solving experiments find the productivity distribution compressing toward the less skilled [→ Noy and Zhang, support agents, education gap]. That is apple-picking’s Q4 prediction, measured by randomization.
At the discovery tier the opposite holds, and holds hard. AI-credited vulnerability discovery is concentrated in a handful of named people — one team accounts for 121 of Firefox’s 137 AI-credited advisories, and one person appears in both that credit line and OpenSSL’s [→ Firefox advisories, OpenSSL vulnerabilities]. Detection of Mythos-class bugs democratized to public models while weaponization did not [→ Vidoc]. Sorting a real solve from a plausible one stayed expert-only, with about nine incorrect among forty-seven AI-standalone cases [→ Erdős wiki]. The kernel records came from a research harness rather than from anyone prompting a model [→ TTT-Discover]. And the oldest record AI has broken in this log fell only after the system was handed the key construction [→ record steps].
There is a model that predicts exactly this split, and it is not apple-picking: assistive AI helps the least knowledgeable while autonomous AI helps the most, because autonomy substitutes for the routine part and leaves judgment as the binding input [→ Ide and Talamas]. The routine trials measure assistance; the discovery cases are attempts at autonomy. So the honest reading is two-tier, and the two-tier structure is itself apple-picking-shaped: low fruit becomes reachable by the less expert, high fruit stays with experts. What the model gets wrong is not the shape but the level at which it bites — every discovery in this post still routes through expert hands, so the compression is real in routine work and absent where the results the post is about get made.
- Where apple-picking wins, it wins on depth and on incidence — and the depth claim is now measured.
- The ✅ marks concentrate in Q2, Q3, Q7 and Q8: the finds are real, they land where humans looked least, the deep work stays human, and the benchmarks that predict value are the ones with a realistic starting point. The new evidence is that “shallow” stopped being an impression. On the AlphaEvolve mathematics problems, the median AI record step is +0.98% against +2.52% for human computer search and +2.83% for human work by hand, and the AI step is smaller than the human steps on the same quantity in eight of the twelve contested cases [→ record steps]. On the one leaderboard where both compete under one rule set, AI holds 4 of 86 records at about 1% each while the deep gains are human at 8% and 21% [→ nanogpt]. Two independent quantifications of the same claim is the strongest thing the model has going for it.
- Q1 is the row that got worse for apple-picking, not better.
- The model’s Q1 prediction is a burst then decay, re-steepening each generation. Cyber delivers the burst: about 13.7 curl disclosures a year over 2014–2023 against roughly 72 a year in 2026, with AI-credited finders going from none before 2025 to 42% of 2026 [→ curl vulnerabilities]. Nowhere else does. Seven record series that now run through the agent era show no acceleration at all, and two of them — the CIFAR-10 speedrun and modded-nanogpt — flattened as their records went AI [→ CIFAR-10, nanogpt]. Compression’s uncapped frontier has not moved since October 2023 [→ compression records]. Chess engine gains fell from about 47 Elo a year in 2022–23 to 18–31 a year in 2024–26 on one fixed setup [→ Stockfish]. A decay with no burst before it is consistent with depletion that predates AI, which is a different claim from the one the model makes.
- The intertemporal row is untested everywhere, and the obvious test is the wrong one.
- Q6 is uniformly ❓, and the formalization explains why the reader should not read that as a failure. The evidence people reach for is the staircase — do gains arrive in discrete bands at model releases? — and every series that could show one says no: cyber shows a smooth exponential [→ AISI cyber], the algorithms domain shows harness effects swamping generation effects [→ PERFOPT], and none of the seven record series has a generation-linked band in it. But the staircase is a claim about the time path of the reach ceiling, not a prediction of the production function. The actual intertemporal prediction is that past spend lowers the current return to spend on the same targets, and no source in this log measures it. Meanwhile there is a mundane reason to defer that has nothing to do with capability: inference prices fell somewhere between 9× and 900× a year depending on the milestone [→ inference prices].
- The labour-market evidence sits outside the three domains and points one way on demand.
- Q3 is scored above from inside the domains — triage, coordination cost, Stack Overflow’s collapse. The wider evidence agrees on direction and carries an external-validity discount, since none of it is about discovery. Freelance demand fell, and fell hardest for top freelancers [→ freelancer demand]; postings for automation-prone freelance work fell 21% [→ posting demand]; entry-level employment in AI-exposed occupations shows the sharpest effect [→ canaries]. Against that, adopting firms grew rather than shrank [→ French firms], and a decade of AlphaFold barely changed who collaborates with whom in structural biology — the closest analogue in the record to a research field absorbing a genuinely transformative tool [→ AlphaFold collaboration]. Two cross-cutting results qualify all of it: gains reverse outside the tool’s competence [→ jagged frontier], effects divide by prior skill rather than applying uniformly [→ Kenyan entrepreneurs], and individual creativity rises while collective diversity falls [→ idea diversity]. Practitioners’ own stance matches the split: adoption high, trust low [→ Stack Overflow survey].
- Math is no longer where the evidence is thinnest.
- This is the other row that changed. Math used to have five ❓ or ❌ cells for measurement reasons — no return curve, no denominator, no dated series. It now has the log’s longest efficiency series and its only measured distribution of AI step sizes. The exponent database yields century-long dated curves for thirty separate quantities, with halving times of 82 to 1,204 years and no AI in any of them [→ ANTEDB rates]; the AlphaEvolve baseline puts every AI record step against the human steps on the same problem [→ record steps]. What remains missing is the same thing missing everywhere: repeated equal-budget runs on a fixed problem population.
Cyber
Cyber is the domain with the most public, dated, dollar-denominated evidence, because 2025–2026 saw both vendor demonstrations and independent government and academic measurement. It is also the one domain where a collective-progress curve visibly bends in the agent era, which makes it the sharpest test of the model.
- Efficiency here is vulnerabilities discovered per unit of search effort, on a fixed codebase.
- Fixing the codebase is what makes the metric conceptually clean. The tempting alternative — bugs found per year across all software — confounds discovery capability with how much new code got written, and code volume is the faster-moving term. Holding the target fixed, the unit is cost per confirmed vulnerability, and the record already supplies both numerator and denominator in places: AISI budgets about $12,500 per attempt, XBOW’s ~1,060 submissions yielded ~132 confirmed-and-resolved, and AIxCC’s organizers report about $152 per competition task [→ AISI runs, XBOW, AIxCC]. The three differ by two orders of magnitude, which is itself informative: cost per bug is set by the difficulty of the target far more than by the price of tokens. The log’s inventory of every such figure shows how unusual it is to have one at all [→ cost per result].
- Three fixed codebases credit their finders, and all three bend upward in 2026 — the one measured bend in the post.
- This is the strongest single piece of evidence anywhere in the argument, because the counting is public and the attribution is per-finder. curl ran at 13.7 disclosures a year over 2014–2023 and about 72 a year in 2026, with AI-credited finders going from none before 2025 to 42% of 2026 [→ curl vulnerabilities]. OpenSSL went from 6 disclosures in 2025 to 38 in part-2026, of which 25 are AI-credited — the highest share in the log [→ OpenSSL vulnerabilities]. Firefox, a codebase two orders of magnitude larger, went from 640 advisories in 2025 to 1,139 in part-2026, with 137 AI-credited against essentially none before [→ Firefox advisories]. Every theory here predicts more finds from a better tool; what the model needs is for the extra finds to be shallow, and they are.
- The extra finds are shallower and less exploited, which is what caps the bend.
- Two independent quality measures move against the volume. Within curl’s 2026, AI-credited issues are 80% rated Low against 48% for other finders, and nobody found anything rated High or Critical at all [→ curl vulnerabilities]. Ecosystem-wide, disclosures rose steeply while the share reaching CISA’s exploited-vulnerability catalogue fell from 0.49% of 2025’s to 0.37% of 2026’s [→ NVD and KEV]. So the curve that bent is the count, and the value per unit of count fell as it bent. Two cautions hold the reading down: the severity shift began before AI arrived, and the exploited-catalogue share is mechanically biased low for recent quarters because exploitation is discovered later than disclosure.
- Automation as such is not what moved the curve.
- The obvious alternative explanation — automated search finds more bugs — is contradicted by the largest automated search programme in open source. OSS-Fuzz findings fell from 1,041 in 2020 to 244 in 2025, over exactly the period the AI-credited counts rose from zero [→ OSS-Fuzz]. The pre-LLM autonomy baseline points the same way: DARPA’s 2016 Cyber Grand Challenge already demonstrated autonomous discover-and-patch, and it did not bend any disclosure curve [→ Cyber Grand Challenge]. Whatever changed in 2026 is specific to language-model agents, not to automation.
- The one clean year-over-year measurement on a fixed task set shows a large gain.
- Almost every capability series in this domain confounds model generation with harness, prompt, and task mix. DARPA’s AIxCC is the exception, because the organizers ran the same competition structure twice: between the August 2024 semifinal and the August 2025 final, the share of planted vulnerabilities the autonomous systems identified rose from 37% to 86%, and the share of those they patched from 25% to 68% [→ AIxCC]. Two caveats hold the inference down. The teams changed their systems as well as their models, so this is progress in the whole stack rather than in the models alone; and the denominator itself was revised after publication, from 70 planted bugs to 63, which moved the headline rate from 77% to 86%. Google’s Project Naptime made the same point earlier and more bluntly: tooling around the model moved its benchmark scores by an order of magnitude [→ Naptime].
- A fixed codebase holds a finite stock, which the OWID curves do not.
- This is the one structural disanalogy worth keeping in view. A cost curve for photovoltaics has no exhaustion built in; a fixed codebase holds a finite, depleting stock of bugs, so yield falls over time even for a searcher of constant capability [→ OWID cost curves]. Any efficiency series in this domain therefore mixes two effects — capability rising and stock depleting — and separating them is exactly what distinguishes apple-picking from the alternatives. Depletion is a prediction of the model, not a nuisance to be differenced away, but it does mean a falling bug-per-dollar series is not by itself evidence that agents got worse. It also means the stock is replenished: new code ships constantly, which is why the regenerating-stock variant probably applies here and not in math.
- The finds are mostly novel instances of known bug classes — apple-picking over human replacement.
- The shape of the finds favors “shallow, low fruit,” which caps how far the curve bends. The headline bugs are mechanical memory-safety classes — stack buffer underflow (SQLite), out-of-bounds write (FFmpeg), DoS (OpenBSD) — and Vidoc reproduced the detection of Mythos-class bugs with public models “but they didn’t build the weapon” [→ Vidoc]. There is no clear public case of an agent discovering a genuinely novel vulnerability class or a deep architectural flaw. That absence is what human replacement would not predict.
- Depth is not literally absent, though. — against a too-strong apple-picking
- The counter-pressure keeps “shallow” from becoming unfalsifiable. Anthropic presents the OpenBSD SACK bug as requiring reasoning about signed-integer overflow, and AISI scores a 32-step attack chain rather than isolated one-step finds [→ Mythos, AISI cyber]. “Shallow only” is too strong; “disproportionately shallow” is what the record supports.
- Agents cut off a live zero-day and found flaws humans hadn’t. — against human acceleration
- The autonomy question has the clearest answer here, and it rules out pure acceleration. Google’s Big Sleep found CVE-2025-6965, a live SQLite memory-corruption zero-day “known only to threat actors,” and cut it off before exploitation — reportedly the first time an AI agent foiled an in-the-wild exploit — and separately filed 20 previously-unknown OSS bugs with a human only in final review [→ Big Sleep]. The government anchor is stronger still: DARPA’s AIxCC finalists processed 54M lines of code and uncovered 18 previously unknown real-world flaws [→ AIxCC], and CyberGym’s agents incidentally exposed 15 zero-days in current software [→ CyberGym]. The academic precursors dated the capability earlier: agents exploited one-day vulnerabilities from CVE descriptions in 2024, and teams of agents extended that to zero-days [→ Fang on one-days, Fang on teams]. These are apples humans had not picked, found without step-by-step human guidance. Every remaining theory clears this bar; human acceleration does not.
- Discovery got cheap and triage became the scarce input — task replacement’s reallocation, not human replacement’s substitution.
- Demand moved rather than fell. curl ended its bug-bounty program after AI “slop” reached ~20% of submissions while genuine yield fell: the flood of candidates consumed more human validation time than the finds were worth [→ curl]. HackerOne reports 560+ valid reports from autonomous agents alongside the platform-wide noise problem [→ HackerOne], and NIST’s own enrichment backlog is the same bottleneck inside the government’s cataloguing process [→ CVE growth]. Pricing shows the substitution pressure at the low end, with ARTEMIS reporting AI pentesters at $18/h against $60/h for humans and ranking one 2nd of 11 [→ ARTEMIS]. All of it is the same reallocation: routine enumeration is worth less in human hands, while judging what is real is worth more. Labour-market indicators for the field are the one place to look for the net effect, and they do not yet show a clean one [→ cyber labour].
- The AI-credited finds route through remarkably few hands — against apple-picking’s expertise prediction.
- Apple-picking predicts the average expertise of discoverers falls, and the finder-level data says the opposite in this domain. One team accounts for 121 of Firefox’s 137 AI-credited advisories, and Alex Gaynor of Anthropic appears in both that team’s credit line and OpenSSL’s [→ Firefox advisories, OpenSSL vulnerabilities]. Big Sleep’s twenty OSS filings had a human in final review [→ Big Sleep], and the AISI protocol budgets about $12,500 per attempt on an expert-built harness rather than a prompt [→ AISI runs]. The sharpest split is Vidoc’s: public models reproduced the detection of Mythos-class bugs, “but they didn’t build the weapon” [→ Vidoc]. This is not a diffuse capability arriving everywhere at once; it is a small number of well-resourced efforts pointed at high-value targets, which is task replacement’s prediction rather than apple-picking’s. A lab reporting a null on its own models is worth reading alongside it, since it shows how recently the capability was absent [→ CYBERSECEVAL 3].
- More compute keeps paying off — against a naive apple-picking ceiling, for now.
- This is the single most important tension in the post. The naive apple-picking gloss — “agents hit a compute wall fast” — is contradicted by the best independent evidence. AISI finds cyber performance scales log-linearly with inference-time compute with no observed plateau, up to 100M tokens (a 10M→100M increase improved performance by up to 59%) [→ AISI cyber]; summarizing the UK AISI runs, none of the 100M-budget models “showed signs of diminishing returns,” the basis for the “cybersecurity is proof-of-work now” framing [→ AISI runs]. Taken literally this looks most like human replacement (spend more, get more). The apple-picking model survives only if “diminishing returns” is restated carefully — see the next slug.
- But value per run collapses, even where raw compute keeps paying — against human-replacement additivity.
- The additivity question separates the two survivors, and the answer is no. XBOW’s autonomous pentester produced ~1,060 submissions but only ~132 confirmed-and-resolved, with ~208 duplicates: running the picker again mostly re-finds picked apples [→ XBOW]. The reconciliation: three things get conflated under “diminishing returns” — (a) returns to compute on one attempt (not falling, to 100M tokens), (b) marginal value of repeated runs on a fixed target (falling hard, via duplicates), and (c) a capability ceiling on the deepest tasks. Non-additivity lives at (b) and (c), and it is exactly what human replacement denies. The apples-remaining formulation (per tree) already encodes (b)/(c); the loose “hit a wall” gloss wrongly claimed (a).
- Per-generation gains are real but look smooth, not staircased.
- Apple-picking’s distinctive dynamic prediction — clear a band, then plateau until the next model, so that waiting buys a taller picker — is the weakest-supported. Gains per generation are real (AISI: average steps 1.7 → 9.8 from GPT-4o to Opus 4.6; Lyptus: offensive-cyber horizon ~30s → ~3h, accelerating) [→ AISI cyber, Lyptus]. But these look like a steady exponential, not discrete cliffs, and AISLE finds rankings “reshuffle completely across tasks,” complicating any clean monotonic per-generation story [→ AISLE]. A smooth exponential still rewards waiting, but it gives no band to wait for, which is the specific claim the staircase makes.
- Starting-point dependence holds on average but has striking exceptions.
- Apple-picking predicts agents contribute most where humans have picked least. XBOW’s web-app haul fits the under-audited surface exactly [→ XBOW]. But the marquee finds cut the other way: a 27-year-old OpenBSD bug and a 16-year-old FFmpeg bug that survived millions of fuzz executions sit in heavily-hardened code [→ Mythos]. curl and OpenSSL are themselves among the most-audited code in existence, and they are where the counts bent hardest. Once the picker got tall enough, apples that survived decades of expert review turned out to be reachable — the sharpest tension with a naive starting-point story. (Vendor “N× more bugs” framing is a separate and contested claim [→ Palo Alto, Bloomberg].)
- The frontier is jagged, and verifiability predicts the jags — task replacement and apple-picking both fit.
- “There is no stable best model across cybersecurity tasks… capability rankings reshuffle completely” [→ AISLE]. Low apples: systematic enumeration, known-CWE web classes, reproducing known memory bugs (a 3.6B-active-parameter model detected the showcased overflow). High apples: exploit weaponization, deep data-flow logic, full real-world reproduction (CyberGym’s 11.9% ceiling), and — increasingly — triage of a flood of candidates. Jones’s model reads this as heterogeneous task coverage with human-only bottlenecks; apple-picking adds that reachable work should be front-loaded and depleted by repeated runs. Jaggedness alone does not distinguish them.
- Human-time and dollar denominators travel; capability scores don’t.
- Cyber has the best measurement discipline of the three domains, and the split is clear. What predicts value is a benchmark with a human-time or dollar denominator: Lyptus gives independent human-time horizons (P50 ≈ 3 h in 2026, saturating on GPT-5.5), Cybench attaches human solve times to CTF tasks, ARTEMIS prices agents against human pentesters, and AISI’s $12,500-per-attempt budgeting fixes what a “success” cost [→ Lyptus, Cybench, ARTEMIS, AISI runs]. What does not travel is a score on any single task set, because AISLE shows rankings reshuffle completely across tasks [→ AISLE]. The detailed cost-per-bug figures remain vendor-reported or unverified [→ Mythos, Palo Alto], which is the reason to prefer the denominators someone outside the vendor can reproduce. And the developer-facing question — whether AI-assisted code is more secure — is the one measurement here that runs on the defensive side [→ Gemini and developer security].
Math
Mathematics has the most vivid single data point — a model-generated disproof of an 80-year-old conjecture — and the most articulate skeptic in Terence Tao, whose “long tail” and “jumping machines” framings closely track apple-picking. It is also, since this log built the series, the domain with the longest measured efficiency curves and the only measured distribution of AI step sizes. The discipline here is separating three senses of “solved”: a genuinely new AI result, AI retrieval of a forgotten human solution, and human–AI collaboration with substantial human framing.
- Efficiency here has two candidate units, and tightened bounds are the better one.
- The obvious unit is open problems solved per unit of effort, which is what the Erdős-problem counts measure. It is a bad outcome variable: solved-or-not is binary, the problem population is not fixed, and selection dominates, as the Erdős wiki says in its own disclaimers [→ Erdős wiki]. The better unit is a tightened bound. Tao, Trudgian, and Yang’s exponent database records the best known value of each exponent in analytic number theory with a date and a proof, so progress on any one of them is a monotone dated series — the same object as a cost curve, with a number on the vertical axis [→ ANTEDB].
- The bound curves exist now, they run for a century, and there is no AI anywhere in them.
- Extracting the database year by year gives thirty dated series, and they set the baseline the domain previously lacked. The Lindelöf exponent fell 13% across fifteen improvements between 1920 and 2017 — an implied halving time near 500 years — and the six named slices run from 82 to 1,204 years per halving [→ ANTEDB rates]. Nothing in any of them is AI: the database’s authors describe AI integration as a future possibility they have not pursued, the automation that did produce new bounds is a solver over collated relations, and when AlphaEvolve was pointed at analytic number theory it “struggled to take advantage of the number theoretic structure in the problem, even when given suitable expert hints” [→ AlphaEvolve mathematics]. The one recent bend in these records, the zero-density exponent at 3/4 after an 84-year plateau, was made by Guth and Maynard in 2024, by hand. So the domain’s deepest curves are untouched, and the reason given is the shape of the problem — asymptotic inequalities with no cheap score — rather than its difficulty.
- Collating the literature was itself worth new bounds, before any model was involved.
- The exponent database’s launch paper obtained new exponent pairs, zero-density estimates, and additive energy estimates by computer-assisted search over the relations it had collected — in Tao’s words, “in a largely automated fashion (without introducing any substantial new inputs from analytic number theory)” [→ ANTEDB]. This is not an LLM result and should not be reported as one; it is optimization over a relation database. But it is a clean measurement of something apple-picking asserts and the other three theories do not: that an uncollated literature holds reachable fruit which nobody had picked because nobody had systematically combined what was already known. The reach ceiling did not move, and results appeared anyway.
- Where AI does move a bound, the step is ordinary and usually smaller than the human steps around it — the depth claim, measured.
- This is the comparison the AlphaEvolve discussion did not contain, and building it changed what can be said. The frame is the paper’s own problem list, classified by whether a live numeric record exists [→ AlphaEvolve inventory]. Across every record-status problem in that paper, the median AI record step is +0.98% against +2.52% for human computer search and +2.83% for human work by hand, and in eight of the twelve quantities carrying both, the AI step is smaller than the human steps on the same quantity [→ record steps]. Three findings from the same exercise sharpen it. Two of the paper’s claimed improvements are not records at all — its spherical-design constructions beat the library it cites but are worse than, or tie, designs published in 2016 that it does not cite. Both of its max-to-min-ratio records fell within a month to an off-the-shelf commercial solver run with no custom algorithm. And the oldest record it broke, a difference-basis bound standing since 1972, fell only after the system was handed working Singer difference-set code, having failed unaided. The paper’s own framing supports the reading: on several problems further gains are “largely a function of computational investment.”
- AI clears low walls but cannot build on its own progress — task replacement, not human replacement.
- The shape-of-finds question gets its sharpest answer from Tao. AI tools are “jumping machines that can jump two meters in the air… reaching the tops of the lowest walls,” but “what they can’t do is jump a little bit, reach some handhold, stay there, pull other people up, and then try to jump from there. There isn’t this cumulative process.” And: “these tools either succeed or they fail. They’ve been really bad at creating partial progress” [→ Tao]. In Jones’s terms, AI performs some research tasks while humans still supply framing, verification, and cumulative direction; the machine task output is not yet an independent research process. A genuine human replacement would do cumulative, partial-progress work, so the absence of it favors both task replacement and apple-picking.
- An AI disproved an 80-year-old conjecture without being aimed at it. — against human acceleration, and against a too-strong apple-picking
- The autonomy bar is cleared, and by an unusually deep result. A general-purpose OpenAI model disproved Erdős’s 1946 unit-distance conjecture, producing a construction with growth \(n^{1+\delta}\); nine mathematicians produced a human-verified account and Will Sawin made the exponent explicit (>1.014) [→ unit-distance]. OpenAI says the model was not math-specialized, not scaffolded to search proof strategies, and not aimed at this problem. This simultaneously kills human acceleration and stress-tests apple-picking’s “shallow, neglected” story. The qualification comes from a mathematician who examined it: Williams’s account of what played to the model’s strengths reads the problem as unusually amenable to a construction search rather than as representative hard mathematics [→ Williams]. Erdős #728 is a second, weaker autonomous solve, hedged by an operator-in-the-loop convention [→ Erdős #728].
- Autonomy is broad and dated, and it clusters where a checker is cheap.
- Beyond the headline, the record is now thick enough to date the capability. FunSearch produced cap-set and bin-packing results in 2023 [→ FunSearch]; AlphaGeometry and its successor went from olympiad geometry to past the average gold medalist [→ AlphaGeometry, AlphaGeometry 2]; formal proof search moved onto open problems [→ AlphaProof Nexus]; a system produced formally verified IMO 2025 proofs [→ Aristotle]; and the Equational Theories Project settled 22 million implications with humans and machines working together [→ Equational Theories]. Every one of those has a cheap automatic checker attached — a formal kernel, a construction to evaluate, a finite implication to test — which is exactly the split the validation account predicts [→ validation bottleneck]. HorizonMath is the benchmark built on that observation, selecting unsolved problems because verification is cheap [→ HorizonMath].
- Each headline result pulled in more expert human time, not less.
- The autonomous solve was the beginning of the human work rather than the end of it: nine mathematicians produced the human-verified account of the unit-distance construction, and Will Sawin was the one who made the exponent explicit [→ unit-distance]. The mathematicians who worked hands-on with AlphaProof report the same pattern from the inside — the machine output raises the value of the human step that follows it [→ Ringer]. What none of this settles is whether the number of mathematicians rises or falls, only that each result still consumes expert attention.
- Sorting a real solve from a plausible one is still specialist work.
- Apple-picking predicts the average expertise of AI-assisted discoverers falls, and math gives the strongest reason to doubt that in the near term: the verification step is expert-only and unavoidable. The Erdős wiki’s tally of AI-standalone cases includes about nine incorrect among roughly forty-seven, so someone qualified has to separate them [→ Erdős wiki], and Erdős #728 is hedged by an operator-in-the-loop convention rather than counted as a clean solve [→ Erdős #728]. The October-2025 GPT-5 episode is the cautionary case: retrieval of forgotten human solutions was briefly reported as solving, and it took domain experts to notice [→ GPT-5 retrieval].
- There is a harvest, and now some evidence on returns, but still no return curve.
- The non-additivity question cannot be answered cleanly in math, though it is no longer evidence-free. Tao’s arithmetic — “fifty-odd problems solved with AI assistance… but there’s like six hundred to go” — is consistent with an initial harvest leaving a harder remainder, but it is not a success rate: problem selection, effort, and failed attempts are unobserved [→ Tao]. Two newer results bear on returns to the AI-specific machinery rather than to spend. An 8-billion-parameter open model, given the right harness, passed AlphaEvolve’s published bounds on two of its own problems [→ ThetaEvolve]; and randomly sampling from a language model matches the evolutionary machinery on several of the same problems [→ simple baselines]. If a small model and a naive sampler get there, the marginal return to the elaborate system is low, which is adjacent to non-additivity without being the same measurement. What is still missing is repeated equal-budget runs on a fixed problem population.
- Generation-linked clusters are visible but confounded.
- The staircase prediction is again only suggestive. GPT-5.2-era Erdős contributions and the later unit-distance disproof cluster in the timeline, but model release, prompting, scaffolding, researcher attention, and reporting all move together, so attribution to the base-model generation is not identified. The ThetaEvolve result cuts against a generation story directly, since the gain came from the harness on a small old model [→ ThetaEvolve]. FrontierMath gives a capability series but its v2 revision (errors in 42% of problems) blocks a clean time series [→ FrontierMath]. No primary source asserts a “clear a batch, then plateau” dynamic for research math, so the case for deferring effort to the next generation rests on the theory rather than on the record.
- Most solved problems were neglected, not hard-fought — strong apple-picking, with selection bias.
- Starting-point dependence is unusually well-attested here, from primary sources. Tao frames unsolved problems as a “long-tail distribution” with harvesting “at the very end of the tail” — the easy, neglected problems clear first [→ Tao]. The Erdős-problems wiki says so in its own disclaimers, verbatim: it “is not a benchmark,” and “Absence of past progress may reflect obscurity rather than difficulty” [→ Erdős wiki]. A problem “open” for 50 years often means nobody seriously tried. The unit-distance disproof is the standing exception — genuinely hard-fought — so the mechanism is a tendency, not a law.
- The return to effort varies fivefold across one subfield, with no AI involved at all.
- This is the incidence claim measured on human mathematics, which is worth more than measuring it on AI. Sweeping the exponent database across its parameter grids, the century’s improvement ratio varies from 1.00 to 0.20 depending only on which slice of the same three functions you look at, with a dead zone where three grid points never moved once [→ ANTEDB rates]. So within a single well-studied area, the yield to effort differs by a factor of five according to where the effort was pointed. Apple-picking’s Q7 prediction is about AI landing where humans have not looked; this says the underlying distribution of reachable results is that uneven before any AI arrives, which is what makes the shape unremarkable rather than diagnostic.
- Well-posed and verifiable is easy; deep and cumulative is hard.
- Jaggedness, strongly. Low apples: construction and search problems, literature retrieval, competition-style problems. High apples: deep conceptual long proofs, mathematical taste, and partial-progress hill-climbing — Tao’s cumulative-process failure [→ Tao]. The AlphaEvolve mathematics paper is the best single record of both sides, because it reports where the system failed as well as where it did not: roughly a fifth of 67 problems improved, and the failures cluster where the problem has no cheaply scoreable candidate [→ AlphaEvolve mathematics]. The ordering is by feedback-loop length and verifiability, exactly as in cyber and algorithms.
- Counts and contest scores proxy capability; bounds and step sizes proxy value.
- Math used to be the domain where the benchmarks predicted value least well, and the sources still say so about the benchmarks. The Erdős wiki documents ~47 AI-standalone cases while explicitly disclaiming that it “is not a benchmark” [→ Erdős wiki]; IMO 2025 saw an officially-graded gold on problems chosen to be solvable in hours [→ IMO]; FrontierMath rose from <2% to the 40–90% range on hard tiers but revised 42% of its own problems [→ FrontierMath]; PutnamBench started near the floor, which dates the capability without valuing it [→ PutnamBench]; and the GPT-5 retrieval episode shows a count can move without any new mathematics behind it [→ GPT-5 retrieval]. What changed is that the domain now has an alternative: a dated bound series with a real unit, and a distribution of step sizes to place any new result in [→ ANTEDB rates, record steps]. That is the measurement the argument recommends over any problems-solved count.
Algorithms
Algorithmic and code efficiency is the domain the original apple-picking post was built around, and it has both the best-instrumented benchmarks and the longest-running public record series. That combination is what makes it the domain where the slope question can actually be asked: seven series here have a pre-AI baseline and continue into the agent era.
- Efficiency here is already a series of well-known curves, each with a fixed task and a resource denominator.
- Unlike the other two domains, this one does not need a metric invented for it. Compression gives total bytes on a fixed corpus, the Hutter Prize being the standing version. Pretraining gives compute to reach a fixed loss. Solvers give time to optimality on a fixed model set. Inference gives latency or tokens per dollar for a fixed model, which is what the kernel and speedrun records move [→ TTT-Discover, nanogpt]. Classical complexity supplies bounds in the same form as math’s: the matrix-multiplication exponent, SAT solving. Each is a fixed task with a resource denominator, which is exactly the structure the cyber and math metrics had to be constructed to have.
- The pre-AI rate was already fast, lumpy, and in places already stalled.
- Four independent measurements establish what an AI contribution would have to beat, and all four were made before agents existed. Sherry and Thompson traced 113 algorithm families from the 1940s to 2019 and found the distribution bimodal: “around half of all algorithm families experience little or no improvement,” while 14% have “yearly improvement rates greater than 1000% per year” [→ Sherry and Thompson]. Bixby recompiled twelve CPLEX versions on identical hardware and measured a 29,000-fold MIP improvement — then reported that “since 2004 there have been essentially no improvements in the standard LP algorithms” [→ Bixby]. The SAT Museum reran thirty years of solvers on one machine and found “the yearly improvement is mostly rather slow, except for performance jumps in some years, which arguably happen with a frequency of 3 to 5 years” [→ SAT Museum]. Grace’s six-domain survey put algorithmic gains at “roughly fifty to one hundred percent as large as those from hardware progress” while warning that her sample is biased optimistic [→ Grace]. Two consequences matter for everything below: a staircase is this field’s normal shape with no AI in it, and a long plateau is normal too.
- The measured efficiency estimates all stop before the agent era, and the best-measured one turns out to be reference-dependent.
- Compute to reach a fixed language-model performance level has halved roughly every 8 months, with 60–95% of observed gains attributed to compute and data rather than algorithms — a real curve of the OWID kind, ending in 2023 [→ Epoch on LMs]. The vision counterpart gives nine months over 2012–2021 [→ ImageNet], and the original convention, compute to reach AlexNet performance, gives 16 months over 2012–2019 [→ compute-to-AlexNet]. None reaches 2024. And the headline is softer than it looks: rerunning the innovations behind the language-model estimate at small scale accounts for “less than 10x” of the 22,000-fold gain, with the conclusion that “measures of algorithmic efficiency are strongly reference-dependent” [→ Gundlach]. So the pre-AI baseline is well characterized in shape and poorly characterized in level.
- Seven record series continue into the agent era, and not one of them accelerates.
-
This is the domain’s central negative result, and it is the reason the volume/progress wedge in Scope is not an artifact of missing data. The seven are the two compression series (the CPU-capped prize and the uncapped leaderboard, which have different rules and so are different series), chess engine strength, MIP solver speedups, the matrix-multiplication exponent, and the two ML speedruns. The SAT Competition is deliberately not among them, because its benchmark set changes yearly and the fixed-hardware comparison stops in 2022, so it cannot be read as a series at all. The Hutter Prize’s awarded records keep to a 1.0–1.6% cadence and every one is human-written; the uncapped compression frontier has not moved since October 2023 [→ compression records]. Stockfish, measured across 2,542 dev builds against one fixed opponent on one machine, gained about 47 Elo a year in 2022–23 and 18 to 31 a year in 2024–26, with exactly one master commit crediting an LLM — a 0.6% speed patch [→ Stockfish]. Gurobi’s own fixed-machine benchmark reports MILP gains of 8–13% a year for versions 10 through 13, against MIP algorithms that Grace recorded as having “roughly doubled in speed each year” in the early history, and credits no AI in any release note [→ Gurobi]. The matrix-multiplication exponent has no AI step in it and four small steps in fourteen years. The two ML speedruns decelerated as their records went AI. Whatever AI is contributing, none of these curves has bent.
Independent measurement is also getting harder rather than easier: Gurobi withdrew from the main independent solver benchmark in August 2024, so the only continuing MIP series is the vendor’s own [→ Gurobi].
- The most decision-relevant curve is the one nobody outside the labs can see.
- What matters for every question in the table is the labs’ internal algorithmic efficiency: the compute-equivalent gain per year on their own training and inference stack, which is where AI contributions to AI research would show up first and compound fastest. That series is unobserved. The closest public glimpse is AlphaEvolve’s self-reported 23% kernel speedup and recovery of about 0.7% of fleet compute [→ AlphaEvolve]. Epoch’s estimate of the post-2023 rate is a guess with a wide interval — “around 10× per year,” 80% interval 2× to 50× — attached to the observation that “recent evidence suggests that these estimates might not measure what we thought they did” [→ Epoch after 2023]. A rate whose interval spans a factor of 25 cannot show a bend, so the gap between the public proxies and the thing itself remains the largest measurement problem in the post.
- Agents tune and substitute libraries; they don’t invent algorithms — strong apple-picking.
- Shallowness is the most consistent finding in this domain, and it directly caps the achievable bend. AlgoTune averages only 1.72× over expert solvers and reports that models “fail to discover algorithmic innovations, instead preferring surface-level optimizations” — its 142× outlier is a BLAS-for-Python swap, not a better algorithm [→ AlgoTune]. MLGym: models “improve on the given baselines, usually by finding better hyperparameters, but do not generate novel hypotheses, algorithms, architectures” [→ MLGym]. Karpathy’s agent found about 20 retained edits from roughly 700 tried, of the AdamW-betas and scalar-multiplier kind — real and transferable, and he was the one who then stacked them and measured the 11% [→ autoresearch].
- Where AI now holds records, the steps are about 1% and the deep steps are human.
- modded-nanogpt is the closest thing to a like-for-like comparison in the record, because humans and agents compete on one metric under one set of rules. Across 86 records the training time fell about 35×, AI systems hold four of them at roughly 1% each, and the large gains are human — Muon at about 21%, U-Net skip connections at about 8% [→ nanogpt]. The CIFAR-10 speedrun is the second such ledger and reads slightly better for AI: the newest acknowledged record is AI-set and worth 23%, with a further 7.6% claim unacknowledged, but the yearly improvement factor fell from ÷2.9 in 2023 to ÷1.3 in 2025 as the records changed hands [→ CIFAR-10]. Demand for humans is highest exactly where the improvement requires a new idea rather than a faster implementation, which is what both task replacement and apple-picking predict and human replacement does not.
- An LLM-evolved solver won a competition outright, which is the strongest autonomy result in the log.
- The 2025 SAT Competition’s Main Sequential Track was won by AE-Kissat-MAB, a solver evolved by an LLM framework that its authors describe as autonomously enhancing “solver performance through large-model interaction, eliminating the need for extensive human annotation” — 327 of 400 instances against 321 for the human-written Kissat lineage it descends from [→ LLM-evolved SAT]. Three things keep it from settling the domain. The margin is about 2%, the same order as every other AI step here. The competition’s benchmark set changes yearly and the fixed-hardware museum rerun stops at 2022, so the win cannot be placed on the thirty-year curve [→ SAT Museum]. And the framework’s own paper repeatedly says “we identified an effective enhancement approach,” so the autonomy is bounded by human steering across rounds.
- Autonomy on end-to-end research still fails, and the denominators are public.
- The benchmarks that ask for a whole research contribution rather than a step give consistent, low numbers, which is what bounds the autonomy claim. Replicating twenty ICML papers, the best agent reaches a 21.0% average replication score and the authors report that “models do not yet outperform the human baseline” [→ PaperBench]. Reproducing published results from their own released code and data — strictly easier than producing new ones — the best agent gets 21% on the hardest tier [→ CORE-Bench]. On Kaggle competitions scored against public leaderboards, the best setup reaches bronze in 16.9% of them [→ MLE-bench]. The floor these sit above is dated: SWE-bench’s launch measured the best model at 1.96% of real GitHub issues in late 2023 [→ SWE-bench]. And the strongest end-to-end claims are the ones whose denominators most repay stating — papers at “less than $15 per paper” judged by the authors’ own automated reviewer, and one of three autonomous manuscripts above an average workshop threshold [→ AI Scientist, AI Scientist-v2]. The log’s autonomy ladder codes what the word covered in each case [→ autonomy ladder].
- Records fall where the verifier is cheap, and the pre-LLM baseline already did this.
- Autonomy is cleanest where a fast automatic verifier exists. AlphaEvolve found a 4×4 complex matmul in 48 scalar multiplications, the first improvement on Strassen in that setting in 56 years [→ AlphaEvolve]. TTT-Discover’s kernels beat the best human TriMul submissions by more than 15% on every GPU type [→ TTT-Discover]. Every win has a cheap automatable verifier — kernel latency, validation loss, matmul rank. The control matters for attribution: AlphaTensor and AlphaDev produced real algorithmic improvements with no language model involved, and AlphaDev’s sorting routines went into the LLVM standard library [→ AlphaTensor and AlphaDev]. So reinforcement-learning search was already doing this before LLMs, which bounds how much of the current results should be attributed to model capability.
- Throughput rose and composition got worse, which no benchmark here scores.
- Every efficiency measure in this section counts output and ignores what kind of output it is. Three observational series fill that in. Copilot’s project-level effect decomposes into a 5.9% contribution gain against an 8% rise in coordination time from more code discussion [→ Copilot open source]. A regression-discontinuity on GitHub finds coding activity up 5.4 points and project management down 10 points, with the shift larger for lower-ability developers [→ Copilot composition]. And a five-year panel of 211 million changed lines finds moved code — the signature of refactoring — falling from 24.1% to 9.5% while copy-paste rose and duplicate blocks reached “approximately 10x higher than it had been two years prior” [→ GitClear]. DORA’s two waves say the same thing from a survey: throughput’s sign flipped positive while “AI adoption does continue to have a negative relationship with software delivery stability” [→ DORA]. None of this is causal, and the vendor selling code-quality analytics is the one reporting the duplication. But if the extra volume is more duplicated and less consolidated, the volume series in Scope overstate the progress by more than their authorship gaps already suggest.
- Three randomized trials disagree about the sign, and the disagreement is the finding.
-
This is the best-identified evidence in the post and it now has three points rather than one. METR randomized whether 16 experienced maintainers could use AI on 246 real issues from their own large repositories: allowing it increased completion time by 19% [→ METR RCT]. Pooling three firm trials over 4,867 developers gives the opposite sign, a 26.08% increase in completed pull requests with a 10.3-point standard error, and “less experienced developers had higher adoption rates and greater productivity gains” [→ pooled RCTs]. The earliest trial, on a toy HTTP-server task, gives +55.8% with a 21–89% interval and the same expertise interaction [→ Copilot RCT]. Read together: the sign is set by the setting — task maturity, quality bar, and the experience of the worker — not by the tool. That is Q7’s starting-point dependence established by randomization rather than by cross-benchmark comparison, and it is why the expertise row splits by tier.
The perception gap in the METR trial is the reason to distrust every self-reported figure in this post: the same developers forecast a 24% speedup and, having been slowed, still believed they had been sped up by 20%, while economics and ML experts forecast 39% and 38% [→ METR RCT]. Survey evidence that AI raised productivity should be read against that [→ DORA].
- The wins came from experts building harnesses, not from users prompting.
- Where a record fell, the credit sits with whoever engineered the search around the model. TTT-Discover’s kernel wins came from a test-time-search harness applied to an older open model rather than from a new frontier model [→ TTT-Discover], and PERFOPT-Bench shows the same model’s per-task speedup changes materially with the agent framework around it [→ PERFOPT]. The math domain’s version of the same result is sharper still, since an 8-billion-parameter open model with the right harness passed AlphaEvolve’s published bounds [→ ThetaEvolve]. The expertise required has moved from the domain to the scaffold, which is a reallocation rather than a removal.
- Humans overtake agents as the budget grows — the cleanest non-additivity evidence, against human replacement.
- RE-Bench measures the human-vs-agent crossover directly and shows the tortoise–hare shape almost exactly: at 2 h the best agents score ~4× human experts; humans exceed the best agent by 8 h; at 32 h humans reach ~2× the top agent [→ RE-Bench]. GSO adds that inference-time scaling did not rescue the failure, with “limited improvements even with inference-time scaling” [→ GSO]. This is the strongest single refutation of human replacement across all three domains: more agent budget does not keep matching more human hours. The one caveat runs the other way — PERFOPT-Bench’s relay pilot recovered headroom by restarting an agent from an externalized summary, suggesting some apparent within-run plateau is a context-management failure rather than true exhaustion [→ PERFOPT].
- The record clustering is a harness effect, not a model generation.
- The staircase prediction is if anything cut against here, which matters because it is the prediction that would justify deferring spend. TTT-Discover’s win came from the test-time-search harness on an older open model, not a new base generation [→ TTT-Discover]; PERFOPT-Bench shows the same model’s per-task speedup changes materially with the agent framework [→ PERFOPT]; and none of the seven record series has a generation-linked band in it. If observed jumps come from scaffolding and task mix rather than model generations, then waiting for the next generation is the wrong way to buy a taller picker; building a better harness is the cheaper one. There is a separate and better reason to defer, which the model does not need: the price of inference fell somewhere between 9× and 900× a year depending on which capability milestone is priced [→ inference prices].
- Gains collapse from unoptimized baselines to mature repos — starting-point dependence, uncontrolled.
- The direction matches apple-picking, though the endpoints come from different benchmarks. Unoptimized baselines yield large reported gains (AlgoTune’s 142× outlier; Karpathy’s stacked edits) [→ AlgoTune, autoresearch]. Expert-optimized real repos collapse: SWE-fficiency agents reach “less than 0.23x the expert speedup” across 498 tasks, and GSO agents achieve less than 5% success [→ SWE-fficiency, GSO]. SWE-fficiency’s own figure shows why — agents succeed where the original code was slow and the expert patch large, and collapse where the target was already near-optimal, across four different models. This is consistent with value shrinking as the starting point gets more optimized, but it does not isolate the effect: a clean test would run the same agent, scaffold, and budget on staged pre- and post-optimization versions of one codebase.
- Fast, verifiable tasks fall first; long-feedback engineering resists.
- Jaggedness along the axis of feedback-loop speed. Low apples: GPU and kernel optimization, hyperparameter and recipe tuning, naive-code library substitution. High apples: repo-level performance engineering in mature codebases and novel architecture, for which this record has no comparable autonomous success case [→ SWE-fficiency, GSO]. The failure modes both benchmarks name are the same: poor localization of where to optimize, and “lazy optimization strategies.”
- Benchmarks with a real starting point and a real denominator are the ones that predict value.
- This domain has both the best and the most misleading benchmarks, and the difference between them is the answer to this question. The predictive ones fix a realistic baseline and a cost: RE-Bench’s 2/8/32-hour human budgets, SWE-fficiency’s expert-speedup denominator across 498 real tasks, GSO’s real repositories, and AlgoTune’s hard $1-per-task ceiling, under which only surface gains emerge [→ RE-Bench, SWE-fficiency, GSO, AlgoTune]. The misleading ones report a raw multiplier over an arbitrary baseline, which is why AlgoTune’s 142× says more about the baseline than the agent — the log’s inventory of every denominated rate is the fastest way to see how the yields cluster [→ denominators]. Three audits bound even the good ones. A reliability replay across four machine types found reference patches satisfy the original validity rules in every cross-machine replay for only 39 of 102 GSO tasks and 411 of 498 SWE-fficiency ones, and official rankings disagree on 9 of 28 pairwise comparisons [→ reliability audit]. Raw speedup is unsafe as a score, since “some large gains arise from benchmark-specific shortcut exploitation” [→ PERFOPT]. And a vendor conceded exploitable loopholes in its own kernel benchmark [→ robust kernel bench]. Contamination is the fourth: SWE-bench scores partly reflect memorization of the repositories rather than reasoning about them [→ SWE-bench illusion].
Which theory fits?
Reading the three domains against the four theories:
- Human acceleration is dead.
- In every domain, agents produced results humans did not drive — live zero-days, an 80-year-old disproof, records beating the best human kernels, and a competition win over the human-written solver lineage [→ Big Sleep, unit-distance, TTT-Discover, LLM-evolved SAT]. Whatever AI is doing, it is not merely a faster tool for humans.
- Human replacement is refuted by non-additivity, by a ceiling, and now by the record series.
- RE-Bench’s human overtake by 8 hours, XBOW’s duplicate-swamped yield, and the absence of any deep novel bug class or cumulative math progress all say the same thing: N agents are not worth N humans [→ RE-Bench, XBOW, Tao]. The seven record series add a second, blunter refutation. If capability had reached the point where spend was the only constraint, the domains with the cheapest verifiers and the most spend pointed at them — compression, chess, ML speedruns, and factoring, where a candidate is checked instantly — would be exactly where the curves bent, and those are the curves that did not move, one of them not at all in six years [→ factoring records] [→ compression records, Stockfish, nanogpt]. The one apparent exception, cyber compute scaling to 100M tokens with no plateau, is about returns to compute on one attempt, not about matching human hours, and dissolves once the three senses of “diminishing returns” are separated.
- Task replacement carries most of the explanatory weight, once its bottleneck is named.
- Jones cleanly explains why spectacular performance on some tasks can coexist with modest overall progress: AI covers only part of the workflow, and remaining tasks bottleneck the composite result. The evidence repeatedly identifies the same remaining task, which is why the verification refinement in Other theories is worth reading alongside it. Cheap automatic scoring accompanies the strongest results — exploit tests, formal kernels, kernel latency, validation loss, a SAT instance either solved or not — while human review, triage, implementation, and cumulative direction bind elsewhere. The math autonomy record is the cleanest illustration: every dated AI success there has a cheap checker attached, and the domain’s century-long bound curves, which have no cheap checker, have no AI in them at all [→ ANTEDB rates].
- Apple-picking still adds depletion and starting-point dependence, and the depth claim is now measured rather than asserted.
- Jones and the validation account do not by themselves predict that machine finds should be shallow, concentrated where humans have searched least, or depleted by repeated runs. Apple-picking earns its edge from those patterns, and two of them are now quantified rather than illustrated. The median AI record step on the AlphaEvolve mathematics problems is +0.98% against +2.5–2.8% for human steps, smaller than the human steps on the same quantity in eight of twelve contested cases [→ record steps]; AI holds 4 of 86 modded-nanogpt records at about 1% each while the human steps run 8% and 21% [→ nanogpt]. Starting-point dependence is now established by randomization as well as by benchmark comparison, since the same tool speeds up less-experienced developers on ordinary tasks and slows experienced maintainers on mature repositories [→ pooled RCTs, METR RCT].
- The model’s own dynamic prediction is the part the new evidence damages.
- Apple-picking predicts a burst then a decay, re-steepening with each model generation. Exactly one series in the post shows the burst — vulnerability discovery on fixed codebases, up about fivefold with AI credited on a large share [→ curl vulnerabilities]. Seven series with pre-AI baselines show no burst at all, and two of them decelerated as their records went AI [→ CIFAR-10, nanogpt]. A decay with no burst in front of it is what a domain that was already depleting looks like, and the pre-AI measurements say these domains were: LP solvers stalled for eight years after a 3300-fold run, half of algorithm families never improve at all, and the exponent bounds halve on century timescales [→ Bixby, Sherry and Thompson, ANTEDB rates]. The shape apple-picking predicts is the shape these fields already had. And the converse warning is available too: the sphere-packing lower bound accelerated sharply just before the highlighted period, its two largest steps since 1947 landing in 2023 and 2025, with every step a human proof [→ sphere packing]. A recent bend near the shading is not by itself evidence of AI, any more than a flat stretch is evidence of exhaustion.
- Expertise splits by tier, which is a change of verdict.
- An earlier version of this argument called Q4 apple-picking’s one uniform failure, on the grounds that expertise shifts rather than falls. With eight randomized and quasi-experimental studies in the log the picture is two-tier [→ experimental evidence]. In ordinary work the model’s prediction holds and is well identified: less-experienced developers gain most in three coding trials, and three writing, support and problem-solving experiments find the productivity distribution compressing [→ pooled RCTs, Copilot RCT, Noy and Zhang, support agents, education gap]. At the discovery tier it fails badly: 121 of Firefox’s 137 AI-credited advisories come from one team, verification stays expert-only, the records come from research harnesses, and the oldest bound AI broke fell only once the system was handed the key construction [→ Firefox advisories, Erdős wiki, TTT-Discover, record steps]. Since apple-picking predicts exactly this two-tier structure — low fruit to the less expert, high fruit to experts — the row is better read as partially confirming than as refuting. What it costs the model is the claim that the discoveries in this post are being made by less expert people. They are not.
- The wedge the post opened is the thing left to explain, and no theory here explains it well.
- Output volume is accelerating sharply — arXiv up 85% in under four years, GitHub pushes doubling in five quarters, Stack Overflow collapsing 98% — and in the one field where the comparison is clean the cost of a result fell about a thousandfold while its quality improved by 4 to 25% [→ weather forecasting], while almost every discovery curve with a pre-AI baseline continues at or below its previous pace [→ arXiv, GitHub, Stack Overflow questions]. Three of the four theories predict the first fact comfortably and are silent on the gap. Apple-picking has the best available account of it: the volume is low fruit and the curves measure high fruit. But that account needs the composition evidence to be right, and the composition evidence is the weakest kind in the log — observational, vendor-published, and correlational, with refactoring down and duplication up over the same period [→ GitClear, DORA]. Whether accelerating artifact production is progress that the curves fail to capture, or activity that produces no progress, is the single most valuable open question the log has surfaced and the one it can least answer.
- The honest ranking, and what it rests on.
- Human acceleration and human replacement are out. Task coverage plus a verification bottleneck explains the broad pattern across all three domains and does so with fewer moving parts than anything else. Apple-picking adds real explanatory content — measured shallowness, measured starting-point dependence, non-additivity via duplicates — and pays for it with a dynamic prediction the record series contradict and a ceiling nobody has tested. Two rivals inside the model’s own family remain live and are cheaper: a large fishing-out exponent reproduces almost everything without a split stock, and assignment by comparative advantage reproduces the whole cross-section with no depletion at all [→ alternative formalizations]. The evidence assembled here does not separate them, and the reason is always the same: every discriminating test is a difference — a ceiling compared across headcounts, a yield compared across repeated runs on a fixed target — and nobody has run one.
- What would move the verdict.
- Four experiments, in rough order of cost. A repeated-run protocol on a fixed target population, reporting yield per run, would measure non-additivity directly instead of inferring it from duplicate rates, and would separate depletion from assignment; a bug-bounty submission log with duplicates labelled may already contain enough to do a cheap version of it [→ XBOW]. A matched pre/post-optimization test — same model, scaffold, budget and metric on staged versions of one codebase — would isolate starting-point dependence. Extending the fixed-hardware solver museum past 2022 would place the LLM-evolved SAT winner on a thirty-year curve, which is currently impossible [→ SAT Museum, LLM-evolved SAT]. And a dated per-generation series at fixed scaffold would test the staircase and supply the raw material for measuring recursive feedback. Until then the fair summary is: the two extreme theories are dead, task coverage plus verification explains the pattern, and apple-picking’s distinctive additions are half-measured — shallowness and incidence yes, boundedness and the staircase no.
Cross-cutting limitations. Public examples are selected for success; vendors choose what to disclose; failed-attempt denominators are usually missing, which is why the log inventories the rates that have one [→ denominators]. Thirty-five of its entries still carry an open verification caveat, mostly vendor self-reports. The expertise question was worse off than the others until randomized evidence accumulated, partly because its most-cited empirical result came from a paper MIT has disavowed for fabricated data [→ Toner-Rodgers]. The one benchmark built specifically to predict economic value reports 47.6% wins-or-ties against experts on a 220-task subset, with its authors’ own limits attached [→ GDPval]. Benchmarks may be contaminated, revised, or saturated — SWE-bench scores partly reflect memorization, performance benchmarks are machine- and scoring-rule-dependent, and a proxy can clear while the objective does not [→ SWE-bench illusion, reliability audit, AI-discovered drugs]. Model, scaffold, budget, and evaluator often change together, and the harness results suggest the scaffold is doing more of the work than the model generation [→ ThetaEvolve, simple baselines]. “Autonomous” almost always means autonomous execution after humans chose the target and the verifier [→ autonomy ladder]. This evidence can establish existence and suggest mechanisms far more readily than it can estimate representative rates or causal effects — which is why the verdict above is a ranking of theories, not a measurement.
Formalizing the theories
- Start from the Jones research production function and ask where AI goes.
-
Let \(A\) be the stock of results in a domain and \(\dot A\) the flow of new ones — bugs found, bounds tightened, speedups shipped — so \(\dot A\) is the slope of the efficiency curve in. The workhorse is
\[\dot A = L^{\gamma}A^{1-\beta},\]
with \(L\) research labor, \(\gamma\le1\) the duplication or stepping-on-toes exponent, and \(\beta>0\) the fishing-out exponent. The growth rate is \(g_A = L^{\gamma}A^{-\beta}\), so at constant \(L\) growth dies away, and with population growing at \(g_L\) the balanced rate is \(\gamma g_L/\beta\) — long-run progress is pinned by the number of researchers.
Two arguments are missing: AI expenditure \(K\) and model capability \(C\). Each of the four theories is an answer to where they belong. The question is not new — putting AI into this function is the exercise Aghion, Jones and Jones set out, with automation of idea production as the case that changes the growth rate [→ Aghion, Jones and Jones] — and one empirical regularity constrains it: AI-augmented research is more capital-intensive than the research it replaces, so \(K\) and \(L\) are not interchangeable accounting entries [→ Besiroglu on AI R&D]. Throughout, \(\gamma\) and \(\beta\) are reserved for the two Jones exponents, the automated task share is \(s\), and the discount factor is \(\delta\).
- Three of the four theories put AI in the labor slot and leave the stock alone.
-
They share the form
\[\dot A = X(L,K;C)^{\gamma}\,A^{\,1-\beta},\]
where \(X\) is effective research input, and they differ only in \(X\). They do not change the interaction between effort and the stock of ideas, in the production of new ideas.
- Human acceleration: \(X = L\cdot G(K,C)\).
-
Spend and capability combine into a per-researcher multiplier, with \(G_K>0\) and \(G_C>0\). Buying more AI does raise output, since \(X_K = L\,G_K>0\), so this is not the claim that AI spend is useless. It is the stronger claim that spend acts only through \(L\): \(X=0\) whenever \(L=0\), at every level of capability.
The identifying restriction is testable. The ratio of the two output elasticities, \(\big(\partial\ln\dot A/\partial\ln K\big)\big/\big(\partial\ln\dot A/\partial\ln L\big)\), equals \(\varepsilon_{G,K}(K,C)\) and so is independent of \(L\). No other theory here implies that.
- Human replacement: \(X = L + m(C)K\).
-
Humans and agents are one effective input, with \(m(C)\) human-equivalents bought per unit of spend and \(m'>0\). Two static signatures: the marginal rate of substitution \(X_K/X_L=m(C)\) is constant, which is the formal content of “N agents are worth N humans,” and \(X\) is unbounded in \(K\) at \(L=0\).
Whether that threshold collapses wages depends on the tail of task complexity rather than on the average, which is the sharpest available statement of what “reachable” has to mean for the replacement claim to bite [→ Korinek and Suh]. This implies that once \(C\) rises above some threshold then all human labor will be instantly replaced with computer labor (a slightly weaker interpretation: if the supply of \(L\) and \(K\) isn’t perfectly elastic, then the replacement will be a bit slower).
- Task replacement: \(X\) is a CES aggregate of human and machine tasks.
-
Benjamin Jones’s continuum of tasks, with AI covering a share \(s(C)\) at productivity \(m(C)\) and a CES aggregator of elasticity \(\theta\), reduces to [→ Jones]
\[X = \Big[s\,y_1^{\rho} + (1-s)\,y_2^{\rho}\Big]^{1/\rho}, \qquad y_1 = \frac{L_1+m(C)K}{s}, \quad y_2 = \frac{L_2}{1-s}, \qquad \rho = \frac{\theta-1}{\theta} < 0,\]
where \(y_1\) and \(y_2\) are output per task in the automatable and non-automatable groups and labor divides between them, \(L_1+L_2=L\). Humans can work an automatable task as well, AI being merely cheaper on it, and that carries more weight than it looks: aggregating over \(mK\) and \(L\) directly would put \(X=0\) at \(K=0\), describing a world in which no research was possible before AI. With \(\rho<0\) the groups are complements. This is Jones’s own technology rather than a relative of it — his budget-constrained solution is a CES unit cost function, and the expression above is what that cost function is dual to. Read the two side by side with care, because he writes the CES exponent as \(\theta\), which is this post’s \(\rho\), and uses \(\rho\) for something else again. Implications:
- Before AI, \(X = L\): the theory nests the Jones baseline rather than replacing it.
- While any labor is still working automatable tasks the optimal split equalizes \(y_1\) and \(y_2\), and then \(X = L + m(C)K\) exactly. Over that range task replacement is human replacement; the two separate only at \(K = sX/m\), where the last human leaves the automatable tasks.
- Labor is a necessary input (while \(s<1\))
- There’s a ceiling on AI-produced progress (\(\lim_{K\to\infty}X = (1-s)^{1/\rho-1}L\)).
- Apple-picking: it splits \(A\).
-
Partition results by difficulty into those AI can reach and those it cannot, \(A = A_1 + A_2\), and let researchers divide between the two, \(L_1+L_2=L\):
\[\begin{aligned} \dot A_1 &= \big(L_1 + m(C)K\big)^{\gamma}\big(\bar A_1(C) - A_1\big)^{\eta},\\ \dot A_2 &= L_2^{\,\gamma}A_2^{\,1-\beta}. \end{aligned}\]
Two departures, logically independent, and neither forced — other formalizations of the same intuitions are set out at the end of this section. The first is the decomposition itself: \(A\) is not one stock, and AI’s productivity depends on one component rather than on the whole. The second is that in the reachable component the fishing-out term is replaced by a remaining-stock term, \(\bar A_1(C)-A_1\) rather than \(A_1^{1-\beta}\), where \(\bar A_1(C)\) is the mass of results below the reach height \(\lambda\) and rises with capability. Note that the input index \(L_1+mK\) is the human-replacement index: within the reachable zone the two are the same theory.
- The four theories are four shapes in \((K,L)\) space, and the axis intercepts carry the difference.
-
Hold the stock \(A\) and capability \(C\) fixed, fix a quantity of results \(\bar V\) to be produced, and ask which pairs of AI spend and research labor deliver it — putting spend only where it can do work, and allocating labor across tasks or components to maximize output. For the three single-stock theories \(A^{1-\beta}\) is then a constant, so the contours are just isoquants of the input index \(X\). For apple-picking they are not, because the reachable component is depleted as it is picked, and that is what makes its panel a different shape rather than a different parameterization of the same shape.
All four are normalized to the same pre-AI world, \(X=L\) at \(K=0\), so a contour can be labelled by its own height on the labor axis and every difference between the panels is something \(K\) did. They are normalized again at the margin: the multiplier is scaled so that \(G'(0)=m\), and apple-picking’s picking hazard is set so that the first unit of picking effort yields one result — which is also what lets labor sit in \(A_2\) and leaves AI to do the picking in \(A_1\). At the single point \((K,L)=(0,1)\), then, all four theories agree that the marginal dollar of AI is worth \(m\) and the marginal researcher is worth one, and everything that follows is disagreement about what happens away from that point. The figure sits outside this cell so it can use the page width.
The red path in each panel is the expansion path at \(w=r=1\): the best split of a budget \(B\) between the two inputs, traced as \(B\) rises. It requires \(m>1\) to be defined at all. At \(m=1\) a dollar of AI and a unit of labor are worth exactly the same at the margin, and three of the four theories make them perfect substitutes over some region, so half the budget line is optimal and there is no path to draw; the figure therefore uses \(m=2\), an AI dollar worth two human ones, which is Jones’s adoption condition holding strictly rather than with equality.
One column cannot hold \(m\) fixed, and the exception is worth stating rather than hiding. Under human replacement \(m(C)\) is not only the exchange rate but the single parameter through which capability enters, so raising \(C\) in that panel is raising \(m\). It is drawn crossing \(m=1\), at \(0.5\) above and \(2\) below, because that crossing is the only event the theory contains. Its lower row is therefore the one at the figure’s shared \(m\), and its upper row is a world in which AI is not yet worth buying: the lines there are flatter than their neighbours because \(m\) is smaller, not because the theory differs in kind.
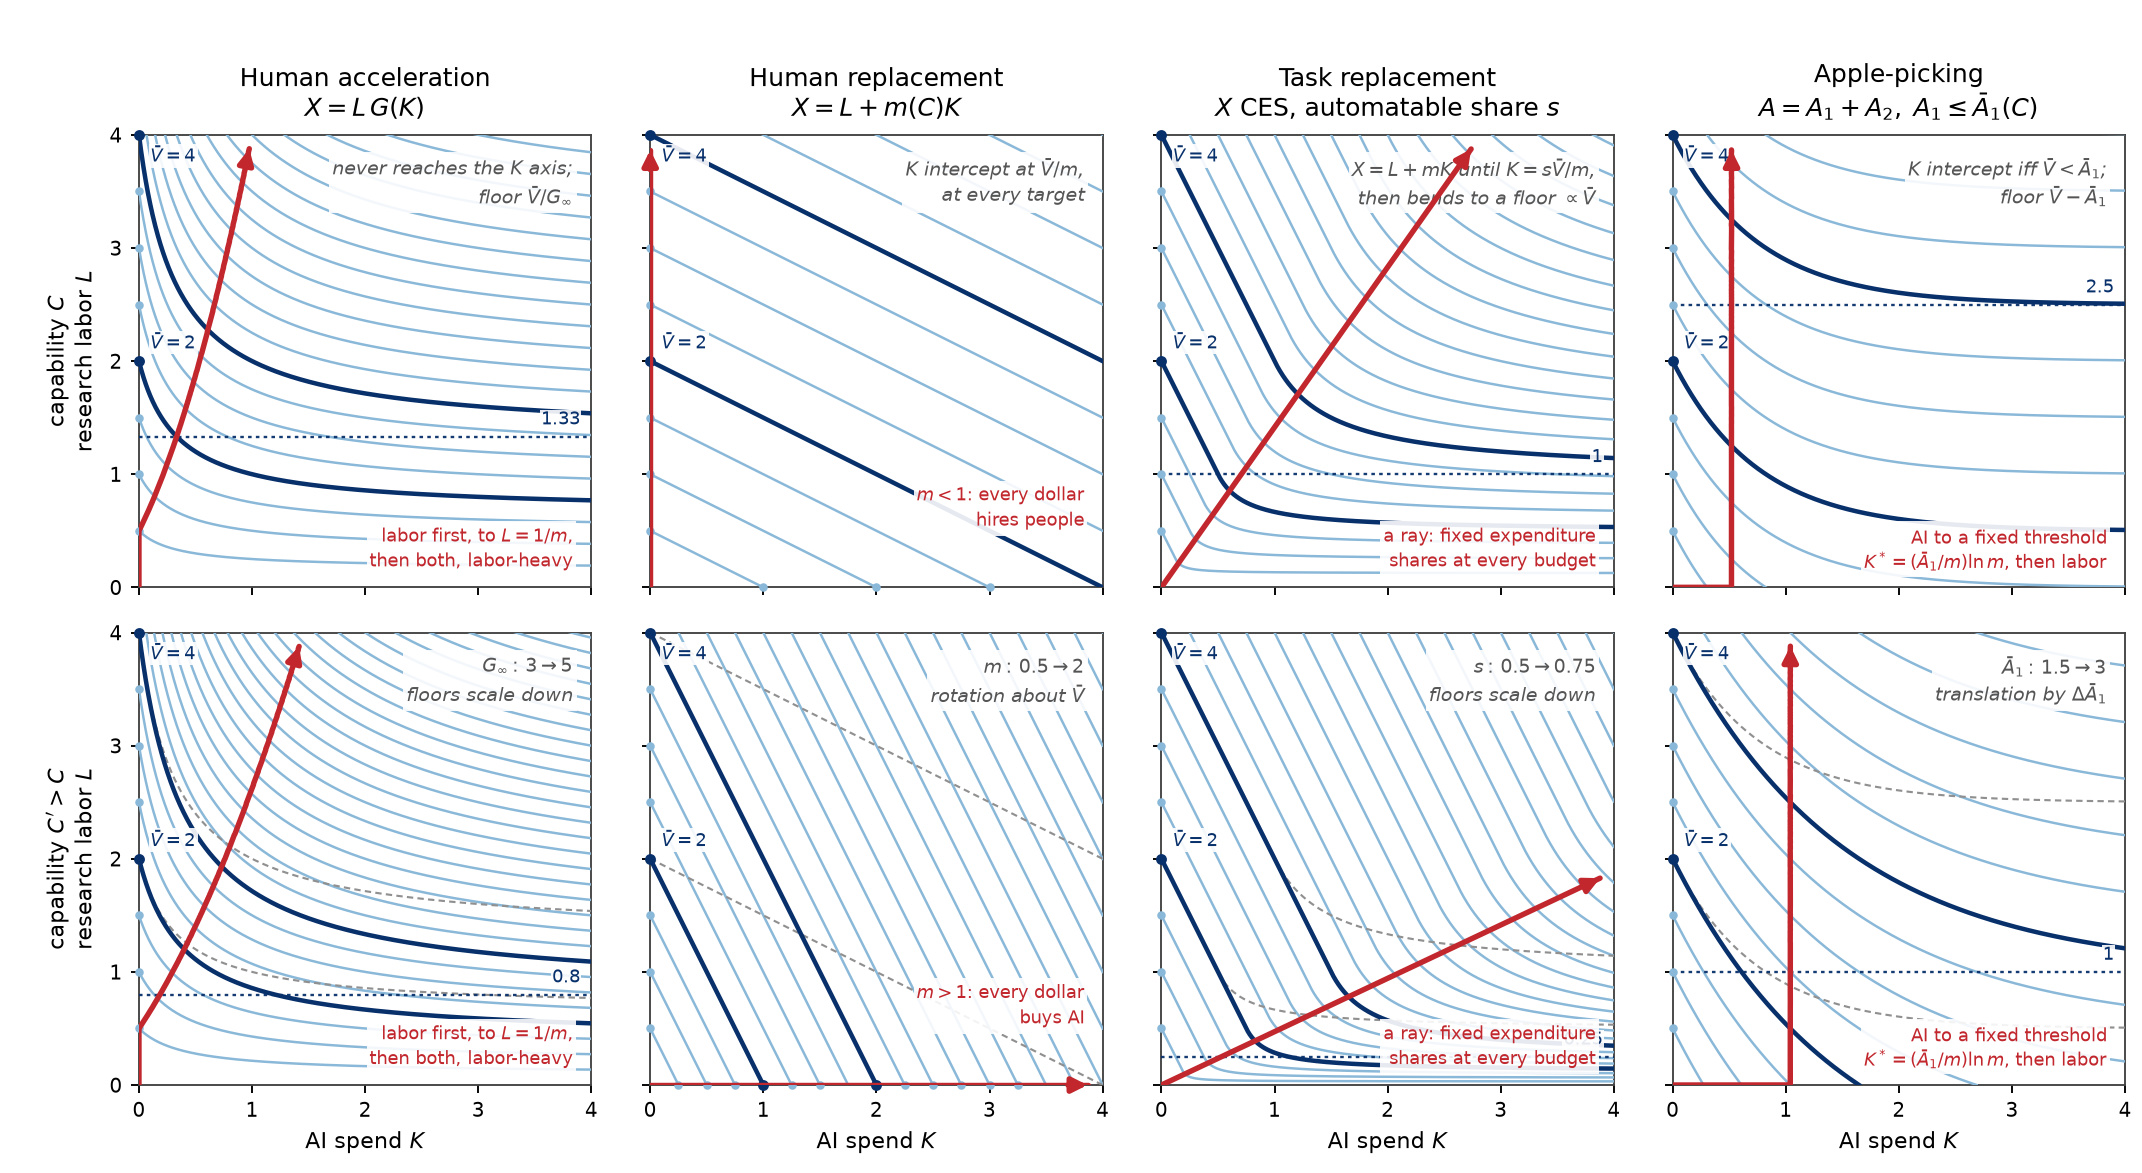
- Only two of the four ever touch the spend axis, and one of those only below its ceiling.
-
Reading the top row left to right. Human acceleration is the only one whose contours leave the labor axis at different angles: \(K\) enters as a multiplier on \(L\), so the first dollar is worth \(\bar V\) times as much on the \(\bar V\) contour as on the unit contour, and the contours are vertical rescalings of one curve rather than a family with a common slope. It never meets the spend axis, flattening instead onto \(\bar V/G_\infty\). Human replacement is a straight line all the way to the spend axis at \(\bar V/m\), and is the only theory in which money alone reaches any target whatever. Task replacement leaves the labor axis along exactly that line, drawn at the same \(m\), because AI and labor are perfect substitutes within an automatable task, and departs from it only at \(K = s\bar V/m\), where the last human leaves those tasks; from there the CES bends it onto a floor of \((1-s)^{1-1/\rho}\bar V\). Apple-picking also leaves along that line — inside the reachable zone the two are the same theory — and then bends as the reachable stock runs down. Its contours below \(\bar A_1\) reach the spend axis, and every contour above \(\bar A_1\) stops short.
The two floors then say what the ceiling test says. Task replacement’s floor is proportional to the target, so its contours fan out from the origin and doubling the target doubles the labor that unlimited spend still requires. Apple-picking’s floor is \(\bar V-\bar A_1\), so its contours are vertical translates spaced by a constant rather than by a factor, and every target below \(\bar A_1\) has no floor at all. Apple-picking hands over \(\bar A_1\) results with no labor attached to them; task replacement never hands over anything with no labor attached. That is the whole content of a ceiling that contains no \(L\), drawn.
The bottom row is a new model generation, and the four theories move in four ways. Every panel’s labor-axis intercepts are pinned, since capability does nothing without spend. Below that, acceleration’s and task replacement’s floors scale down, multiplying what a given headcount can reach; human replacement’s line rotates about its intercept, a better model being simply a cheaper human, and here the rotation is drawn carrying it past the rate at which the human stops being worth hiring; and apple-picking’s contours translate downward by \(\Delta\bar A_1\), the newly reachable band, by the same absolute amount at every target, so that targets which previously required labor now fall below the ceiling and reach the spend axis. A staircase, if there is one, is a sequence of those translations.
- Optimal spending traces four different paths, and only under apple-picking does the AI budget stop growing.
-
Give a lab a budget \(B\) to split at \(w=r=1\) and raise it. Under human acceleration the marginal dollar of AI is worth \(LG'(K)\) while the marginal researcher is worth \(G(K)\), so AI is not worth buying at all until headcount passes \(1/m\): the first dollars go entirely to labor, and only then does the path bend right, along \(L = G/G'\). It stays labor-heavy throughout — at a headcount of four the optimal AI budget is one — and AI’s share of spend falls toward zero as the budget grows, because the value of a dollar of AI is proportional to the people it is multiplying. Human replacement has no interior to find. The two inputs are perfect substitutes at a fixed rate, so the whole budget goes to whichever is cheaper per effective unit, at every budget, and the panel is drawn crossing the rate at which the answer changes: at \(m=0.5\) every dollar hires people and the path runs up the labor axis, at \(m=2\) every dollar buys AI and it runs along the spend axis. The path does not tilt as capability rises. It rotates through ninety degrees at \(m=1\), which is what the theory’s claim that labor is replaced all at once looks like when it is drawn.
Task replacement sits between them, and its path is a straight ray from the origin. The technology is constant-returns and homothetic, so the optimal split is a set of expenditure shares rather than a sequence of decisions: the optimum equates per-task outputs at the ratio \(y_1/y_2 = m^{1/(1-\rho)}\), which is a property of \(m\), \(s\) and \(\rho\) and not of \(B\). Doubling the budget doubles both inputs. Raising the automatable share tilts the ray toward spend — AI’s share goes from \(0.41\) to \(0.68\) as \(s\) goes from \(0.5\) to \(0.75\) — but never turns it into either axis, because the bottleneck tasks keep buying labor and the automatable ones keep buying AI.
Apple-picking is the only one where AI spend is bounded. Its marginal dollar is worth \(me^{-mK/\bar A_1}\), which falls to the price of labor at \(K^{*}=(\bar A_1/m)\ln m\) — a threshold that depends on the reachable stock and the exchange rate and not at all on the budget. Below it every dollar goes to AI; above it every further dollar goes to labor, and the path turns vertical and stays there. This is the result the original post drew: buy the cheap agents first, then hire people, with the agent budget saturating at a level that a larger budget cannot move. It is also the sharpest observable difference between the theories, since a lab’s split of its own budget is visible in a way that its isoquants are not. The staircase reappears here as a prediction about that split: each new model raises \(\bar A_1\) and so moves \(K^{*}\) right, so AI spend should step up on release and then plateau until the next one, rather than growing with the budget.
- Fishing out and running out are not the same assumption.
- Jones’s \(A^{1-\beta}\) says the next idea is harder than the last but there is always a next one. At constant \(L\) it gives \(A_t = (\beta L^{\gamma}t)^{1/\beta}\) — growth that slows forever without ever stopping. The apple-picking term says the reachable results are finite: \(A_1\to\bar A_1(C)\) and halts there. With \(\eta=1\) and constant input \(X\) it integrates to \(A_1(t) = \bar A_1\big(1-e^{-X^{\gamma}t}\big)\), which is the exponential in the original post; a constant hazard of finding is all the exponential ever was. Everything distinctive follows from boundedness rather than from that functional form.
- The CES question has a clean answer once the framework is set up this way.
-
Three of the four input indices are built out of a CES and differ only in \(\sigma\): human replacement has \(\sigma=\infty\); task replacement is CES across task groups with \(\sigma=\theta<1\), which in \((L,K)\) means perfect substitution until labor has left the automatable tasks and \(\theta\) only after that; and human acceleration is labor-augmenting rather than a substitution story at all. Apple-picking’s input index, \(L_1+mK\), is also CES with \(\sigma=\infty\) — so the substitution structure is the least distinctive thing about it, and writing that part in CES form does no violence whatever.
What cannot be written as a CES is the other factor. A CES is homogeneous of degree one and therefore cannot be bounded, so \(\bar A_1 - A_1\) has no CES representation; forcing the whole right-hand side into one deletes the finite stock, which is the claim the model exists to make. It is worth saying what this does not buy, correcting an earlier version of this section: the task index satisfies no Inada condition in \(K\) once humans can work the automatable tasks, so the first dollar of AI is worth \(m\) under task replacement exactly as it is under apple-picking, and the two indices leave the labor axis along the same line. So apple-picking is CES on the input side, indistinguishable from task replacement near \(K=0\), and cannot be CES on the stock side — and everything that distinguishes it lives on the side that cannot be.
- The ceiling test is sharper than the cross-partial, which duplication contaminates.
-
The natural test is the sign of \(\partial^2\dot A/\partial L\,\partial K\): positive under task replacement from CES complementarity, negative under apple-picking from depletion. Inside the Jones function that test does not survive. Differentiating the shared form,
\[\frac{\partial^2 \dot A}{\partial L\,\partial K} = A^{1-\beta}\Big[\underbrace{\gamma X^{\gamma-1}X_{LK}}_{\text{substitution}} + \underbrace{\gamma(\gamma-1)X^{\gamma-2}X_LX_K}_{\text{duplication}}\Big],\]
and the second term is negative for every theory whenever \(\gamma<1\). Since duplication is exactly what \(\gamma<1\) encodes, a measured negative cross-partial is consistent with task replacement plus crowded researchers, and the test only bites if \(\gamma\) is known.
The ceiling comparison has no such problem. Under task replacement, unlimited spend yields \(\big((1-s)^{1/\rho-1}L\big)^{\gamma}A^{1-\beta}\), which is proportional to \(L\): double the researchers and you double what infinite AI can achieve. Under apple-picking, unlimited spend yields \(A_1\to\bar A_1(C)\), which does not contain \(L\) at all: double the researchers and the ceiling does not move, the same finite stock is merely exhausted sooner. That is the same economics as the cross-partial and it is estimable without knowing \(\gamma\). It is also the difference between the third and fourth panels of the figure above: floors that fan out from the origin against floors that are parallel.
- The four signatures, side by side.
- Each theory is a distinct answer to where \(K\) and \(C\) enter, and the answer propagates all the way to the long-run growth rate. The table sits outside this cell so it can use the page width.
| Theory | Where \(K\) and \(C\) enter | AI alone, \(L=0\) | Ceiling as \(K\to\infty\) | Long-run effect of spend |
|---|---|---|---|---|
| Human acceleration | \(X = L\,G(K,C)\) | \(\dot A = 0\) at every \(C\) | \(\big(L\,G(\infty,C)\big)^{\gamma}A^{1-\beta}\) | none except through \(g_G\) |
| Human replacement | \(X = L + m(C)K\) | unbounded in \(K\) | none | explosive iff \(\gamma>\beta\) |
| Task replacement | \(X\) CES, share \(s(C)\) | \(0\) until \(s\to1\) | \(\big((1-s)^{1/\rho-1}L\big)^{\gamma}A^{1-\beta}\) | none unless \(s\to1\) |
| Apple-picking | splits \(A = A_1+A_2\) | positive, capped | \(A_1\to\bar A_1(C)\) | none except through \(\dot{\bar A}_1\) |
- Capability enters all four the same way, which is why they are easy to confuse.
- In every case \(C\) expands the domain over which AI is useful: the multiplier \(G\), the exchange rate \(m\), the automated share \(s\), or the reachable stock \(\bar A_1\). The pair the argument cares about is the pair whose capability parameters are structurally analogous — \(s\) and \(\bar A_1\) are both “the part of the job AI can touch,” and both rise with each model generation. The theories are not distinguished by what capability does. They are distinguished by whether the untouched remainder is a complementary task that AI’s output must pass through, or a separate stock that AI simply never reaches.
Dynamics
- Every theory here has a state variable; what is distinctive is that apple-picking’s is asymmetric.
-
It is tempting to say that only apple-picking carries a state. In this framework that is false: \(A\) is a state in all four, since past effort of any kind raises it and thereby changes today’s productivity through \(A^{1-\beta}\). The cross-period cross-partial has \(\text{sign}(1-\beta)\), negative for any theory with \(\beta>1\). Depletion across periods is not by itself a fingerprint.
The fingerprint is whose return is depleted. Under the single-stock theories, past effort moves \(A\), which scales the productivity of labor and spend identically; the effect is symmetric across inputs. Under apple-picking, past AI spend depletes \(A_1\) specifically, and \(A_1\) is what AI’s productivity depends on while labor also has \(A_2\) to work in. So the test is a difference: does past AI spend depress the return to AI spend by more than it depresses the return to human labor on the same targets? Only a split stock predicts yes.
- A two-period version isolates the difference as a cannibalization wedge.
-
Take two periods, set \(L=0\) and \(\eta=\gamma=1\) for clarity, and let the reachable stock rise from \(\bar A_1\) to \(\bar A_1 + \Delta\). With discount factor \(\delta\) and picking rate \(m\), discounted results are
\[V = \bar A_1\big(1-e^{-mK_1}\big) + \delta\Big[\bar A_1 e^{-mK_1} + \Delta\Big]\big(1-e^{-mK_2}\big),\]
where \(\bar A_1 e^{-mK_1}\) is what period-1 picking left behind. The exponential is doing real work here, unlike in the static results: a constant hazard makes the remaining stock a sufficient statistic, so the state is one number. With general \(\eta\) you would have to carry the whole distribution of remaining difficulty forward. Differentiating,
\[\frac{\partial V}{\partial K_1} = \bar A_1\, m\, e^{-mK_1}\Big[\,\underbrace{1 - \delta\big(1-e^{-mK_2}\big)}_{\text{cannibalization wedge}}\Big].\]
Spending early is worth less than its immediate yield, because part of what it picks would have been picked next period anyway. Differentiating again,
\[\frac{\partial^2 V}{\partial K_1 \partial K_2} = -\,\delta\,\bar A_1 m^2 e^{-m(K_1+K_2)} \;<\; 0,\]
What identifies the theory is not that this is negative, but that the corresponding derivative with respect to human effort on the same targets is not equally negative, because labor can retreat into \(A_2\).
- Deferral alone does not identify apple-picking; the wedge does.
- It is tempting to read “wait for the next model” as an apple-picking signature. It is not. Task replacement with a rising automated share defers too, because \(s_2>s_1\) raises tomorrow’s marginal product just as a larger \(\bar A_1\) does — deferral follows from any expanding domain, and both theories have one. What is unique to apple-picking is the wedge, not the direction. Observing that firms should wait tells you almost nothing; observing that last year’s spend lowered this year’s yield on the same targets tells you a lot.
- In the long run, spend cannot raise growth under apple-picking, and the reason is the split.
-
Since \(A_1\le\bar A_1(C_t)\), the reachable component contributes at most \(\dot{\bar A}_1\) once spend is high enough to clear each newly-reachable band as it arrives, and total output settles at
\[\dot A_t \;\approx\; \dot{\bar A}_1(C_t) \;+\; L_2^{\,\gamma}A_2^{\,1-\beta}.\]
The marginal product of \(K\) goes to zero: extra spend clears each band sooner but cannot produce results that are not yet reachable. This is the conclusion most sensitive to the specification — it assumes the tree stands still, and a regenerating stock removes it. Long-run progress is therefore governed by \(\dot{\bar A}_1\) — the rate at which capability rises — and by the human-only sector, never by the AI budget. Set this against human replacement, where \(K\propto A\) gives \(g_A\propto A^{\gamma-\beta}\) and spend growth can carry the whole economy: the two theories disagree about whether the quantity worth forecasting is the capability path or the compute budget.
- The staircase is a claim about \(\bar A_1(C_t)\), not a claim of the model.
-
Whether \(\dot A_t\) looks like a sawtooth or a smooth exponential depends entirely on whether the reachable stock jumps at releases or drifts continuously. Both are consistent with the same production function. This dissolves the tension the evidence sections kept running into: AISI’s and Lyptus’s smooth exponentials are evidence about the time path of capability, not evidence against apple-picking [→ AISI cyber, Lyptus], and the same goes for the seven record series that show no generation-linked band. The staircase should be dropped as a test of the model and kept only as a question about release dynamics.
There is one place the staircase is a real prediction rather than an artifact, and it is not a curve at all: the optimal-spend result below implies that a lab’s AI budget should step up on release and then plateau until the next one. That is observable in a way isoquants are not, and nothing in the log measures it.
- Recursive feedback is a law of motion for \(C\), which any of the four can be given.
- The closing loop is one line here: let capability depend on accumulated results, \(\dot C_t = g(A_t)\), and the picking process starts raising its own ceiling [→ recursive R&D]. This is why that account sits in Other theories rather than competing here: it does not say where \(K\) enters \(\dot A\), it closes the system in the other direction. Given the result above — that long-run output under apple-picking is governed by \(\dot{\bar A}_1\), which capability drives — pairing the two is where the interesting behavior would come from.
- What the formalization buys: three tests, and one it takes away.
-
Rebasing on the Jones function turns four verbal theories into three tests, none of them yet run. Whether \(\dot A\) at \(L=0\) is zero, positive-and-bounded, or positive-and-unbounded separates the human-only theories, apple-picking, and human replacement. Whether the \(K\to\infty\) ceiling scales with headcount separates task replacement, whose ceiling is proportional to \(L\), from apple-picking, whose ceiling is \(\bar A_1(C)\) and contains no \(L\). And whether past AI spend depresses the return to AI spend by more than it depresses the return to human labor on the same targets isolates the split stock; that is the repeated-run experiment on a fixed target population the evidence sections kept asking for and never found [→ XBOW, RE-Bench].
The test it takes away is the raw within-period cross-partial, which the duplication exponent contaminates for every theory at once. Both surviving comparisons are differences — a ceiling compared across headcounts, a depletion compared across inputs — which is harder to run than a single sign but is what the framework actually licenses. A fourth and much cheaper test falls out of the alternatives below, from data that may already exist.
Alternative formalizations of apple-picking
The two-stock split is one way to write the intuitions down. It is worth separating the intuitions from the implementation, because the implementation is doing more work than it looks like, and several of the choices could go the other way without touching the picture the evidence sections are testing. Three of the entries below are restatements — the same theory in different notation, sometimes with something gained. Three are rivals that reproduce much of the same evidence while dropping one of the theory’s claims, and those are the ones worth worrying about.
- A continuum of difficulty, instead of two stocks.
- Index results by difficulty \(x\) with density \(f(x)\), and let AI reach everything below a height \(\lambda(C)\), so the reachable stock is \(\bar A_1(C)=\int_0^{\lambda(C)}f(x)\,dx\). The two-stock version is this with \(f\) collapsed onto two atoms. The gain is that \(\bar A_1\) stops being a primitive and becomes a property of the difficulty distribution, which then does predictive work: a thin tail just above the current height means each capability band delivers little, a thick one means bands deliver a lot, and “burst then decay” becomes a statement about \(f\) rather than an assumption bolted on. It is also the version that connects directly to Jones’s march down a quality tail (Jones 2023), which is the closest formal cousin to the whole picture. The cost is an unknown function where there was a scalar, and nothing in this evidence identifies \(f\).
- Sampling from a finite pool, which microfounds the exponential rather than assuming it.
- The \(e^{-rx}\) in the original post reads like a functional-form choice. It need not be. If each unit of AI effort draws at random from the reachable pool and re-finds things already found, then after \(n\) draws the expected number of distinct results is \(\bar A_1\big(1-e^{-n/\bar A_1}\big)\) — the coupon-collector curve, with no assumption beyond sampling with replacement from a finite set. This is worth more than tidiness, because it fuses two claims the argument currently makes separately: diminishing returns and the duplicate rate become the same phenomenon rather than two pieces of corroborating evidence. It also creates a test that does not exist in the current version. Sampling with replacement implies a specific relationship between the observed duplicate share and the marginal yield of another run, so a bug-bounty submission log with duplicates labelled is enough to check it [→ XBOW]. That is a far cheaper experiment than the ones proposed above, and the data may already exist.
- A large fishing-out exponent, with no split at all — the alternative most likely to be right.
- Ask whether the second stock is necessary. Ordinary Jones with a large \(\beta\) in the AI-relevant sector, \(\dot A = X^{\gamma}A^{1-\beta}\), also delivers sharply diminishing returns, a front-loaded path, and an apparent wall, with no partition of \(A\) anywhere. What it cannot deliver is a genuine stop: for any finite \(\beta\), \(A_t=(\beta X^{\gamma}t)^{1/\beta}\) grows forever, just slowly. Apple-picking halts at \(\bar A_1\). Over the horizons anything in this post observes, those are close to indistinguishable — \(\beta=5\) looks like a wall across any window shorter than the whole record. This should be treated as the leading rival rather than a footnote, because most of what the evidence sections read as depletion is equally consistent with it, and it is more parsimonious. What separates them is not the decay rate but the ceiling: under any single-stock theory the reachable total is unbounded and the \(K\to\infty\) flow scales with \(L\), whereas apple-picking’s ceiling is \(\bar A_1(C)\) and contains no \(L\). So the ceiling test earns its keep twice — it separates apple-picking from task replacement, and it separates the split-stock story from a steep single-stock one.
- Cobb-Douglas inside the split, which is the fourth cell of the 2×2.
-
The entry above and the model differ along two axes at once, and only three of the four combinations have a name. Crossing “one stock or two” against “fishing out or a finite stock” gives plain Jones, the model above, and a third that nobody writes down but that is the obvious first thing to try: keep the split, and give the reachable component an ordinary Cobb-Douglas term, \(\dot A_1 = \big(L_1+m(C)K\big)^{\gamma}A_1^{\,1-\beta}\). (The fourth, a single bounded stock, says all research halts forever and can be set aside.) It is the cheapest way to get depletion, and it is worth being explicit about what the bounded term buys over it.
Two things go wrong, one cosmetic and one fatal. The sign is the cosmetic one: \(A_1^{1-\beta}\) is increasing in \(A_1\) whenever \(\beta<1\), because Jones’s ideas-getting-harder is a claim about the growth rate \(g_A = X^{\gamma}A^{-\beta}\) and not about the flow — in his model the absolute number of results per year rises with the stock, since standing on shoulders dominates. Apple-picking asserts the reverse in levels, which is what a rising duplicate rate measures. Depletion therefore requires \(\beta>1\), outside the usual calibrated range, and that region implies \(\dot A_1\to\infty\) as \(A_1\to0\), making the first result in a fresh domain infinitely cheap.
The fatal one is the ceiling. Since \(\big(L_1+mK\big)^{\gamma}A_1^{1-\beta}\to\infty\) as \(K\to\infty\), apple-picking’s entry in the \(K\to\infty\) column would become “unbounded” — human replacement’s entry. The theory collapses into a two-sector human-replacement model, and the comparison the whole section is built around, a ceiling containing no \(L\) against one proportional to \(L\), has nothing left to compare. Capability also degrades: \(C\) could only enter through \(m(C)\), so a new generation would pick faster rather than higher, while the moving band and the staircase are claims about \(\bar A_1(C)\) specifically. Letting the partition itself move with \(C\) is a legitimate repair, but working out how much mass crosses from \(A_2\) into \(A_1\) requires the mass below \(\lambda(C)\), which is \(\bar A_1(C)\) under another name.
What is not lost is most of the evidence, which is the uncomfortable part. Cobb-Douglas at \(\beta>1\) still delivers depletion, front-loading, and starting-point dependence, so the three domain sections would read much the same under either. The estimable difference is the shape of the decay on a fixed target set: Cobb-Douglas decays as a power law, \(\dot A_1\propto t^{(1-\beta)/\beta}\), and the bounded term decays exponentially, \(\dot A_1\propto e^{-X^{\gamma}t}\). Those separate cleanly over a long enough run, so this adds a quantity to measure in the repeated-run experiment rather than demanding a new one.
- A regenerating stock, which the cyber evidence probably requires.
- The tree does not stand still. New code ships and new vulnerabilities come with it; new theorems are proved and new bounds become available to tighten. Let the reachable stock be replenished at rate \(\phi\), so that picking no longer exhausts the domain but converges to a steady state in which the picking rate matches regeneration. Long-run output is then \(\phi\) rather than zero, and the marginal product of spend is positive rather than vanishing — it sets how close to \(\phi\) the field runs, not whether it gets there. This is not a technicality in cyber, where the target population grows with the software stock and the evidence of depletion is a duplicate rate rather than an observed exhaustion; it matters least in math, where nothing about AI activity obviously replenishes the stock of open problems. Neither the section above nor any source in the log measures \(\phi\), and the difference between \(\phi=0\) and \(\phi>0\) is the difference between a domain that gets used up and one that reaches an equilibrium.
- Assignment rather than depletion, which produces the same cross-section.
- Every static observation the argument leans on — machine finds concentrated in easy and neglected places, experts keeping the hard remainder — can be generated with no depleting stock whatsoever. Order problems by difficulty and let each be worked by whichever of human or AI has comparative advantage: AI takes the easy end because that is where its advantage lies, not because easy results are being consumed. That is the genius model (A. K. Agrawal, Gans, and Goldfarb 2025), and it is a relabelling of task replacement with ordered tasks rather than a stock story. The two accounts agree about the cross-section and disagree about the time series. Assignment says a fixed capability keeps yielding easy results indefinitely, as new problems arrive; depletion says the yield falls even with the problem set held fixed. This is the same repeated-run experiment on a fixed target population that the evidence sections kept asking for, arriving from a third direction, which is the best argument that it is the measurement worth buying.
- What survives every rewriting.
-
Three claims are common to every version that is still recognisably this theory — the continuum, the sampling story, and the regenerating stock — and they are what “apple-picking” should be taken to assert: that AI’s reach is bounded at any given capability, that the bound moves with capability, and that repeat effort against the same targets is non-additive. Everything else in the formalization above is an implementation choice that can be traded for something else without disturbing them: the exponential, the two-way split of the stock, the hard ceiling, the fixed allocation of labor between components.
The three rivals are exactly the accounts that drop one of the three. A large fishing-out exponent and Cobb-Douglas inside the split both drop boundedness, keeping the decay while removing the stop; assignment drops depletion, keeping the cross-section while removing the stock. That is a useful way to read the evidence sections, because it says which findings would bite. A result contradicting the exponential or the staircase contradicts a convenience. A result showing unbounded reach, a static bound, or additive repeat runs would contradict the theory.
Other theories
The four theories above are the ones the evidence is scored against. This section collects the other specific theoretical models of AI’s contribution to scientific progress — not general growth models, not models of automation and jobs, not empirical estimates or surveys, all of which the four theories already draw on where relevant. The test for inclusion is that the paper puts AI into a model of how knowledge gets made. Entries run in chronological order, each carrying its citation in the slug, and each says what the paper contributes and which of the eight questions it speaks to.
These are conceptual references rather than evidence, so they are cited by bibliography key rather than by source-log anchor, and their claims are described qualitatively — no figures are quoted from them. The three that also have source-log entries carry both.
The baseline in Formalizing the theories gives a way to place them that is more informative than a list. Every paper below either fits inside \(\dot A = X(L,K;C)^{\gamma}A^{1-\beta}\) or names a part of it the four theories hold fixed, and there turn out to be exactly four places to touch: the input index \(X\), the split of the stock \(A\), the fishing-out exponent \(\beta\), and the treatment of capability \(C\) itself. Each entry says which. Two of the four theories’ shared assumptions get challenged this way — that \(\beta\) is independent of AI, and that the allocation of labor across kinds of research is fixed — and both challenges look right.
- A. Agrawal, McHale, and Oettl (2019): AI is a better search tool over the combinatorial haystack.
- New ideas come from combining existing ones, so the space of candidates explodes far faster than the stock of ideas, and the binding constraint becomes the capacity to search it rather than the supply of raw material. They model AI as improving that search, which can offset declining research productivity. This is the one entry that does not fit the framework, and the misfit is the interesting part. All four theories put AI in the input index and hold the fishing-out exponent fixed; better search over a combinatorial space is instead a claim that AI changes how fast ideas get harder, \(\dot A = X^{\gamma}A^{1-\beta(C)}\) with \(\beta'(C)<0\). That is a third place AI could enter, and the four theories all assume it away. It is the optimistic counterpart to the theories here: the same combinatorial explosion that makes results hard to find is what makes a better search tool valuable. It also predicts something apple-picking asserts and Jones does not — that an uncollated literature holds reachable results nobody has taken, which is what the automated exponent-database search demonstrated [→ ANTEDB]. Bears on Q1, Q7.
- Gans (2025a): AI interpolates within what is already known, so its reach is the convex hull of the literature.
- A model in which AI’s competence is interpolation between existing knowledge points, reducing uncertainty inside the boundary of the known but not outside it. This is the closest thing in the literature to a microfoundation for apple-picking’s split: \(A_1\) is what lies inside the convex hull of known points and \(\bar A_1(C)\) is the interpolation range, so “low apples” are results between things already established. Two of its predictions are not apple-picking’s. First, the growth effect is non-monotonic in capability — a modest interpolation range raises growth by densifying knowledge clusters, while an extensive range pushes researchers toward exploration that thins density and can slow growth despite direct productivity gains (Gans 2025b). Second, and sharper as a critique, scientists “work to the AI”: in an intermediate regime they choose less novel questions to stay inside the tool’s operational range. Both follow from an ingredient apple-picking leaves out. Apple-picking fixes the allocation \(L_1,L_2\) and takes \(\bar A_1\) as given; Gans makes the allocation endogenous and makes \(\bar A_1\) depend on the density of what is already known, so raising capability pulls labor out of \(A_2\) — which is the sector that sustains long-run growth. Apple-picking treats the stock as exogenous, and this says the pickers reshape the tree. Bears on Q1, Q6, Q7.
- A. K. Agrawal, Gans, and Goldfarb (2025): scarce genius is allocated to the boundary, and AI genius moves humans further out.
- They separate routine knowledge workers, who apply existing knowledge, from genius workers, who create new knowledge at a cost rising with distance from what is known. Scarce genius should be spent at domain boundaries rather than at midpoints between known answers, and introducing AI genius pushes human specialists further out still, to where their comparative advantage is greatest, while routine workers face displacement as AI efficiency approaches human genius efficiency. This is the most direct model of the question the evidence summary found apple-picking half-failing, and it predicts what the discovery tier of all three domains shows: detection democratizing while weaponization does not, verification staying expert-only, harness engineering becoming the scarce skill. It does not predict the other tier — the randomized compression of the productivity distribution in ordinary work [→ pooled RCTs, Noy and Zhang] — so the two accounts split the expertise row between them rather than one winning it. In the framework it is task replacement with the tasks ordered by distance from the known, so that \(s(C)\) expands from the near end rather than covering an unlabelled share — the same ordering apple-picking uses for difficulty, but with AI substituting for labor on near tasks instead of depleting a stock of near results. Expertise relocates outward rather than falling. On Q4 it currently outperforms apple-picking. Bears on Q3, Q4.
- Gans (2026): a benchmark scores one task distribution, and no one deploys against that distribution.
- Because AI ability is jagged across tasks, deployment loss exceeds benchmark loss precisely when the tasks a user leans on most are the ones the system handles worst — an exposure effect rather than noise, with the implication that providers should report performance by task category so users can reweight to their own mix. The model is written for organizations rather than for research, and the transfer is the point: a domain is a task mix, and Q8 is asking which benchmark reweights onto it. That is why the benchmarks this post found predictive are the ones carrying a denominator from the deployment setting — expert speedup, human hours, dollars per task — and why raw multipliers over arbitrary baselines travel worst. In the framework it touches \(C\): capability is not the scalar the four theories assume but a profile over tasks, and what enters \(s\) or \(\bar A_1\) is the overlap between that profile and the domain’s own task mix. That also gives the jaggedness recurring in all three domains a name and a decision-theoretic consequence rather than leaving it an observation. The benchmark-validity evidence assembled since is a direct instance: contamination, machine-dependent multipliers, and shortcut exploitation all move a score without moving the deployment value it is standing in for [→ SWE-bench illusion, reliability audit, agents that matter]. Bears on Q2, Q8.
- Bazzichi, Riccaboni, and Castellacci (2026): automation breadth has an inverted-U effect on radicalness.
- Research combines ideas at different distances in a knowledge space [→ recombinant innovation]. Greater AI productivity can make distant, radical combinations feasible, but expanding the share of tasks assigned to AI eventually erodes human–AI complementarity and steers researchers toward the same data-rich regions, producing incremental work and duplication. The streetlight and stepping-on-toes mechanisms fit the observed concentration on known vulnerability classes, neglected problems, hyperparameter tuning, and duplicate bug reports, and the model accommodates the counterexamples better than a literal low-fruit account, since higher productivity can enable a distant combination like the unit-distance construction. In the framework this is the same expansion Gans requires, reached independently: raising \(s\) lifts \(\dot A_1\) while crowding labor and attention out of \(\dot A_2\), so breadth has opposing effects on the two components and the net is non-monotonic. Two unrelated papers converging on the need for an endogenous allocation between the components is the strongest argument that the four theories are missing it. Its distinctive comparative static is that inverted-U in automation breadth, and no dataset here varies breadth while holding model productivity, field, and incentives fixed. Bears on Q1, Q5, Q7.
- Davidson et al. (2026): automating AI research can close a loop.
- Better software and hardware accelerate the research that produces still better software and hardware, while higher output finances more machine researchers [→ recursive R&D]. This can overcome ideas-getting-harder and produce superexponential growth. It is not one of the four theories because it predicts the time path of aggregate progress rather than the shape of an individual bug, proof, or optimization — in the formal section’s terms it is a law of motion for capability, \(\dot C_t = g(A_t)\), that any of the four production functions can be paired with, and it is the fourth and last place to touch the baseline. Nothing in these snapshots establishes or rules it out; the relevant evidence would show an AI-generated improvement measurably lowering the cost of the next round of AI research. Bears on Q1, Q6.
- Google DeepMind (2026): agents make candidates cheap, so validation becomes the scarce input.
- The “conjecture machines” account is a specific theory of which task becomes limiting [→ validation bottleneck]. Agents can flood a field with hypotheses, proofs, patches, or designs; accepted knowledge grows only as fast as experiments, formal checks, expert review, and tacit implementation can validate them. Signature prediction: AI produces complete contributions first where verification is cheap, fast, and automatable, and elsewhere more agents mainly create a candidate glut that shifts labor into triage. This is the clearest cross-domain mechanism in the record — curl’s submission flood, XBOW’s duplicates, math’s proof indigestion, and the fact that every strongest optimization result came with cheap automatic scoring attached are one pattern, not four. In the framework it touches the input index and nothing else: it is task replacement with two tasks and \(\theta\to0\), so that \(X=\min\{\text{generation}(L_g,K),\ \text{validation}(L_v)\}\) and AI covers only the first. That is a refinement of task replacement rather than a fifth rival, but a substantially more predictive one than bare task coverage, because it names which task is the bottleneck instead of leaving \(s\) unlabelled. Bears on Q3, Q7.
- Excluded on scope, and what they are good for instead.
- Four bodies of work bear on the argument without being models of AI in knowledge production, and are cited elsewhere in the post rather than here. Weitzman’s recombinant growth (Weitzman 1998) and Jones’s march down a quality tail (Jones 2023) are the growth-theoretic ancestors of the search picture, but neither contains AI; the second is the closest formal cousin to apple-picking and is where anyone formalizing it further should start. Bloom, Jones, Van Reenen, and Webb (Bloom et al. 2020) establish the declining-research-productivity fact every theory here is a story about, but it is a fact and not a model. Autor and Thompson (Autor and Thompson 2025) give the general treatment of which automated tasks de-skill a job, which Q4 relies on, but the object modeled is a job rather than a field of inquiry. And the surveys — Trammell and Korinek (Trammell and Korinek 2023), Erdil and Besiroglu (Erdil and Besiroglu 2023) — map the space these models sit in without adding one.