This is one of four source documents for AI’s Contribution to Discovery. The four source documents are cyber, math, algorithms and optimization, and cross-cutting evidence, models, and method.
This document holds the evidence that is not specific to one domain — aggregate measures, conceptual models, benchmark validity, expertise and demand, the syntheses assembled across entries, the known gaps, and the chronology. It also carries the method the other three follow: what an entry must contain, the status vocabulary, the standing rules, and the eight questions.
Has AI bent any progress curve?
The output curves outside the three domains
Each of these five series is plotted under its own entry below, in the same format as every other chart in the log — years on the x-axis, the count on the y-axis, January 1, 2026 onward shaded — and drawn in slate rather than the finder colours, because none of them records who produced the artifact.
These five series count written artifacts — papers, code pushes, questions, DOI records, packages — rather than discoveries, and that is the reason to lead with them. Two bend visibly upward inside the agent era: arXiv submissions rose from 17,271 in the month ChatGPT was released to 32,040 in June 2026, after decades of much steadier growth [→ arXiv], and git pushes to GitHub roughly doubled in five quarters, from 168 million in late 2024 to 320 million in early 2026 [→ GitHub]. One collapses: questions asked on Stack Overflow fell about 98% from their pre-ChatGPT level [→ Stack Overflow]. The other two rise without a clean bend [→ Crossref, PyPI]. None of these series carries authorship labels, so no AI share can be read off them; what they establish is the wedge this project is about. The volume of output is accelerating, and demand for asking other humans is collapsing, while the discovery and record curves in the three domain documents — vulnerabilities that turn out to be exploitable, tightened exponent bounds, speedrun records, solver speedups — show no corresponding bend. Volume is where AI’s flow is unmistakable; progress is where it has to be argued for.
What the three domains have in common
The baselines differ by three orders of magnitude, so “does AI raise the rate” is three different questions. Language-model pretraining efficiency halves in about 8 months; the fastest physical cost curve, DNA sequencing, in about 8.6; classical algorithmic progress moves in jumps every three to five years; analytic number theory’s exponents halve on timescales of 82 to 1,204 years [→ efficiency rates, SAT Museum, ANTEDB rates]. A contribution invisible against the first would be transformative against the last.
Two mechanisms recur across all three domains and are better supported than any rate estimate. Cheap verification predicts where AI produces complete results — exploit tests, compiler-checked proofs, kernel latency, validation loss — and the strongest results all have it [→ validation bottleneck]. And the scaffold, not the model generation, appears to be the moving part: a test-time-training harness on an older open model beat frontier systems on GPU kernels, an 8-billion-parameter open model passed AlphaEvolve’s bounds on two of its own problems, and random sampling from an LLM matches AlphaEvolve on several [→ TTT-Discover, ThetaEvolve, simple baselines].
The single most useful thing anyone could add is a repeated measurement on a fixed target. Every domain here is missing the same experiment: the same agent, scaffold, budget and metric, run repeatedly against a fixed population of targets, with the yield curve reported. It would measure depletion directly instead of inferring it from duplicate rates, and it is the test the argument’s four competing theories actually disagree about.
What this document is for
The split between this file and the argument exists so that facts and inferences decay separately. An argument can be rewritten without re-checking its evidence, and a figure can be corrected without rewriting the argument. Three desiderata follow from that, in priority order.
A later reader must be able to re-check any figure without re-doing the search. Every entry carries links to primary sources, the date the figure refers to, and the date it was checked. If a number cannot be traced to something a reader can open, it does not belong in the argument.
Uncertainty must be visible at the point of use, not averaged away. Each entry states how far it has been verified and who produced it. A vendor self-report and an independent replication are both admissible; conflating them is not. Where two versions of a source disagree, both figures are recorded and the disagreement is left open rather than silently resolved.
The log must answer the questions the argument actually asks. The argument turns on eight questions, so each entry names which of them it bears on. An entry that bears on none of them is either miscategorized or should not be here.
The eight questions
Entries are tagged with the questions they speak to, using these short keys. The full versions, with each theory’s predicted answer, are in the argument’s “Four theories” table. The third column is this log’s own statement of what a satisfying answer would have to look like, and it is here because most entries fall short of it in a way worth naming: the gap between what a source measures and what the question asks is usually larger than the gap between competing sources.
| Key | Question | What would answer it |
|---|---|---|
| Q1 growth rate | Does AI raise the rate of efficiency growth, and by how much? | A dated efficiency series for one domain, in fixed units, spanning the arrival of AI contributions, with the pre-AI slope estimated from the same series |
| Q2 autonomy | Can AI produce a complete result without a human driving it? | A result with the human contribution itemized: who chose the target, who built the scaffold, who verified, and what was left for the model |
| Q3 demand | What happens to demand for human researchers? | Employment or wages for a research occupation, with a counterfactual — not stated hiring intentions, not job-posting language |
| Q4 expertise | How expert are the people who make discoveries with AI? | Discovery outcomes by user expertise, randomized, in a research setting rather than a task-execution setting |
| Q5 returns | How fast do returns to AI spend diminish against human labor? | Repeated equal-budget runs against a fixed target population, reporting the yield of each successive run |
| Q6 intertemporal | Is it better to spend on AI now or later? | Whether last period’s spend lowered this period’s yield on the same targets, with human effort on those targets as the control |
| Q7 incidence | Which fields and starting points does AI affect most? | One codebase or problem set staged at two levels of prior optimization, with model, scaffold, budget, and metric held fixed |
| Q8 benchmarks | Which benchmarks predict real value? | A benchmark score and a realized deployment outcome for the same system, so the correlation can be estimated rather than asserted |
How to use this log
To check a figure the argument uses, follow its #src- anchor and read the entry’s quotes and status line. If the status is unverified or vendor, the argument should not be resting weight on it, and the entry says what a reader would have to do to fix that.
To answer one of the eight questions from scratch, use the question map below rather than the reading order. Every entry declares which questions it bears on, so the map collects them; the counts are uneven in a way that is itself a finding, and the “Known gaps” section at the foot says what the thin rows are missing.
To assess a claim about AI’s contribution to R&D that came from somewhere else, three cross-cutting syntheses assembled here are the fastest route: the inventory of every rate that has a denominator, the inventory of every cost-per-result figure, and the coded ladder of what “autonomous” turned out to mean in each case where it was claimed. Those three catch most of what goes wrong with a headline.
To extend it, the standing rules below are the format, and the validator enforces the parts of it that can be checked mechanically. The rules that cannot be checked mechanically — quote the source rather than summarizing it, prefer a denominator to a headline, keep withdrawn figures rather than deleting them — are the ones that matter most.
Weighing the evidence
Entries are not interchangeable, and the log’s status vocabulary tracks only whether a figure was read correctly, not whether the study design can support the claim. Those are different questions and the second one does more damage when it is skipped. This is the log’s own ranking of designs, roughly from strongest to weakest for the purpose of estimating AI’s contribution to research.
Randomized assignment of AI access, with a real task and a measured outcome. Only a handful of entries here qualify, and they disagree in sign, which is the most useful thing about them. A randomized trial still cannot tell you about a setting it did not sample, and every one of these samples task execution rather than discovery.
Staged or phased deployment with a plausible counterfactual. Weaker than randomization but usually larger and more realistic. The identification rests on the rollout being unrelated to the outcome, which is an assumption rather than a fact.
A fixed benchmark measured at two dates with the structure held constant. This is what makes a capability series interpretable. Almost nothing here manages it, because scaffold, prompt, budget, and task set move together with model generation; where an entry does manage it, the entry says so, and those are the load-bearing capability comparisons in the log.
A benchmark score with a denominator someone outside the vendor can reproduce. Cost per task, human-hours to complete, success out of a stated problem count. The denominator is what makes a score comparable to anything else, and its absence is the single most common defect in this literature.
An operational log or leaderboard. Submission counts, duplicate rates, records with dated authorship. Not designed to answer anything, which cuts both ways: no researcher chose the outcome measure to flatter a conclusion, and no researcher controlled the confounds either.
A demonstration, on a target the demonstrator chose. Nearly every headline result in this log is one of these. A demonstration establishes that something is possible and says nothing about a rate, because the denominator — how many targets were tried, at what cost, with what failures — is normally unpublished. Vendor demonstrations additionally select on outcome before publication.
A survey of stated perceptions or intentions. Included where nothing better exists, and flagged. The one entry here that measured perception against measurement in the same population found the perception wrong in sign [→ METR RCT], which is the reason to discount this row heavily rather than merely to caveat it.
Two corollaries the log tries to hold to. A figure’s provenance and its verification status are orthogonal: a vendor claim can be verified as having been made while remaining unaudited as a measurement, and the status line keeps those apart. And an absence of evidence in a thin row is not evidence of a null — the “Known gaps” section exists so that silence does not read as a finding.
What an entry must contain
- A level-3 heading ending with the year in parentheses, and a stable
{#src-...}anchor. The year is the year the work first became public, not the year of a later journal version or of retrieval, and a range for an ongoing series. Anchors are cited from the argument and from other entries, so renaming one means updating both in the same commit. - A leading italic line giving the source type: independent, government, or vendor.
- Key figures as bulleted claims, each dated where the date matters, and each carrying the source’s own words. See the rule on quotation below — it is the most demanding requirement here and the one most often skipped.
- A
**Dates:**line. Every entry has one; see the rule on dates below. - A
**Bears on:**line naming the applicable questions. - A
Links:line reaching primary sources wherever they exist, with skeptical or contradicting coverage linked alongside rather than omitted. Aderivedentry has no external source, so it names its input entries by anchor instead. - A
**Status:**line, using the vocabulary below. It must say how far the figures have been checked, not only who produced them — provenance and verification are different claims, and an entry giving only the first cannot be classified. - A
**Unused:**line, if the argument does not yet cite the entry. See the rule on holding material below. - A figure, where one exists that carries the entry’s point better than the prose. See the rule on figures below.
Six of these are checked mechanically: the anchor’s uniqueness, the year in the heading, the Dates line and that it names a year, the Status line and its vocabulary, the presence of links or of named inputs, and that every #src- cross-reference resolves in both directions between this file and the argument. The generated tables above are also checked for staleness. Run python3 tools/qmd_validate.py --qmd posts/2026-07-23-apple-picking-cyber-math-optimization.llm.qmd. Nothing checks the quotations, the denominators, or the dates themselves, which is where the real work is.
Status vocabulary
verified— checked against the primary page or paper.verified-abstract— checked against an abstract, summary page, or leaderboard only; body figures not read in full.unverified— surfaced by search and not yet checked against a primary source.vendor— self-report. Orthogonal to the other three: a vendor claim can be verified as having been made while remaining unaudited as a measurement.derived— not a source at all, but a comparison or computation this log assembled from entries that are. A derived entry exists so the argument can cite a synthesis once instead of rebuilding it, and it must name every input entry and be reproducible from them. Nothing in a derived entry may be quoted as though a source said it.
Standing rules
Prefer a denominator to a headline. “Found N bugs” is nearly uninterpretable; “N confirmed from M submissions” or “N at $X per attempt” can be compared across sources. Where only a numerator is available, say so.
Record withdrawn and dropped figures rather than deleting them. A figure that was removed from a draft, or a paper that has been disavowed, is information a later reader needs — otherwise the next person re-finds it and re-uses it. Keep the entry and mark it.
Do not let a benchmark’s own framing set the entry’s framing. Several sources here disclaim being benchmarks, revise their own problem sets, or rank differently under different scoring rules. Those caveats belong in the entry, not in a footnote of the argument.
Quote the source, do not summarize it. A summary is the log’s reading of a source; a quote is the source. Only the second survives the summarizer being wrong, and being wrong is the normal case — a paraphrase that drops a hedge, promotes a subsample to a headline, or converts “we cannot reject” into “no effect” is indistinguishable from an accurate one once the tab is closed. So the standing requirement is that a factual claim carries the words it came from.
What must be quoted. Anything a reader might later want to check or dispute: headline results and their qualifiers, sample sizes and denominators, the authors’ own statements of scope and limitation, and any wording this log leans on. Verbatim disclaimers matter as much as verbatim findings, and often more, because the disclaimer is what gets lost first when a figure is passed along. Where a source hedges, quote the hedge rather than the hedged claim.
What cannot be quoted, and must say so. Some claims have no source sentence behind them: statistics computed here from a data file, values read off a chart, counts assembled across entries, comparisons this log is making rather than reporting. These are the log’s own assertions, not the source’s, and they should be written as such — “computed from the CSV”, “read from the figure”, “this log’s comparison” — so that the absence of a quote reads as a category difference rather than as laziness.
Where the quote goes. A quote that is self-contained and short enough to read in passing belongs in the sentence making the claim. A quote that needs surrounding context to be fair, or that runs past roughly one line, goes in a footnote, so the claim stays readable and the evidence stays adjacent.1 Quoting more than the claim strictly needs is a venial sin here; quoting less than makes the claim checkable is not.
1 This is a footnote — the container for a quote that is worth preserving in full but would otherwise swamp the bullet that depends on it.
Verbatim discipline. Reproduce the source’s wording, spelling, and emphasis. Mark every omission with an ellipsis and every insertion with square brackets. Never silently repair grammar, expand an abbreviation, or convert a percentage into a ratio inside quotation marks. Attribute the quote to a specific document, not to an organization, when the same body has said different things at different dates. If a quote comes from an abstract, a summary page, or press coverage rather than the body of the work, the status line says so — an abstract is a source’s advertisement for itself.
A figure is a claim, so say where it came from. Most figures here are reproduced from the source and are covered by the entry’s status line — but reproducing one means the figure itself was read, which is more than verified-abstract normally implies, so those status lines say which figure. The rest are generated and are the log’s own constructions rather than anyone’s. Two are built here by tools/sources_figures.py, because neither is a function of a dataset: the chronology timeline, parsed from the chronology table so it cannot drift from it, and the AIxCC comparison, plotted from numbers transcribed into its own entry. Every other generated figure is built in the ai-discovery-data repository from the CSVs vendored there — among them the efficiency-rate comparison, fitted to a cost-curve CSV, and the exponent-bound series, extracted from the exponent database by that repository’s antedb_extract.py [→ ANTEDB rates]. If a generated figure needs to change, change the data or the script and regenerate — never edit the image.
The log may hold more than the argument uses, but it must say so. A quarry contains more stone than the building. An entry the argument has not yet drawn on carries a **Unused:** line saying so and naming where it would go, and the validator counts those separately rather than failing. The line is not a parking space for weak material: an entry still has to meet every other requirement to be here at all. When the argument starts citing an entry, delete the line — the validator fails if a cited entry is still marked unused, which keeps the two files honest about what has actually been used.
Date everything, and keep three kinds of date apart. Each entry carries a **Dates:** line distinguishing when the evidence was produced (the run, the competition, the window a study covers), when it was published (and every subsequent version, because arXiv figures move), and when this log last checked it. These come apart constantly and the difference changes what a source can support: a benchmark posted in 2025 and revised in 2026 cannot be quoted from memory, a vendor claim and a reproduction two days apart bound how much reproduction was possible, and a 2024 measurement describes tooling nobody uses now. Where a date cannot be established, the line says so rather than omitting it — an unknown date is itself a finding about the source. When a date here changes, update the chronology at the foot of the document in the same edit.
Known gaps are part of the log. Questions with thin evidence are listed at the end. Silence about a gap reads as absence of an effect, which is usually wrong.
An index of every entry
Generated from the entries by tools/sources_index.py, so it cannot drift from them. “Source” is who produced the work, read from each entry’s italic type line; “Checked” is how far this log has verified it, read from the status line; “Used” says whether the companion argument cites the entry or the log is holding it. The two columns worth reading together are Source and Checked, because they answer different questions and the second is often mistaken for the first.
142 entries. By how far they have been checked: 73 verified, 43 verified-abstract, 18 unverified, 8 derived. By who produced them: 90 independent, 34 vendor, 9 derived, 5 government, 2 mixed, 1 industry, 1 disavowed. 24 carry a vendor self-report somewhere in their figures, and 4 are held unused by the argument.
| Entry | Year | Domain | Source | Checked | Bears on | Used |
|---|---|---|---|---|---|---|
| curl’s own vulnerability record, one codebase since 2000 | 2000–2026 | Cyber | vendor | verified | Q1 Q2 Q4 Q5 Q7 | cited |
| OpenSSL’s vulnerability index, the highest AI-credited share here | 2002–2026 | Cyber | vendor | verified | Q1 Q2 Q4 Q7 | cited |
| Mozilla’s Firefox advisories, a second fixed codebase with named reporters | 2016–2026 | Cyber | vendor | verified | Q1 Q2 Q4 Q7 | cited |
| OSS-Fuzz: a decade of automated discovery, declining | 2020–2026 | Cyber | independent | verified | Q1 Q5 Q7 | cited |
| NVD disclosures against CISA’s exploited-vulnerability catalog | 2016–2026 | Cyber | government | verified | Q1 Q7 Q8 | cited |
| Bloomberg: AI finding twice as many cyber flaws in 2026 as 2025 | 2026 | Cyber | independent | unverified | Q1 Q2 Q3 Q7 Q8 | cited |
| curl ends its bug bounty | 2026 | Cyber | independent | verified | Q3 Q5 | cited |
| NIST on record CVE growth and the enrichment backlog | 2026 | Cyber | government | verified | Q1 Q3 Q7 | cited |
| Gemini and developer experience: security of the resulting code | 2026 | Cyber | independent | verified-abstract | Q3 Q4 | cited |
| Cyber labour-market indicators | 2026 | Cyber | industry | unverified | Q3 Q4 | cited |
| HackerOne: platform statistics on agent-submitted reports | 2025 | Cyber | vendor | unverified, vendor | Q2 Q3 Q7 | cited |
| Google Big Sleep | 2025 | Cyber | vendor | verified, vendor | Q2 Q4 | cited |
| Anthropic Mythos preview | 2026 | Cyber | vendor | unverified, vendor | Q1 Q7 Q8 | cited |
| XBOW on HackerOne | 2025 | Cyber | vendor | unverified, vendor | Q3 Q5 Q7 | cited |
| Vidoc Security reproduction | 2026 | Cyber | independent | unverified | Q1 Q4 | cited |
| AISLE: the jagged frontier | 2026 | Cyber | independent | verified | Q7 Q8 | cited |
| Palo Alto Networks Mythos deployment | 2026 | Cyber | vendor | unverified | Q1 Q8 | cited |
| UK AISI Mythos runs, via dbreunig | 2026 | Cyber | independent | verified | Q4 Q5 Q8 | cited |
| DARPA AIxCC finals | 2025 | Cyber | government | verified | Q1 Q2 Q5 Q6 Q8 | cited |
| UK AISI: multi-step cyber attack scenarios | 2026 | Cyber | government | verified | Q1 Q2 Q5 Q6 Q7 | cited |
| Lyptus: offensive-cyber time horizons | 2026 | Cyber | independent | verified | Q6 Q8 | cited |
| DARPA Cyber Grand Challenge: the pre-LLM autonomy baseline | 2016 | Cyber | government | verified | Q1 Q2 Q4 | cited |
| Google Project Zero, “Project Naptime”: tooling versus the model | 2024 | Cyber | independent | verified | Q1 Q2 Q6 Q8 | cited |
| CyberGym | 2025 | Cyber | independent | verified-abstract | Q2 Q5 Q7 | cited |
| Fang and co-authors: autonomous exploitation of one-day vulnerabilities | 2024 | Cyber | independent | verified-abstract | Q2 Q4 Q7 | cited |
| Fang and co-authors: teams of agents on zero-day vulnerabilities | 2024 | Cyber | independent | verified-abstract | Q2 Q5 Q8 | cited |
| Cybench: CTF tasks with human solve times attached | 2024 | Cyber | independent | verified-abstract | Q1 Q2 Q4 Q8 | cited |
| Meta CYBERSECEVAL 3: a lab reporting a null on its own model | 2024 | Cyber | vendor | verified, vendor | Q2 Q7 | cited |
| ARTEMIS pentest study | 2025 | Cyber | independent | verified-abstract | Q3 Q8 | cited |
| Analytic Number Theory Exponent Database, ANTEDB | 2025 | Math | independent | verified | Q1 Q7 Q8 | cited |
| How fast analytic number theory’s exponents actually improve | 2026 | Math | derived | derived | Q1 Q6 Q7 Q8 | cited |
| Sphere-packing lower bounds: a bound series accelerating, all of it human | 1905–2025 | Math | independent | verified | Q1 Q4 Q7 | cited |
| Famous open-problem lists: when the prestige problems fall | 1900–2026 | Math | derived | verified, vendor | Q1 Q7 | held |
| OpenAI: Erdős unit-distance disproof | 2026 | Math | vendor | verified | Q1 Q2 Q3 Q7 | cited |
| FunSearch: cap sets and bin packing | 2023 | Math | vendor | verified-abstract, vendor | Q1 Q2 Q7 | cited |
| Kissing number: AlphaEvolve, a human in other dimensions, then agents | 2025–2026 | Math | independent | verified | Q1 Q3 | held |
| AlphaEvolve across 67 mathematical problems, including where it failed | 2025 | Math | mixed | unverified, vendor | Q1 Q2 Q4 Q7 Q8 | cited |
| ThetaEvolve: an 8B open model passes AlphaEvolve’s bounds | 2025 | Math | independent | unverified | Q2 Q4 Q5 Q6 | cited |
| AlphaProof Nexus: formal proof search on open problems | 2026 | Math | vendor | verified-abstract | Q1 Q2 Q4 Q5 Q7 Q8 | cited |
| Erdős-problems wiki: AI contributions | 2026 | Math | independent | verified | Q4 Q7 Q8 | cited |
| Erdős #728 | 2026 | Math | independent | verified-abstract | Q2 Q4 | cited |
| The Equational Theories Project: 22 million implications, formally settled | 2024–2025 | Math | independent | verified-abstract | Q2 Q3 Q4 Q7 | cited |
| Terence Tao commentary | 2025–2026 | Math | independent | verified | Q1 Q5 Q7 | cited |
| Ringer in Nature: mathematicians’ hands-on assessment of AlphaProof | 2025 | Math | independent | verified | Q2 Q3 Q4 Q7 Q8 | cited |
| Williams: what played to AI’s strengths in the unit-distance disproof | 2026 | Math | independent | verified | Q3 Q4 Q7 | cited |
| GPT-5 literature retrieval | 2025 | Math | mixed | verified | Q4 Q8 | cited |
| AlphaProof and IMO 2024 silver | 2024 | Math | vendor | verified-abstract, vendor | Q6 Q8 | held |
| IMO 2025 gold | 2025 | Math | vendor | verified | Q8 | cited |
| AlphaGeometry: olympiad geometry from synthetic data | 2024 | Math | vendor | verified, vendor | Q1 Q2 Q7 Q8 | cited |
| AlphaGeometry 2: past the average gold medalist | 2025 | Math | vendor | verified-abstract, vendor | Q1 Q4 Q7 Q8 | cited |
| Aristotle: formally verified IMO 2025 proofs | 2025 | Math | vendor | unverified, vendor | Q2 Q4 Q8 | cited |
| Epoch AI: FrontierMath | 2026 | Math | independent | verified | Q6 Q8 | cited |
| PutnamBench: a formal benchmark that started near the floor | 2024 | Math | independent | verified-abstract | Q1 Q2 Q7 Q8 | cited |
| HorizonMath: unsolved problems with cheap verification | 2026 | Math | independent | unverified | Q2 Q7 Q8 | cited |
| Sherry and Thompson: how fast do algorithms improve? | 2021 | Algorithms | independent | verified | Q1 Q5 Q6 Q7 | cited |
| Bixby: LP and mixed-integer programming solver speedups | 2012 | Algorithms | vendor | verified | Q1 Q5 Q6 Q7 | cited |
| Grace: algorithmic progress in six domains | 2013 | Algorithms | independent | verified | Q1 Q7 Q8 | cited |
| The SAT Museum: thirty years of solvers on one machine | 2023 | Algorithms | independent | verified | Q1 Q4 Q6 Q7 | cited |
| Hernandez and Brown: measuring the algorithmic efficiency of neural networks | 2020 | Algorithms | independent | verified | Q1 Q5 | cited |
| Erdil and Besiroglu: algorithmic progress in computer vision | 2022 | Algorithms | independent | verified | Q1 Q5 Q7 | cited |
| Epoch AI: algorithmic progress in language models | 2024 | Algorithms | independent | verified-abstract | Q1 Q8 | cited |
| Gundlach and co-authors: the 22,000× is reference-dependent | 2025 | Algorithms | independent | verified-abstract | Q1 Q8 | cited |
| Epoch AI: LLM inference price declines | 2025 | Algorithms | independent | verified | Q1 Q5 Q6 | cited |
| Gurobi: the vendor’s fixed-machine speedup series | 2009–2025 | Algorithms | vendor | unverified, vendor | Q1 Q7 Q8 | cited |
| Compression records: the Hutter Prize and the Large Text Compression Benchmark | 2006–2026 | Algorithms | independent | verified, vendor | Q1 Q2 Q8 | cited |
| Stockfish: thirteen years of dev builds against one fixed opponent | 2013–2026 | Algorithms | independent | verified, vendor | Q1 Q2 Q7 | cited |
| modded-nanogpt speedrun | 2024–2026 | Algorithms | independent | verified | Q1 Q2 Q3 | cited |
| CIFAR-10 speedrun: 94% against the clock, with AI-set records | 2018–2026 | Algorithms | independent | unverified | Q1 Q2 Q8 | cited |
| An LLM-evolved solver wins the SAT Competition | 2025 | Algorithms | independent | verified-abstract | Q1 Q2 Q4 Q7 | cited |
| Epoch: frontier software progress after 2023, estimated but not measured | 2025–2026 | Algorithms | independent | verified | Q1 Q8 | cited |
| AlphaTensor and AlphaDev: pre-LLM algorithm discovery | 2022–2023 | Algorithms | vendor | verified-abstract, vendor | Q1 Q2 Q7 | cited |
| AlphaEvolve | 2025 | Algorithms | vendor | verified-abstract, vendor | Q1 Q2 Q7 | cited |
| TTT-Discover | 2026 | Algorithms | independent | unverified | Q2 Q4 Q6 | cited |
| Karpathy autoresearch | 2026 | Algorithms | independent | verified | Q1 Q4 | cited |
| RE-Bench | 2024 | Algorithms | independent | verified | Q3 Q5 Q8 | cited |
| SWE-fficiency | 2025 | Algorithms | independent | verified-abstract | Q7 Q8 | cited |
| GSO | 2025 | Algorithms | independent | verified-abstract | Q7 Q8 | cited |
| AlgoTune | 2025 | Algorithms | independent | verified-abstract | Q1 Q7 Q8 | cited |
| PERFOPT-Bench relay pilot | 2026 | Algorithms | independent | verified-abstract | Q5 Q6 Q8 | cited |
| Performance-benchmark reliability audit | 2026 | Algorithms | independent | verified-abstract | Q8 | cited |
| SWE-bench: the benchmark that dated the floor at 1.96% | 2023 | Algorithms | independent | verified | Q1 Q2 Q8 | cited |
| MLE-bench: agents on Kaggle competitions against public leaderboards | 2024 | Algorithms | vendor | verified-abstract | Q2 Q4 Q5 Q8 | cited |
| PaperBench: replicating ICML papers from scratch | 2025 | Algorithms | vendor | verified-abstract | Q2 Q3 Q4 Q8 | cited |
| CORE-Bench: computational reproducibility as the floor task | 2024 | Algorithms | independent | verified-abstract | Q2 Q4 Q8 | cited |
| MLGym | 2025 | Algorithms | independent | verified-abstract | Q1 | cited |
| The AI Scientist: automated papers at under fifteen dollars each | 2024 | Algorithms | vendor | verified-abstract, vendor | Q2 Q4 Q5 Q8 | cited |
| The AI Scientist-v2: one autonomous manuscript through real peer review | 2025 | Algorithms | vendor | verified-abstract, vendor | Q1 Q2 Q4 Q8 | cited |
| Cui and co-authors: pooled coding-assistant RCTs | 2025 | Algorithms | independent | verified | Q1 Q3 Q4 Q7 | cited |
| METR: RCT on experienced open-source developers | 2025 | Algorithms | independent | verified-abstract | Q1 Q3 Q4 Q7 | cited |
| Peng and co-authors: the Copilot randomized trial | 2023 | Algorithms | vendor | verified | Q1 Q3 Q4 Q7 Q8 | cited |
| Hoffmann and co-authors: Copilot shifts what developers do | 2024 | Algorithms | vendor | verified | Q2 Q3 Q4 Q6 | cited |
| Song and co-authors: Copilot raises contributions and coordination cost together | 2024 | Algorithms | independent | verified-abstract | Q1 Q3 Q4 Q7 | cited |
| DORA: throughput up, delivery stability still down | 2025 | Algorithms | vendor | verified, vendor | Q1 Q3 Q8 | cited |
| GitClear: code duplication up, refactoring down | 2025 | Algorithms | vendor | verified, vendor | Q1 Q3 Q8 | cited |
| arXiv: monthly submissions | 1991–2026 | Aggregate measures | independent | verified | Q1 Q3 Q8 | cited |
| GitHub Innovation Graph: pushes, repositories, developers | 2020–2026 | Aggregate measures | vendor | verified, vendor | Q1 Q3 Q8 | cited |
| Stack Overflow: questions asked per month | 2019–2026 | Aggregate measures | independent | verified | Q3 Q7 | cited |
| Crossref: DOIs registered per year | 2010–2026 | Aggregate measures | independent | verified | Q1 Q8 | cited |
| PyPI: total projects over time | 2019–2026 | Aggregate measures | independent | verified | Q1 Q3 | cited |
| Integer factorization records: a records series that stopped | 1991–2020 | Aggregate measures | independent | verified | Q1 Q2 Q6 Q7 | cited |
| Weather forecasting: the cost collapsed and the skill trend did not bend | 1980–2026 | Aggregate measures | independent | verified | Q1 Q2 Q5 Q8 | cited |
| Our World in Data: cost curves for 66 technologies | 2016 | Aggregate measures | independent | verified | Q1 Q8 | cited |
| METR: task-completion time horizons | 2025 | Aggregate measures | independent | verified | Q1 Q6 Q8 | cited |
| Comparing efficiency rates across domains | 2026 | Aggregate measures | derived | derived | Q1 Q5 Q7 | cited |
| Epoch AI: ML hardware price-performance | 2023 | Aggregate measures | independent | verified | Q1 Q5 Q6 | cited |
| Bloom, Jones, Van Reenen, and Webb: are ideas getting harder to find? | 2020 | Aggregate measures | independent | verified | Q1 Q5 | cited |
| Hao and co-authors: AI expands individual impact and contracts collective focus | 2024 | Aggregate measures | independent | verified-abstract | Q1 Q4 Q7 | held |
| Acemoglu: the simple macroeconomics of AI | 2024 | Aggregate measures | independent | verified | Q1 Q5 Q7 Q8 | cited |
| Aghion and Bunel: a higher estimate, with the ideas channel explicitly omitted | 2024 | Aggregate measures | independent | verified | Q1 Q5 Q6 Q8 | cited |
| Toner-Rodgers, “AI, Scientific Discovery, and Product Innovation” — WITHDRAWN, do not cite | 2024 | Aggregate measures | disavowed | verified | Q4 | cited |
| Benjamin Jones: AI in R&D | 2025 | Conceptual models | independent | verified | Q2 Q3 Q5 Q7 | cited |
| Bazzichi, Riccaboni, and Castellacci: recombinant innovation | 2026 | Conceptual models | independent | verified | Q3 Q5 Q7 | cited |
| DeepMind: conjecture machines and the validation bottleneck | 2026 | Conceptual models | vendor | verified, vendor | Q3 Q7 | cited |
| Davidson, Halperin, Houlden, and Korinek: recursive R&D feedback | 2026 | Conceptual models | independent | verified | Q1 Q6 | cited |
| Aghion, Jones, and Jones: AI in the idea production function | 2017 | Conceptual models | independent | verified | Q1 Q2 Q5 Q6 | cited |
| Korinek and Suh: whether wages collapse depends on the tail of task complexity | 2024 | Conceptual models | independent | verified-abstract | Q2 Q3 Q5 Q6 | cited |
| Ide and Talamas: autonomous AI helps the most knowledgeable, assistive AI helps the least | 2023 | Conceptual models | independent | verified-abstract | Q2 Q3 Q4 | cited |
| Besiroglu, Emery-Xu, and Thompson: AI-augmented R&D is more capital-intensive | 2022 | Conceptual models | independent | verified-abstract | Q1 Q5 Q6 | cited |
| Kapoor and co-authors: AI agents that matter | 2024 | Measurement and benchmark validity | independent | verified-abstract | Q1 Q5 Q8 | cited |
| The SWE-bench illusion: memorization rather than reasoning | 2025 | Measurement and benchmark validity | independent | verified | Q1 Q7 Q8 | cited |
| Sakana on kernel benchmarks: a vendor conceding exploitable loopholes | 2025 | Measurement and benchmark validity | vendor | verified-abstract | Q1 Q2 Q8 | cited |
| GDPval: a benchmark built to predict economic value, with its authors’ limits | 2025 | Measurement and benchmark validity | vendor | verified | Q1 Q2 Q8 | cited |
| AI-discovered drugs: the proxy clears, the objective does not | 2024 | Measurement and benchmark validity | vendor | verified-abstract | Q1 Q2 Q5 Q8 | cited |
| Stack Overflow developer survey: adoption high, trust low | 2025 | Measurement and benchmark validity | independent | unverified | Q1 Q3 Q8 | cited |
| Simple baselines match code evolution, so the machinery may not be what works | 2026 | Measurement and benchmark validity | independent | unverified | Q1 Q4 Q8 | cited |
| Dell’Acqua and co-authors: the jagged technological frontier | 2023 | Expertise and demand | independent | verified-abstract | Q4 Q5 Q7 | cited |
| Brynjolfsson, Li, and Raymond: generative AI at work | 2023 | Expertise and demand | independent | unverified | Q3 Q4 | cited |
| Otis and co-authors: the uneven impact on Kenyan entrepreneurs | 2024 | Expertise and demand | independent | verified | Q4 Q7 | cited |
| Does generative AI narrow education-based productivity gaps? | 2026 | Expertise and demand | independent | verified-abstract | Q4 | cited |
| Doshi and Hauser: AI raises individual creativity and lowers collective diversity | 2024 | Expertise and demand | independent | unverified | Q5 Q7 | cited |
| Noy and Zhang: ChatGPT compresses the writing productivity distribution | 2023 | Expertise and demand | independent | verified-abstract | Q1 Q4 Q8 | cited |
| Hui, Reshef, and Zhou: freelance demand fell, and top freelancers fell hardest | 2023 | Expertise and demand | independent | verified | Q3 Q4 Q7 | cited |
| Demirci, Hannane, and Zhu: postings for automation-prone freelance work fell 21% | 2024 | Expertise and demand | independent | verified-abstract | Q3 Q5 Q7 | cited |
| Brynjolfsson, Chandar, and Chen: entry-level employment in AI-exposed occupations | 2025 | Expertise and demand | independent | verified, vendor | Q3 Q4 Q7 | cited |
| Aghion and co-authors: French firms that adopted AI grew | 2025 | Expertise and demand | independent | verified-abstract | Q3 Q5 Q7 | cited |
| Zhao and co-authors: AlphaFold barely changed who collaborates | 2025 | Expertise and demand | independent | verified | Q3 Q4 Q7 | cited |
| Inventory of the 67 AlphaEvolve problems, as the frame for a historical baseline | 2026 | Syntheses assembled here | derived | derived | Q1 Q7 Q8 | cited |
| AI record steps against human steps on the same quantities | 2026 | Syntheses assembled here | derived | derived | Q1 Q4 Q5 Q7 | cited |
| Every rate in the log that has a denominator | 2026 | Syntheses assembled here | derived | derived | Q1 Q2 Q5 Q7 Q8 | cited |
| Every cost-per-result figure in the log | 2026 | Syntheses assembled here | derived | derived | Q1 Q5 Q6 Q8 | cited |
| What “autonomous” turned out to mean, case by case | 2026 | Syntheses assembled here | derived | derived | Q2 Q4 Q8 | cited |
| The randomized and quasi-experimental evidence, in one place | 2026 | Syntheses assembled here | derived | derived | Q1 Q3 Q4 Q7 | cited |
Which entries bear on which question
Also generated. The row lengths are the point: Q1 and Q7 have more evidence than anyone can synthesize, and the rows that matter most for distinguishing the theories are among the shortest. Where a row is short, read the corresponding paragraph in “Known gaps” before concluding anything from it.
The verification backlog
Also generated: every entry whose own status line concedes that something remains unchecked — a stated “unverified”, or a vendor flag. This is the work queue for verification passes; an entry leaves the table by having its primary read and its status line updated, never by editing the table.
36 entries carry an open verification caveat: 18 say something is unverified, 24 are vendor-flagged (overlapping). The excerpt is the entry’s own status line.
| Entry | Year | What the status line concedes |
|---|---|---|
| Bloomberg: AI finding twice as many cyber flaws in 2026 as 2025 (2026) | 2026 | verified as to wording — the full article text was read twice, once through a browser session and once from a copy supplied by the repository owner, and the two agree; retrieved 2026-07-27. Unverified as measurement:… |
| Cyber labour-market indicators (2026) | 2026 | unverified — figures are quoted from the publishers’ own summary pages, retrieved 2026-07-26; neither underlying dataset has been inspected and neither is peer-reviewed. |
| HackerOne: platform statistics on agent-submitted reports (2025) | 2025 | verified as to wording, unverified as measurement; vendor. The four quotes were checked verbatim against the press release, retrieved 2026-07-26, so the claims are verified as having been made. The underlying report w… |
| Google Big Sleep (2025) | 2025 | quotes verified by direct fetch; figures are vendor self-reports. |
| Anthropic Mythos preview (2026) | 2026 | unverified (quotes not yet checked against the primary post); vendor. The “thousands” figure is unaudited. |
| XBOW on HackerOne (2025) | 2025 | unverified; vendor. The submission and duplicate counts are XBOW’s own and have not been checked against the HackerOne leaderboard here; the skeptical companion piece disputes the framing rather than the counts. An ea… |
| Vidoc Security reproduction (2026) | 2026 | unverified quote. |
| Palo Alto Networks Mythos deployment (2026) | 2026 | unverified; numerator, denominator, and token spend not reproducible from primary inputs. |
| Meta CYBERSECEVAL 3: a lab reporting a null on its own model (2024) | 2024 | verified — the four stage quotes and the risk verdict checked against the arXiv HTML of v2, retrieved 2026-07-26; vendor self-assessment of the vendor’s own model. |
| Famous open-problem lists: when the prestige problems fall (1900–2026) | 1900–2026 | verified as to source transcription — prestige and TOPP rows are transcribed into the vendored CSV from the named secondary accounts / TOPP status lines; Thurston years follow Wikipedia’s table (range ends where Wikip… |
| FunSearch: cap sets and bin packing (2023) | 2023 | verified-abstract — checked against the Nature abstract, the DeepMind announcement, and contemporaneous reporting, retrieved 2026-07-26; vendor result, peer-reviewed. |
| AlphaEvolve across 67 mathematical problems, including where it failed (2025) | 2025 | verified as to the abstract and Tao’s account, unverified as to the body; vendor system with academic co-authors. The abstract was read verbatim from the arXiv listing and the author list and 2025-11-03 date confirmed… |
| ThetaEvolve: an 8B open model passes AlphaEvolve’s bounds (2025) | 2025 | verified as to the abstract, unverified as to the results. The abstract, author list, and 2025-11-28 date were read from the arXiv listing, retrieved 2026-07-26. The circle-packing figures and the identification of th… |
| AlphaProof and IMO 2024 silver (2024) | 2024 | verified-abstract — checked against the Nature abstract and article metadata, retrieved 2026-07-26; vendor result, peer-reviewed. |
| AlphaGeometry: olympiad geometry from synthetic data (2024) | 2024 | verified against the DeepMind announcement, retrieved 2026-07-26, which restates the Nature paper’s figures; the Nature full text is behind an authentication redirect and was not read. Vendor result, peer-reviewed — s… |
| AlphaGeometry 2: past the average gold medalist (2025) | 2025 | verified-abstract — the three quotes checked against the arXiv abstract, retrieved 2026-07-26; the body figures were not read. Vendor result, not peer-reviewed at the version read. |
| Aristotle: formally verified IMO 2025 proofs (2025) | 2025 | verified-abstract for the performance and architecture claims, checked against the arXiv abstract, retrieved 2026-07-26; vendor and unverified for the five-of-six count and for any benchmark figures, which were not co… |
| HorizonMath: unsolved problems with cheap verification (2026) | 2026 | verified as to the abstract, unverified as to the body — the abstract, author list, and date were read from the arXiv listing, retrieved 2026-07-26. The absence of any historical baseline was checked against the abstr… |
| Gurobi: the vendor’s fixed-machine speedup series (2009–2025) | 2009–2025 | unverified as measurement; vendor — quotes read from the announcements (some via archive captures and wire-service mirrors) and from dated captures of the performance page, retrieved 2026-07-28. The per-version charts… |
| Compression records: the Hutter Prize and the Large Text Compression Benchmark (2006–2026) | 2006–2026 | verified — record tables, dates, byte counts and quotes read from both pages, retrieved 2026-07-28, and cross-checked against the prize site’s own payout arithmetic. Figure generated here from the vendored CSV rather… |
| Stockfish: thirteen years of dev builds against one fixed opponent (2013–2026) | 2013–2026 | verified — the dev-build data parsed from the nextchessmove page, the regression tables read from the official wiki, and the commit message read on GitHub, retrieved 2026-07-28. The per-year rates are computed here fr… |
| CIFAR-10 speedrun: 94% against the clock, with AI-set records (2018–2026) | 2018–2026 | verified for the dated records against the releases, timestamps and announcements linked, retrieved 2026-07-28; the 2.73 s record’s date could not be pinned beyond its 2024 bracket; the 1.828 s figure is a single lab’… |
| AlphaTensor and AlphaDev: pre-LLM algorithm discovery (2022–2023) | 2022–2023 | verified-abstract — publication dates and headline claims checked against the Nature article pages, retrieved 2026-07-26; vendor results, peer-reviewed. |
| AlphaEvolve (2025) | 2025 | paper figures verified-abstract; production figures vendor. |
| TTT-Discover (2026) | 2026 | kernel numbers verified against the project table and paper; cost accounting unverified. |
| The AI Scientist: automated papers at under fifteen dollars each (2024) | 2024 | verified-abstract — all quotes checked against the arXiv abstract of v3, retrieved 2026-07-26; vendor, and the quality evaluation is the vendor’s own automated reviewer rather than human review. |
| The AI Scientist-v2: one autonomous manuscript through real peer review (2025) | 2025 | verified-abstract — quotes checked against the arXiv abstract, retrieved 2026-07-26; vendor. The workshop, the reviews, and the scores were not independently examined. |
| DORA: throughput up, delivery stability still down (2025) | 2025 | verified — quotes and the date checked against the announcement page, retrieved 2026-07-26; the full report PDF was not opened. Survey-based, self-selected, and published by a vendor. |
| GitClear: code duplication up, refactoring down (2025) | 2025 | vendor, verified as to figures — the composition table, the duplicate-block table, and the quotes were read from the extracted text of the PDF, retrieved 2026-07-26. The vendor sells tooling premised on this being a p… |
| GitHub Innovation Graph: pushes, repositories, developers (2020–2026) | 2020–2026 | verified as to the data files; vendor — the CSVs are GitHub’s own publication about its own platform, the datasheet definition is quoted verbatim, and the global sum is this log’s arithmetic, retrieved 2026-07-28. |
| DeepMind: conjecture machines and the validation bottleneck (2026) | 2026 | verified against the primary essay; vendor. |
| Stack Overflow developer survey: adoption high, trust low (2025) | 2025 | unverified as measurement, verified as to figures — the percentages and the response count were read from the survey page, retrieved 2026-07-26. A self-selected online survey of stated perceptions, with no counterfact… |
| Simple baselines match code evolution, so the machinery may not be what works (2026) | 2026 | unverified — the three-domain claim, the nine-problem replication counts, the search-space conclusion, and the 2026-02-18 date are taken from the arXiv listing and search-surfaced summaries, retrieved 2026-07-26. Neit… |
| Brynjolfsson, Li, and Raymond: generative AI at work (2023) | 2023 | verified — NBER working paper 31161 (April 2023, revised November 2023) read directly, retrieved 2026-07-26; the 14%, 34%, and 5,179 figures are quoted from its abstract. Figure 5 reproduced from the source. This supe… |
| Doshi and Hauser: AI raises individual creativity and lowers collective diversity (2024) | 2024 | unverified — the primary page is behind a bot check and could not be fetched, so the figures and the date come from secondary summaries, retrieved 2026-07-26. Do not cite until the primary is read. |
| Brynjolfsson, Chandar, and Chen: entry-level employment in AI-exposed occupations (2025) | 2025 | verified — all quotes read from the working-paper PDF, retrieved 2026-07-26. Not peer-reviewed; exposure is measured from a vendor-supplied classification; and no exact worker count is published. |
Aggregate measures
These entries supply the cross-domain denominators and controls used by the three domain ledgers: output volume, scored fields, pre-AI efficiency rates, general capability proxies, and macro productivity estimates.
Output-volume and activity series
arXiv: monthly submissions (1991–2026)
Independent (the repository’s own statistics page). The longest-running count of scientific papers produced. It measures submissions, not quality, novelty, or acceptance anywhere.
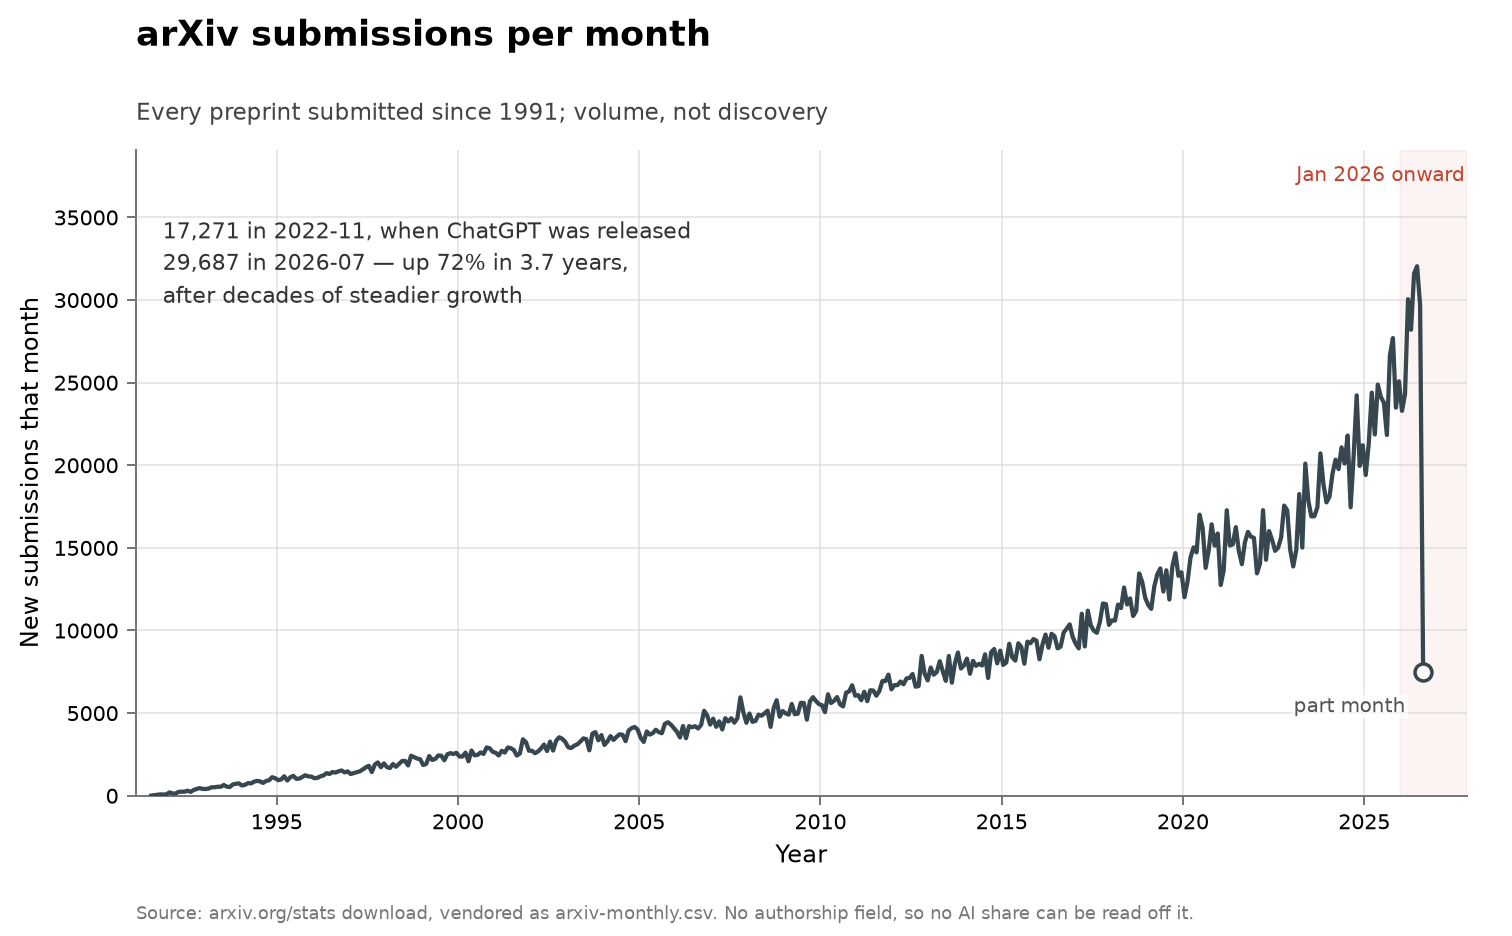
- What is counted, in arXiv’s words. “This chart displays the number of new submissions received during each month since August 1991.” The page’s total “excludes 2,431 articles that were migrated to arXiv rather than being submitted directly, and 156 articles that have been deleted.”
- The values the chart annotates. 17,271 submissions in November 2022, the month ChatGPT was released; 32,040 in June 2026, the last complete month — an 85% rise in three years and seven months, computed here. The series’ earlier doubling took roughly a decade.
- What the rise cannot be attributed to. Nothing in the data separates AI-written, AI-assisted, and human submissions, and arXiv moderation, field growth, and submission-policy changes all move the count. The bend is a fact about volume; its attribution is open. This caveat is the log’s.
- A wrinkle in the vendored file. The raw download carries a
historical_deltacolumn, nonzero only for 1991–1997 corrections, preserved in the scratch copy and dropped from the vendored two-column file; the series in fact starts 1991-07 with a value of 2, one month before the page’s own “since August 1991.” - Dates: monthly, 1991-07 through 2026-07 (July partial, retrieved 2026-07-28). Vendored at
problems/output-arxiv/arxiv-monthly.csvin the data repository, which also draws the chart above. - Bears on: Q1 growth rate, Q3 demand, Q8 benchmarks.
- Links: arXiv monthly submissions
- Status: verified — the full CSV downloaded from arXiv’s own stats endpoint and the description quoted from the page, retrieved 2026-07-28.
GitHub Innovation Graph: pushes, repositories, developers (2020–2026)
Vendor (GitHub’s published quarterly dataset; the platform counting activity on itself). The code-volume counterpart to arXiv, and the one output series here that bends unambiguously upward inside the agent era.
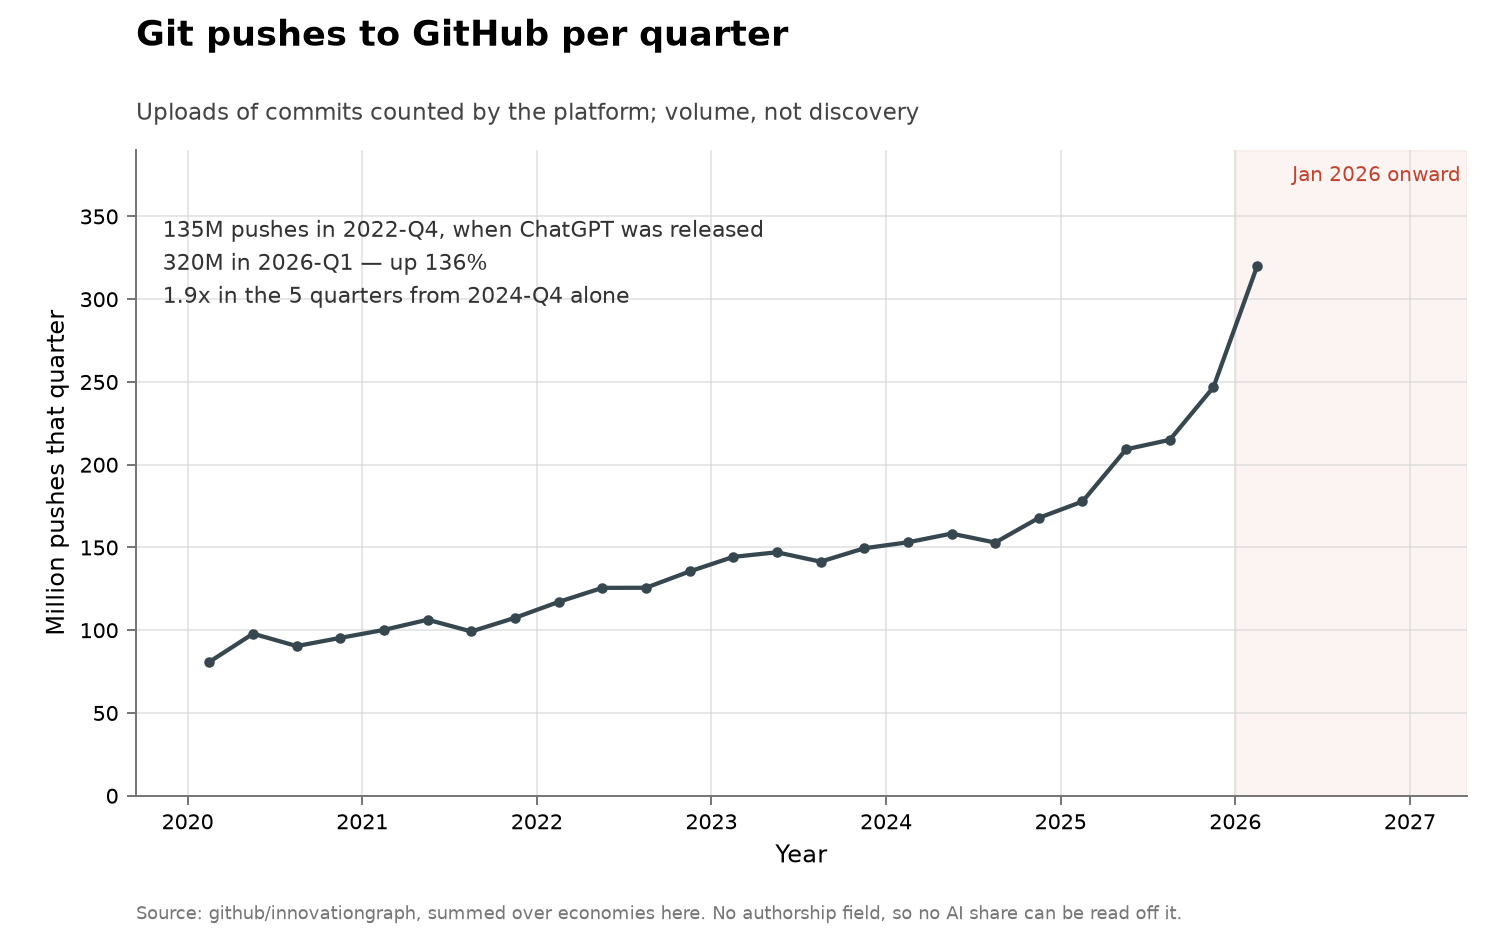
- What a push is, in the datasheet’s words. “Git pushes: the number of times developers in a given economy uploaded code to GitHub during each quarter… Changes to files made through GitHub’s online platform automatically result in a push. Note that a single git push may contain multiple commits.”
- The series, as summed here. GitHub publishes per-economy files, not a global total, so the vendored series sums 200 economies per quarter, excluding the EU aggregate row to avoid double counting; economies under the dataset’s 100-developer reporting threshold are absent, so the sum slightly undercounts. Quarterly pushes: 80.8 million in 2020-Q1, 135.4 million in 2022-Q4, 167.8 million in 2024-Q4, 319.8 million in 2026-Q1 — the last five quarters roughly double the series. Repositories and developers are stocks at quarter end; pushes are the flow.
- What the bend cannot be read as. A push is an upload event, not a unit of working code, and nothing distinguishes agent-driven pushes, CI automation, or humans typing faster. The quality-composition evidence in this log runs the other way [→ GitClear]. This caveat is the log’s.
- Dates: quarterly, 2020-Q1 through 2026-Q1; dataset retrieved and summed 2026-07-28. Vendored at
problems/output-github-pushes/github-innovationgraph-global.csvin the data repository. - Bears on: Q1 growth rate, Q3 demand, Q8 benchmarks.
- Links: github/innovationgraph · datasheet
- Status: verified as to the data files; vendor — the CSVs are GitHub’s own publication about its own platform, the datasheet definition is quoted verbatim, and the global sum is this log’s arithmetic, retrieved 2026-07-28.
Stack Overflow: questions asked per month (2019–2026)
Independent (the platform’s public API, counted here). The one series here that measures demand for other humans’ time, and it collapses on ChatGPT’s release date.
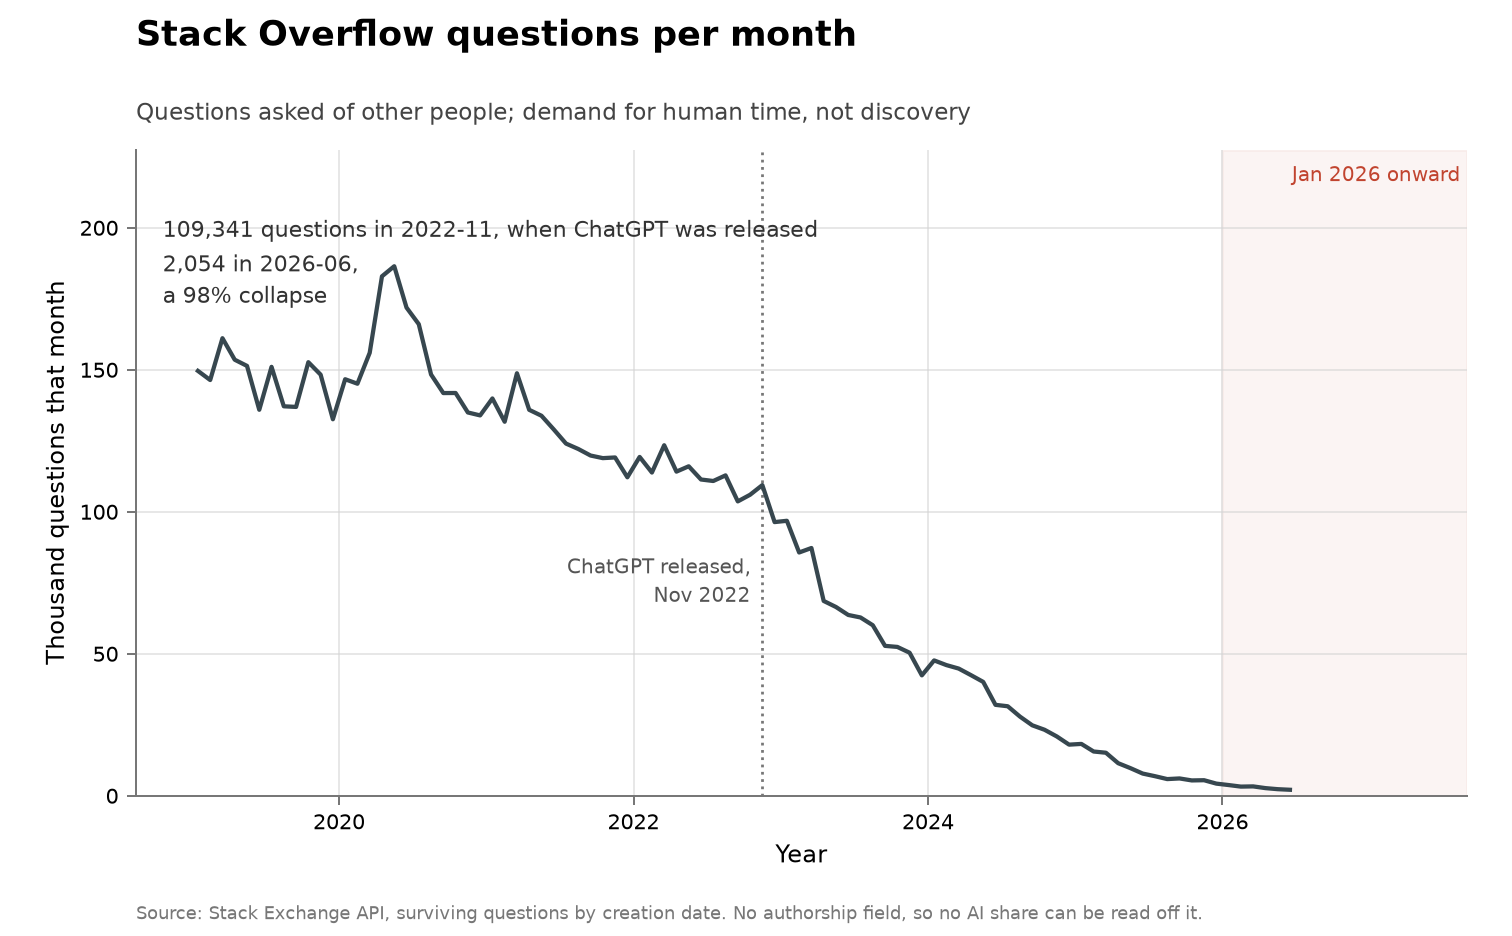
- The series, counted here from the API. Questions on Stack Overflow by creation month, one API count per month: 149,549 in January 2019; 109,341 in November 2022, the month ChatGPT was released; 63,610 in June 2023; 2,054 in June 2026. A roughly 98% fall from the pre-ChatGPT level, computed here.
- The survivorship caveat, which matters for the level but not the shape. The API counts currently existing questions by creation date, so deleted questions vanish retroactively and historical months understate what was actually asked at the time. The collapse is far too large for that to explain.
- Why it sits with the aggregate measures. Asking a public question is substitutable by asking a model, so this is the cleanest demand-side series in the log: where the two coding RCTs measure what AI does to output [→ Copilot RCT, METR RCT], this measures what it does to a market for human answers. The platform’s own survey entry records the same population reporting high adoption and low trust [→ Stack Overflow survey].
- Dates: monthly, 2019-01 through 2026-06 (last full month); counted via the Stack Exchange API 2026-07-28. Vendored at
problems/output-stackoverflow/stackoverflow-questions-monthly.csvin the data repository. - Bears on: Q3 demand, Q7 incidence.
- Links: Stack Exchange API
- Status: verified — every monthly count returned by the public API on 2026-07-28; the survivorship caveat is structural and cannot be corrected from public data.
Crossref: DOIs registered per year (2010–2026)
Independent (the registration agency’s public API, counted here). The widest available count of formal scholarly output, included as the control the arXiv series needs: publishing volume was rising long before the agent era.
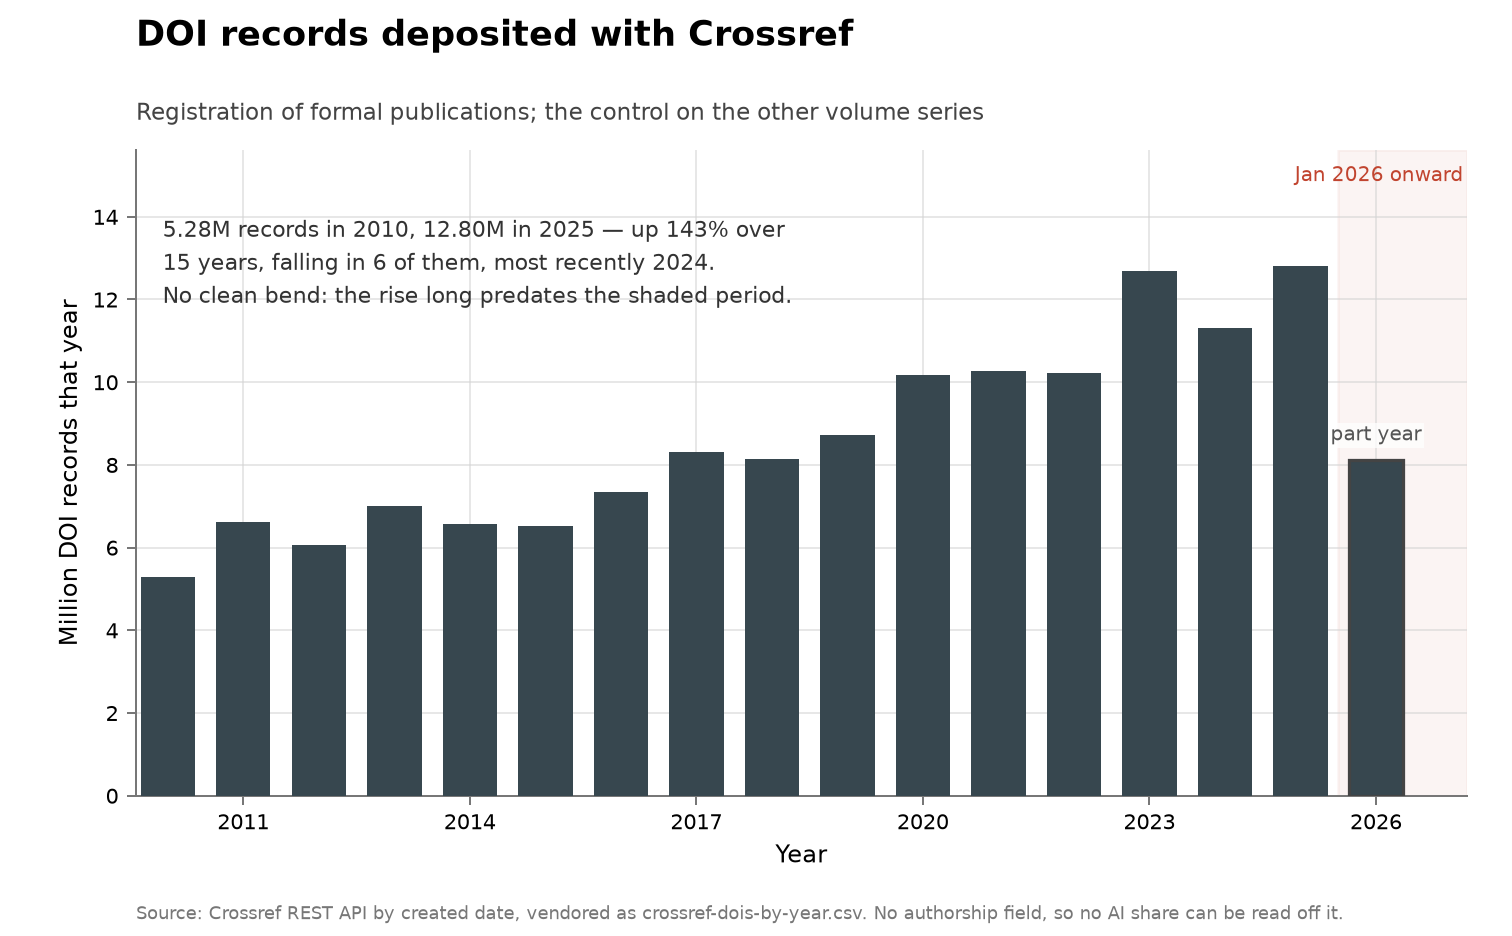
- What the count is, in the API documentation’s words. The filter used counts records by “metadata first deposited since (inclusive) {date}” — deposit date, not publication date. A year’s count therefore includes backfile deposits of older works and excludes works published that year but registered later.
- The values. 5.28 million DOI records deposited in 2010; 10.19 million in 2020; 12.70 million in 2023; 11.31 million in 2024; 12.81 million in 2025; 7.65 million in 2026 through July 28. The 2024 dip and similar wobbles track deposit activity rather than publication volume, which is why this entry treats the series as rising with no clean bend.
- Dates: annual, 2010 through 2026 year-to-date; counted via the Crossref REST API with one request per year, 2026-07-28. Vendored at
problems/output-crossref/crossref-dois-by-year.csvin the data repository. - Bears on: Q1 growth rate, Q8 benchmarks.
- Links: Crossref REST API documentation
- Status: verified — counts returned by the public API on 2026-07-28 and the filter semantics quoted from the official documentation. Deposit-date semantics make it a noisy proxy for publication volume, and the entry says so.
PyPI: total projects over time (2019–2026)
Independent, assembled here (Wayback Machine captures of the registry’s own front-page counter). The package-volume series: cumulative projects on the Python Package Index, quarterly.
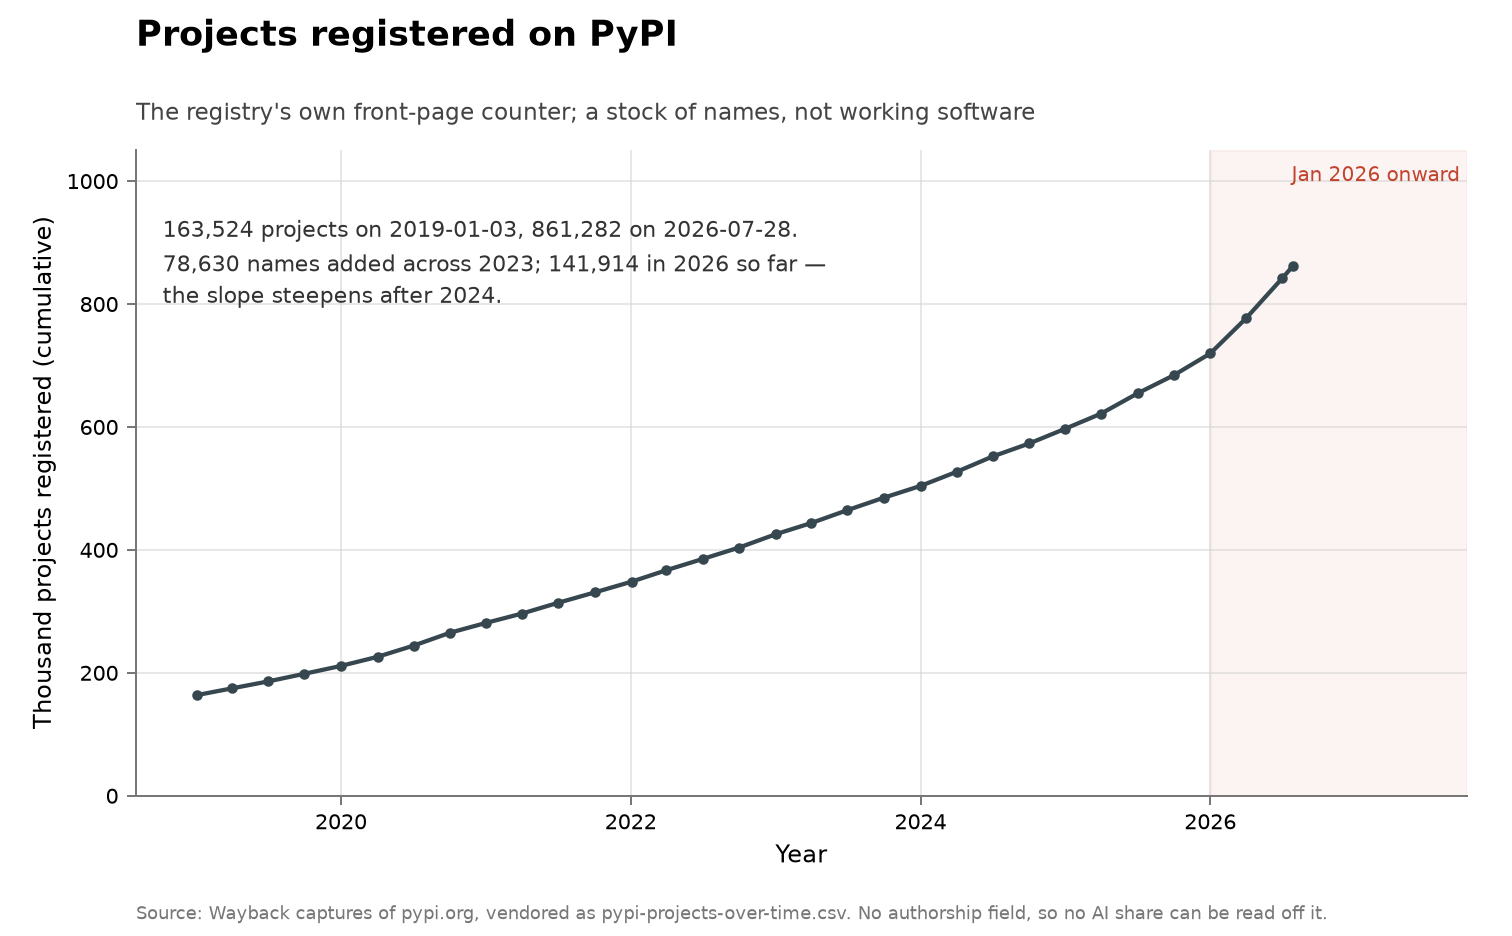
- How it was assembled, because no primary history exists. PyPI’s stats endpoint reports current totals only, so the series is 31 quarterly Wayback captures of the front page’s project counter, 2019–2026, each row carrying its capture URL, plus a live reading of 861,282 projects on 2026-07-28. Assembled series, labelled as such in the vendored file.
- The values. 163,524 projects in January 2019; 503,845 in January 2024; 719,368 in January 2026; 861,282 live on 2026-07-28. The stock’s growth rate roughly doubles after 2024: about 61,000 projects were added in 2023 and about 142,000 in the twelve months to July 2026, first differences computed here.
- What a project is not. A registered name, not working or used software; registry spam and name-squatting waves exist and are not corrected for. The composition caveat on the GitHub entry applies with more force here. This caveat is the log’s.
- Dates: quarterly captures 2019-01 through 2026-07, plus the live 2026-07-28 reading. Vendored at
problems/output-pypi/pypi-projects-over-time.csvin the data repository. - Bears on: Q1 growth rate, Q3 demand.
- Links: PyPI · example capture
- Status: verified as to each capture — every row names its Wayback URL and the last row is a live reading, retrieved 2026-07-28; assembled here rather than published by anyone, and the counter’s own definition of a project is not documented by PyPI.
Scored fields outside the three domains
Integer factorization records: a records series that stopped (1991–2020)
Independent (the RSA Factoring Challenge’s own record list and the record-setters’ announcements). A densely dated, three-decade records series in a domain with a cash-prize history and instant verification — and the cleanest null in the log, because the series has not moved at all since February 2020. It is tracked here to span verification cost: checking a factorization is instant and free, so this is the cheap-verifier extreme, and nothing happened anyway.
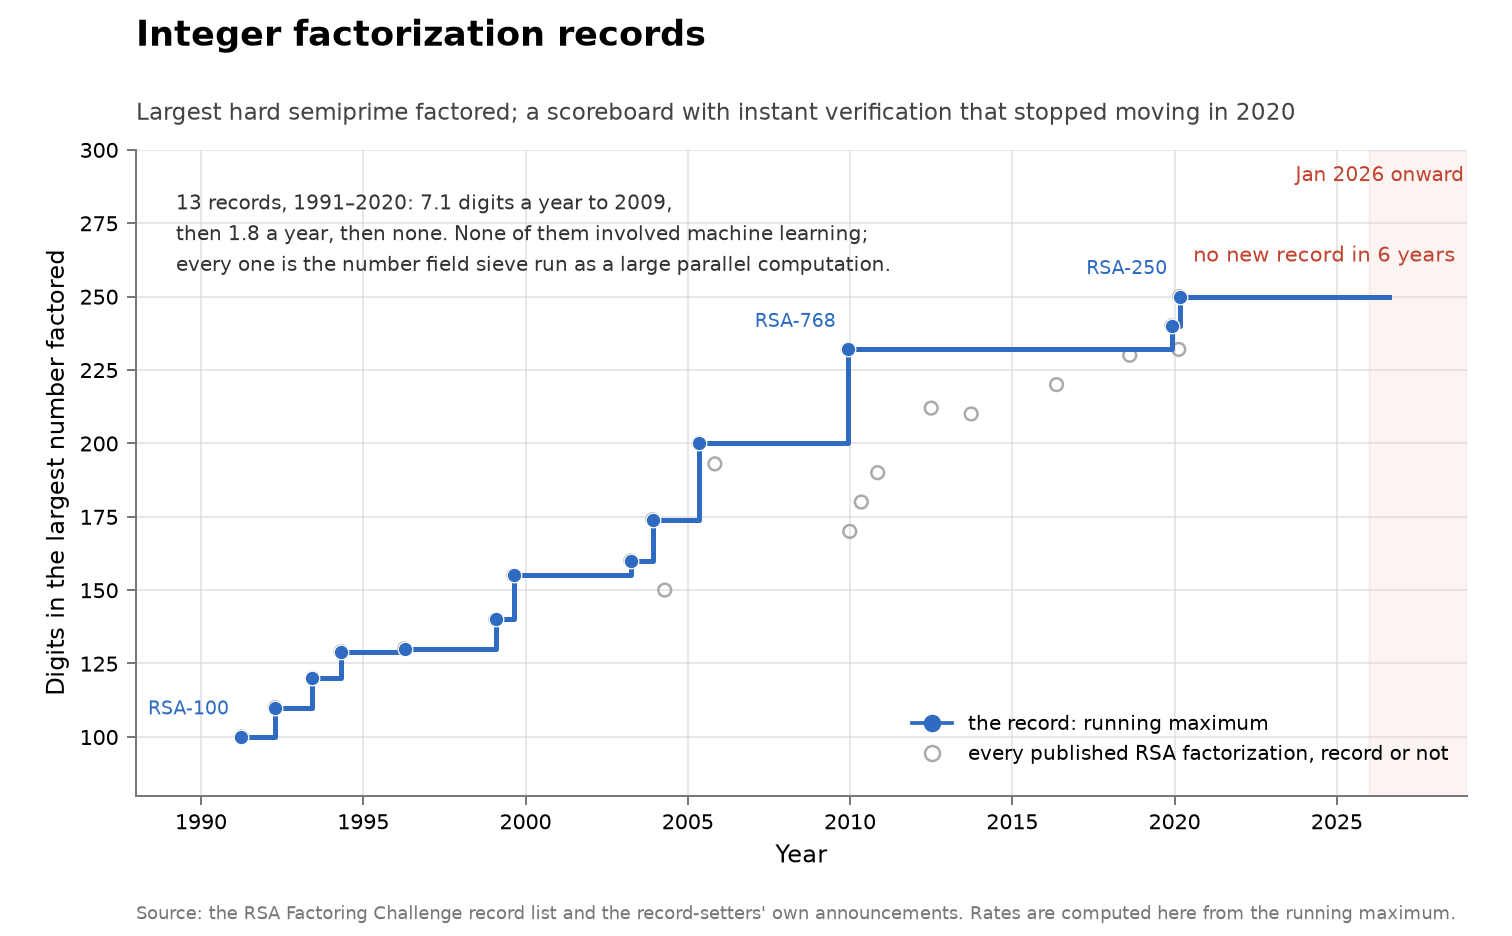
- The record series, running maximum. Largest hard two-prime number factored, in decimal digits: RSA-100 (1991-04), 110 (1992), 120 (1993), 129 (1994), 130 (1996), 140 and 155 (1999), 160 and RSA-576 at 174 digits (2003), RSA-200 (2005-05), RSA-768 at 232 digits (2009-12), RSA-240 (2019-12), RSA-250 at 829 bits (2020-02-28). Thirteen records in twenty-nine years.
- The rate, computed here, and its collapse. About 5.19 digits a year across the full span; 7.06 a year over 1991–2009; 1.76 a year over 2009–2020. Grace’s 2013 survey recorded factoring as improving “about 5.5 digits per year for the last two decades” [→ Grace], which the series confirms for the window she had — and the deceleration after 2009 is a fourfold slowdown that predates AI entirely.
- The series then stopped, and has stayed stopped through the agent era. RSA-250 remains the record as of 2026-07, six years and four months later. RSA-260, RSA-270, RSA-896 and RSA-1024 are unfactored. So a domain with a public record list, instant verification, a named prize history, and heavy prior effort has produced no new record across exactly the period in which AI systems set records on speedruns, kernels, a SAT competition, and a dozen mathematical bounds.
- No record in the series involved machine learning, and one announcement separates algorithm from hardware. Every record is the number field sieve (quadratic sieve for the earliest) run as a large parallel computation by a human team. The RSA-240 announcement is the one that decomposes the gain: “our computation was 3 times faster than the expected time that would have been extrapolated from previous records,” and “the acceleration can be attributed to various algorithmic improvements that were implemented for these computations. The CADO-NFS implementation was also vastly improved.” So the last real step in this series was human algorithmic and implementation work worth about 3× against a hardware-adjusted baseline.
- The cost scale, which is why this is not a cheap target. RSA-250 took “roughly 2700 core-years”; RSA-768 was reported as “the equivalent of almost 2000 years of computing on a single-core 2.2 GHz AMD Opteron.” A record here costs real money, which distinguishes the stall from disinterest in a cheap prize — though the challenge itself was formally discontinued in 2007, so the 2019–2020 records were one-off academic efforts and the absence of a prize is part of the explanation.
- Two adjacent cryptanalysis records, for context rather than as a series. The 795-bit discrete-logarithm record was set by the same team on the same day as RSA-240 (2019-12-02), and the first SHA-1 collision was published on 2017-02-23 by a Google and CWI team using a differential path plus about 2^63.1 hash evaluations. Neither involved AI either.
- What this can and cannot support. It establishes that a cheaply-verified, publicly-scored, decades-long records series can sit entirely still through the agent era, which is a useful counterweight to any account in which cheap verification is sufficient for AI contribution. It does not establish that AI could not factor a larger number: no one has published a serious attempt, the arithmetic is not obviously the kind of task current systems are pointed at, and the missing prize plus the core-years cost are sufficient explanations on their own. The reading is the log’s; the absence of an attempt is the gap.
- Dates: records span 1991-04-01 to 2020-02-28; challenge discontinued 2007; series confirmed unmoved as of 2026-07-29. Vendored at
problems/integer-factorization/factoring-records.csvin the data repository (all 23 factored RSA numbers, with the running-max subset identifiable by date). - Bears on: Q1 growth rate, Q2 autonomy, Q6 intertemporal, Q7 incidence.
- Links: RSA numbers · RSA Factoring Challenge · RSA-250 announcement · RSA-240 and DLP-240 announcement · SHA-1
- Status: verified — the record list, digit and bit counts, dates and finders read from the RSA-numbers record list, and the algorithmic-speedup and core-year quotes read from the record-setters’ own announcements, retrieved 2026-07-29. The rates are this log’s arithmetic over the running-max series. Wikipedia is the aggregator for the record list; the two announcements are primary.
Weather forecasting: the cost collapsed and the skill trend did not bend (1980–2026)
Independent (ECMWF’s own verification framework and the operational-model literature; the ML-model claims are their developers’, including ECMWF’s own). The domain most likely, a priori, to show AI bending a scientific progress curve: a fixed metric, a four-decade dated baseline, blind verification against reality within days, and four ML models that beat the physics incumbent between 2022 and 2025. What it actually shows is a cost collapse without a corresponding change in the skill trend, which makes it the log’s clearest example of a third category — neither more volume nor faster discovery, but the same capability far cheaper.

The chart plots the two text-stated skill anchors as filled points and the source’s stated rate of about one day per decade as a dashed line — that line is the claim, not a digitized series, for the reason given below — with the ML models’ arrival dates marked along the bottom. Two other fields are tracked here to span verification cost, each with its own chart: the factoring records below [→ factoring records], where checking a result is instant, and the sphere-packing ladder in the math document, whose steps are counted rather than valued because the bound’s functional form changes along it [→ sphere packing]. All three are generated from the vendored CSVs.
- The metric, in ECMWF’s own words. The headline series is the “forecast lead-time at which the anomaly correlation of the HRES 500 hPa geopotential reaches 80% for the extra-tropical northern hemisphere.” A fixed atmospheric variable, a fixed correlation threshold, verified against what the weather actually did.
- The pre-AI rate, as the literature states it. “The skill of deterministic ‘best-guess’ weather forecasts in the range from 3 to 10 days ahead has improved by about a day a decade: today’s 6 day forecast being as skillful as a 5 day forecast 10 years ago.” Sustained for roughly forty years. Two dated anchors sit behind it: northern-hemisphere useful forecast length was 5.5 days in 1980 and 6.5 days in 1985, and day-5 500 hPa correlation rose from about 0.60 to about 0.75 across the 1980s, with the southern hemisphere improving faster from a lower base as satellite assimilation matured.
- A limitation of this entry, stated because it bounds what the figure can show. ECMWF’s live skill chart blocks automated fetching, so what is vendored is a handful of text-stated anchor points and the stated rate, not a digitized year-by-year series. Any line drawn between the anchors is the rate as the source states it, not measured data, and the figure says so. Digitizing the published figure or pulling the chart interactively would fix this and is the obvious next step.
- Four ML models beat the incumbent on the same class of metric, between 2022 and 2025. FourCastNet “matches the forecasting accuracy of the ECMWF Integrated Forecasting System (IFS) … at short lead times … while outperforming IFS for small-scale variables” (2022-02). Pangu-Weather: “for the first time, an AI-based method outperforms state-of-the-art numerical weather prediction (NWP) methods in terms of accuracy … of all factors … and in all time ranges” (arXiv 2022-11, Nature 2023-07). GraphCast is “significantly more accurate than the ECMWF’s deterministic forecasting system, HRES, on 89.3% of the 2760 target variables and lead times we evaluated” (Science, 2023-11-14). GenCast “was more accurate than ENS on 97.2% of these targets, and on 99.8% at lead times greater than 36 hours” (Nature, 2024-12-04) — though that is CRPS, a probabilistic ensemble score, so it is not on the same axis as the deterministic series above.
- The incumbent then shipped its own ML model, which is the load-bearing fact. ECMWF’s AIFS became operational on 2025-02-25, and ECMWF reports that it “outperforms state-of-the-art physics-based models for many measures … with gains of up to 20%,” with the ensemble version’s scorecard showing “forecast improvements reach up to 25%” and overall skill improving 4–6% in v1.1. When the organization that owns the physics model and the verification framework adopts a machine-learning model operationally, the capability claim stops being a vendor claim.
- The gains on skill are percentages; the gain on cost is three orders of magnitude. ECMWF reports for AIFS “a reduction of approximately 1,000 times in energy use,” and the ML models run in minutes on modest hardware against hours on a supercomputer. Set the two side by side: single-digit-to-25% improvements on the skill metric against a ~1000× reduction in the cost of producing a forecast. Nothing in the sources examined claims the long-run one-day-per-decade trend has measurably steepened since ML models arrived. So the honest summary is that AI reached comparable-to-modestly-better skill vastly more cheaply, which is a bend in a cost curve and not in a discovery curve. This framing is the log’s; the underlying figures are the sources’.
- The ML models are downstream of the physics system, which limits what “AI did it” can mean. GraphCast, Pangu, GenCast and AIFS are trained on ERA5 reanalysis, which is itself the output of ECMWF’s physics-based 4D-Var data assimilation. The learned models are therefore bounded by, and derived from, the numerical system they outperform — they are not an independent route to the same knowledge. This is the sharpest available instance of a pattern the log sees elsewhere: the machine result presupposes an expensive human-built artifact [→ ANTEDB].
- Physics still wins where it matters most. A 2026 paper’s title states the finding: “Physics-based models outperform AI weather forecasts of record-breaking extremes.” Read alongside the proxy-versus-objective pattern the log tracks elsewhere [→ AI-discovered drugs], this is the same shape: the aggregate score improves while the cases that carry the value do not.
- Why it is worth tracking for this project. Weather is the cheap-verification extreme — a forecast is checked against reality in days, at no cost, blind, by an institution with no stake in the model winning. If cheap verification were sufficient for AI to accelerate discovery, this is where it would show, and what shows instead is an efficiency gain on an existing capability. That is evidence about the mechanism rather than about weather.
- Dates: skill anchors 1980 and 1985, rate claim published 2015; FourCastNet 2022-02-22, Pangu-Weather 2022-11-03 (Nature 2023-07), GraphCast 2023-11-14, AIFS arXiv 2024-06-03 and operational 2025-02-25, GenCast 2024-12-04, AIFS ENS operational 2025; extremes paper 2026. Retrieved 2026-07-29. Vendored at
problems/weather-forecasting/weather-forecast-skill.csvin the data repository andweather-ml-models.csv. - Bears on: Q1 growth rate, Q2 autonomy, Q5 returns, Q8 benchmarks.
- Links: Bauer, Thorpe and Brunet, Nature 2015 · ECMWF forecast quality · AIFS operational · AIFS ENS · GraphCast · GenCast · Pangu-Weather · FourCastNet · extremes
- Status: verified as to every quoted claim against the page or abstract named, retrieved 2026-07-29; the skill anchors are secondary, quoted from a 2003 review citing ECMWF and Kalnay rather than from ECMWF’s own archive, and the pre-AI series is anchor points rather than a digitized curve. The extremes paper was read as abstract only. Each ML-model claim is its developers’ own, including ECMWF’s for AIFS; none was independently reproduced here.
Efficiency baselines and capability proxies
Our World in Data: cost curves for 66 technologies (2016)
Independent (data aggregator, from an academic dataset). Our World in Data’s “The cost of 66 different technologies over time” plots unit cost against year on a log axis for 66 technologies, drawn from the Santa Fe Performance Curve Database as compiled by Farmer and Lafond (2016), “How predictable is technological progress?” This is the closest available picture of efficiency progress — cost per unit of output — measured consistently across many domains at once. Figures below are computed from the chart’s CSV download, not read off the image.
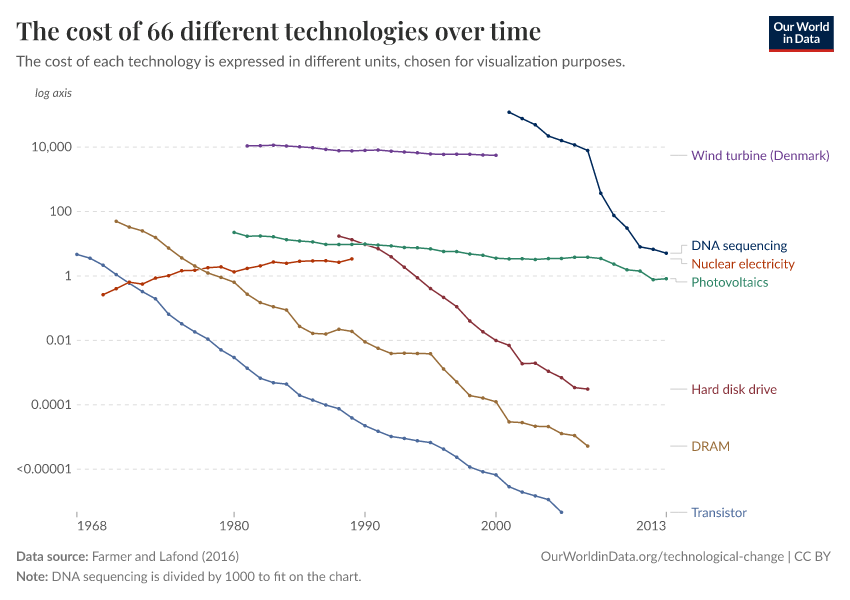
Near-straight lines on a log axis, at slopes differing by about an order of magnitude between domains. The series are unit cost against year, and all of them end before AI played any part in them.
Note on quotation. Almost every figure in this entry is computed here from the chart’s CSV download rather than read from a sentence, so there is little to quote and the numbers are this log’s arithmetic. They are reproducible from the file; the two quotations below are the chart’s own framing.
- Steady exponential improvement is the normal case, and 64 of the 66 series end cheaper than they began. Computed from the CSV. Only two end more expensive: nuclear electricity (1970–1989, $0.26 to $3.37, about +14.4% a year) and crude oil (1946–1968).
- The rates differ by an order of magnitude across domains. Annualized cost change over each series’ own span, computed here: DNA sequencing −56.8% (2001–2013), hard disk drive −43.8% (1988–2007), transistor −39.2% (1968–2005), DRAM −36.0% (1971–2007), photovoltaics −9.6% (1980–2013), Danish wind turbines −3.5% (1981–2000).
- On a log axis most series are close to straight lines. That is the empirical content of Wright’s and Moore’s laws: within a domain the improvement rate is roughly constant for decades, so a domain’s rate — its slope — is the natural thing for a new technology to change. Read from the chart, and the framing is this log’s.
- Units are not comparable across series, and the chart says so. Its subtitle: “The cost of each technology is expressed in different units, chosen for visualization purposes.” Its note: “DNA sequencing is divided by 1000 to fit on the chart.” Only within-series rates of change are meaningful, never levels between series.
- The data stops in 2013. The series run 1929–2013, so this dataset cannot speak to AI’s effect at all. It establishes the shape of the outcome variable and the pre-AI baseline, nothing more.
- Provenance. Our World in Data describes the underlying data as “adapted from Farmer and Lafond,” from the Santa Fe Performance Curve Database, published as “How predictable is technological progress?”
- Dates: underlying series 1929–2013; Farmer and Lafond published 2016; CSV retrieved 2026-07-26.
- Bears on: Q1 growth rate, Q8 benchmarks — it defines the shape of the outcome variable.
- Links: chart · Technological Change topic page · Farmer and Lafond (2016)
- Status: verified against the chart’s CSV download (1,256 rows, 66 entities, 1929–2013), retrieved 2026-07-26. Chart snapshot stored locally at
posts/images/owid-tech-cost-curves.png.
METR: task-completion time horizons (2025)
Independent (METR). The parent methodology for every “time horizon” number in this log, including the offensive-cyber series. Frontier agents are scored on tasks whose difficulty is measured by how long human experts take, and the reported metric is the human task length at which an agent succeeds half the time.
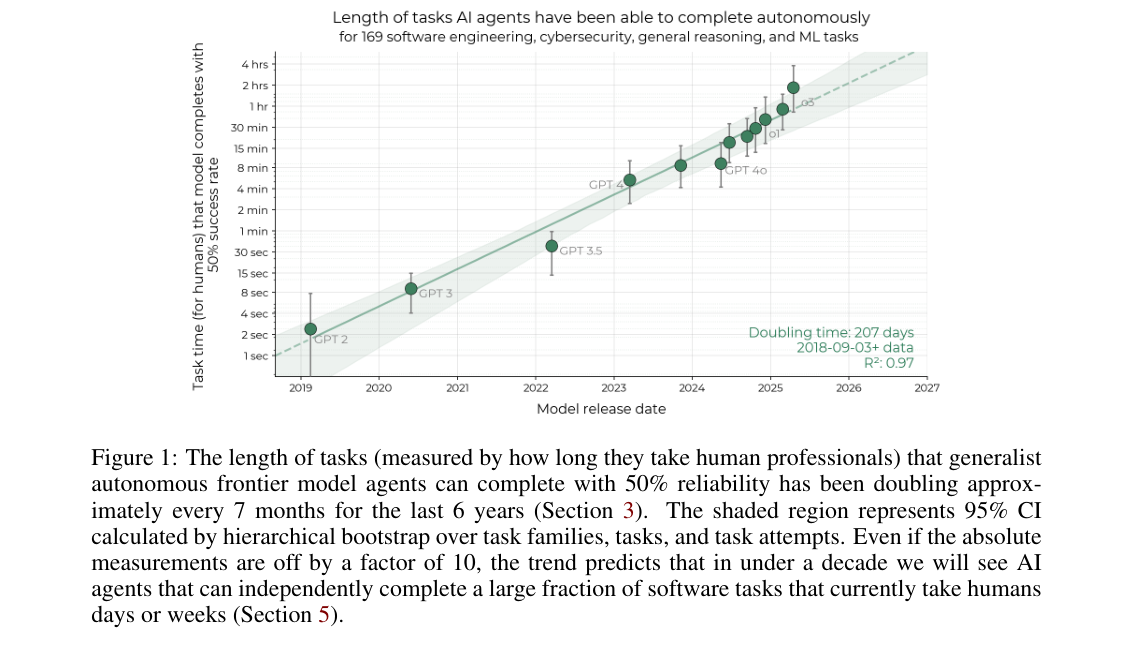
A straight line on a log axis over six years, which is the same functional form as the technology cost curves above. What it does not show is what a task is worth: a horizon measures length at fixed reliability, not depth.
- The metric, in the authors’ definition. They “propose a new metric: 50%-task-completion time horizon, the time humans typically take to complete tasks that AI models can complete with 50% success rate.” Note the direction of the measurement: it is a statement about human task length, not about how long the agent runs.
- The 50% horizon doubled about every seven months from 2019 to 2025. “Frontier AI time horizon has doubled approximately every seven months since 2019, though the trend may have accelerated since 2024.” The original release put frontier models such as o3 at a 50% horizon of roughly 110 minutes, with a doubling time of 195.8 days [162, 223].
- The updated task suite left the long trend intact but shortened the recent one. Time Horizon 1.1 expanded the suite from 170 to 228 tasks, and tasks of 8 hours or more from 14 to 31. On the full period, “This hybrid trend shows exactly the same doubling time as the TH1 trend, of 196 days (7 months).” On the recent period it moves: “We also report below the doubling time since 2024: this was at 109 days under TH1, and falls to 89 days under TH1.1.” From 2023 onward the estimate falls from 165.3 days to 130.8 days [107, 161].
- The acceleration is real but measured on thin data. Only 5 of the 8-hour-plus tasks are human-baselined in the updated suite, which is the binding constraint on estimating a horizon approaching a day. METR also cautions against reading the confidence intervals as a stability guarantee, since “those confidence intervals represent the likelihood of getting the same estimate with an entirely new set of tasks, while in fact there is substantial overlap in the tasks contained in TH1.”
- The authors’ own limitation, quoted because it is the one usually dropped. “Note that this plot does not account for future changes in the trend or external validity concerns, which are responsible for the majority of our uncertainty.” Their account of the mechanism is similarly hedged: the rise “seems to be primarily driven by greater reliability, ability to adapt to mistakes, logical reasoning, and capacity for tool use.”
- The trend appears in other domains too. METR reports analyzing “9 benchmarks for scientific reasoning, math, robotics, computer use, and self-driving in terms of time-horizon trends; we observe generally similar rates of improvement to the 7-month doubling time in our original time-horizon work.”
- Why it belongs here, and the caveat that limits it. It is the closest thing to a general dated capability series at fixed scaffold, which is the measurement Q6 needs and mostly lacks. It is also the methodological parent of the Lyptus cyber horizons [→ Lyptus], so the two are not independent confirmations of an acceleration. And a horizon says nothing about what a result is worth: it cannot distinguish a long shallow task from a long deep one, which is the distinction this project turns on. Both points are this log’s, not METR’s.
- Dates: arXiv 2025-03-18 (v4 2026-07-10); METR write-up 2025-03-19; Time Horizon 1.1 published 2026-01-29; the model series runs 2019 to 2026.
- Bears on: Q1 growth rate, Q6 intertemporal, Q8 benchmarks.
- Links: METR time horizons · arXiv 2503.14499 · original write-up · Time Horizon 1.1
- Status: verified against the arXiv abstract and the Time Horizon 1.1 comparison table, retrieved 2026-07-26.
Comparing efficiency rates across domains (2026)
This log’s synthesis. Not a source: a comparison assembled from the entries above, recorded here so the argument can cite it rather than rebuild it.
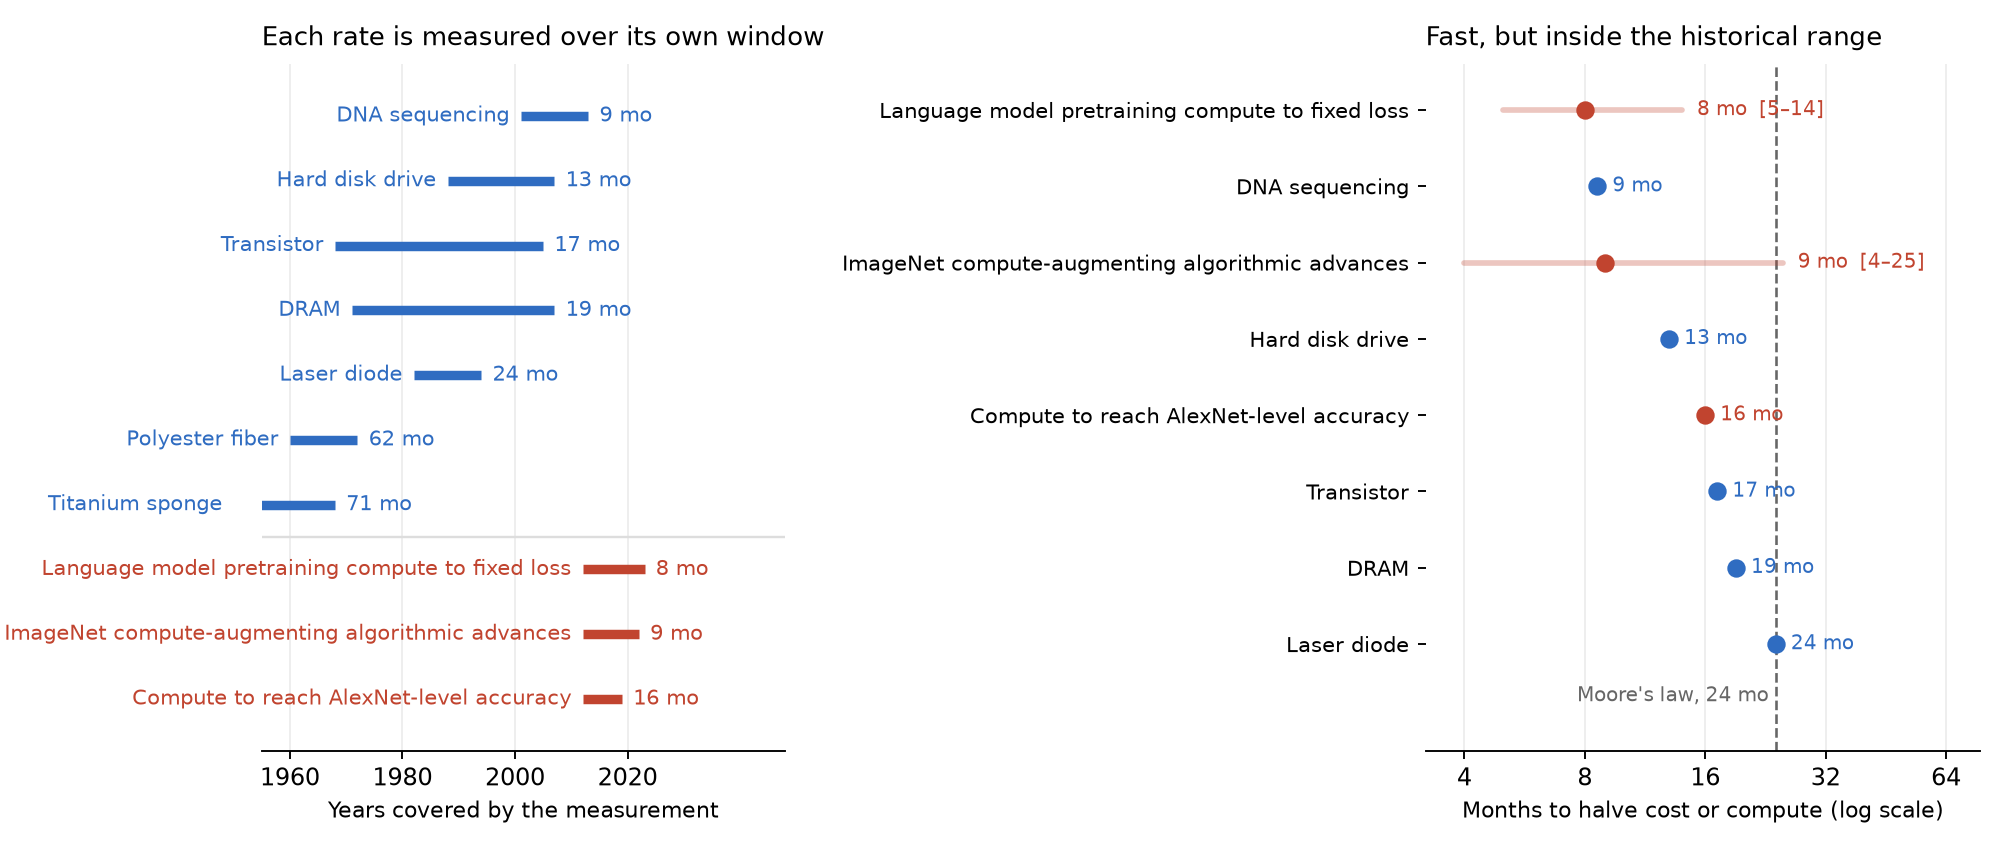
- How it was built. The physical rates are log-linear fits to each series in the Our World in Data CSV [→ OWID], computed by
tools/sources_figures.py; a fit is used rather than an endpoint ratio so a single noisy observation cannot set the rate. The AI rates are quoted from their entries, which now sit in the algorithms section [→ Epoch on LMs, compute-to-AlexNet, ImageNet], not fitted here. Everything in this entry is therefore the log’s arithmetic over other people’s numbers. - AI algorithmic progress is fast, and not unprecedented. Language-model pretraining halves compute every 8 months and ImageNet every 9. DNA sequencing cost halved every 8.6 months over 2001–2013. The fastest measured AI efficiency rate and the fastest measured physical technology cost curve are the same number to within the confidence intervals.
- Both are well inside a range that ordinary industrial technologies have occupied. Hard disk drives halved every 13 months, transistors every 17, DRAM every 19, laser diodes every 24. Compute-to-AlexNet at 16 months sits in the middle of that group rather than above it.
- The distribution is heavily skewed, and the tail is where the interesting cases are. Of the 66 series, 65 fall in cost and one rises, but only five halve faster than every two years; the median falling series takes decades. Rapid exponential improvement is the exception across technologies even though it is the norm within the ones anybody writes about.
- The measurement windows barely overlap, which limits what the comparison can support. The physical curves are mostly mid-twentieth-century and all end by 2013; the AI estimates all start in 2012 and none extends past 2023. Nothing here is a like-for-like contemporaneous comparison, and none of it covers the agent era at all.
- What it is for. It fixes the baseline against which any AI-driven acceleration has to be judged. A theory that predicts AI bends the efficiency curve has to predict a bend relative to rates that were already this fast without AI. This is the log’s framing.
- Dates: physical series 1929–2013; AI estimates published 2020-05-08, 2022-12-10, and 2024-03-09; figure generated 2026-07-26.
- Bears on: Q1 growth rate, Q5 returns, Q7 incidence.
- Links: generated by
tools/sources_figures.pyfromproblems/technology-cost-curves/owid-66-technologies.csvin the data repository (OWID source) - Status: derived — every input figure is quoted in the entry it comes from, and the figure regenerates from the CSV and those quoted rates.
Epoch AI: ML hardware price-performance (2023)
Independent (research organization). The hardware curve the algorithmic-efficiency rates have to be set against. It is here rather than in the algorithms section because it is a comparator for all three domains, and because the comparison is the whole point: this is a slower curve than every algorithmic rate in the log.
- The rate, with both samples. Epoch finds “computational price-performance [FLOP per $] doubling every 2.1 years for ML GPUs and 2.5 years for general GPUs.”
- The samples. 47 ML hardware accelerators over 2010–2023, and 1,948 general GPUs over 2006–2021. Counts read from the page rather than quoted from a sentence.
- Two caveats that bias the comparison in known directions. Measuring price-performance in FP32 may understate ML hardware, because ML workloads use lower-precision formats the metric ignores; and cluster hardware prices are often negotiated privately rather than listed, which makes accurate pricing difficult to determine. Both are Epoch’s points, given here in the log’s words because the fetched text could not be certified sentence-level verbatim — re-quote from the page before putting either inside quotation marks.
- What it establishes for this log. A 2.1-year doubling is roughly 25 months, against 8 months for language-model pretraining efficiency, 9 for ImageNet, and 16 for compute-to-AlexNet [→ Epoch on LMs, ImageNet, compute-to-AlexNet]. So software has been the faster-moving term in AI for a decade, before any agent contributed to it. That matters for reading claims that AI will accelerate AI: the channel with the most historical headroom is the one AI agents are least demonstrably contributing to. This is the log’s reading.
- Dates: published 2023-11-09; the ML accelerator series runs 2010–2023 and the general GPU series 2006–2021. Retrieved 2026-07-26.
- Bears on: Q1 growth rate, Q5 returns, Q6 intertemporal.
- Links: Epoch, trends in machine learning hardware
- Status: verified — the headline rate quote and the sample counts read from the Epoch page, retrieved 2026-07-26. The two caveats are paraphrased from that page rather than certified verbatim, and are marked as such above.
Macro productivity and scientific output
Bloom, Jones, Van Reenen, and Webb: are ideas getting harder to find? (2020)
Independent (academic, peer-reviewed). The canonical measurement of the fishing-out term. Research productivity — ideas produced per researcher — is estimated across US aggregate data, semiconductors, agricultural crop yields, medical innovation, and firm-level panels. This is the entry that calibrates \(\beta\) in the research production function the argument is built on, and it is the pre-AI baseline against which any claimed AI effect has to be judged.
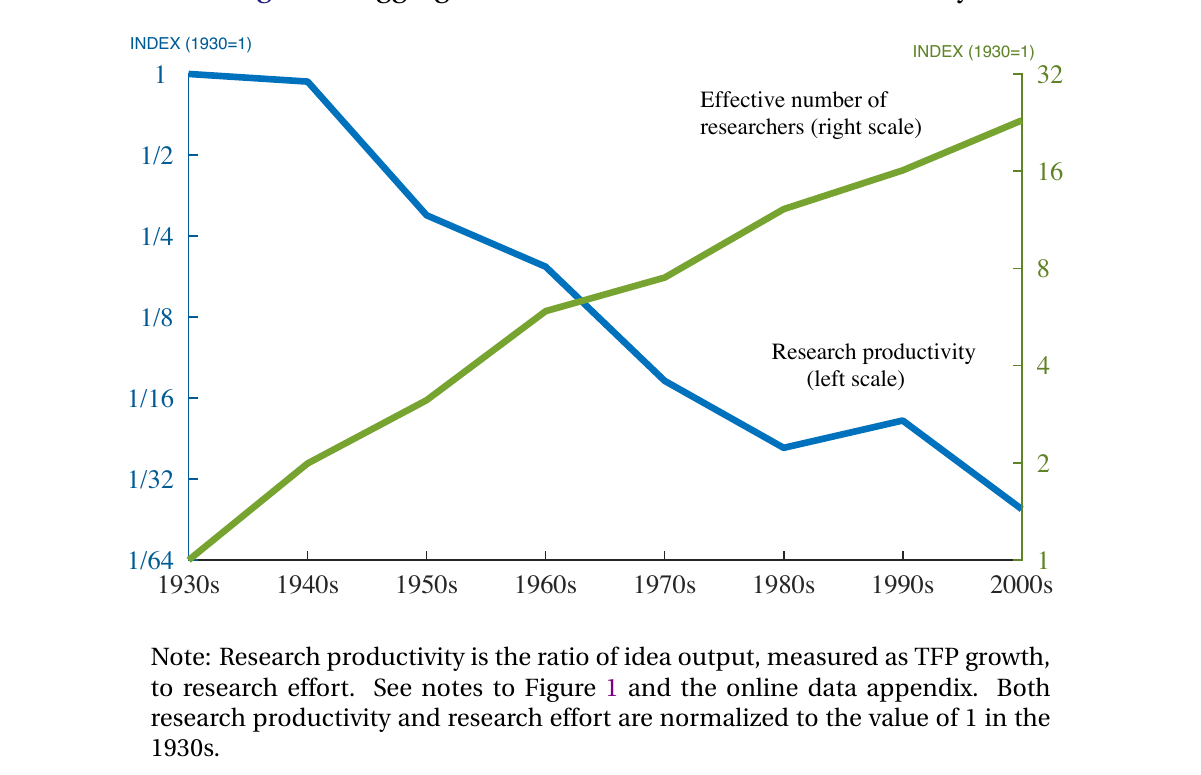
The paper’s Figure 2. Both series are indexed to 1 in the 1930s and plotted on log scales: the effective number of researchers rises by a factor of 23, and research productivity — ideas per researcher — falls by a factor of 41. Research productivity here is the ratio of TFP growth to research effort, so the two plotted lines are the ratio and its denominator.
- Aggregate research productivity halves about every 13 years. In the authors’ words, “Taking the US aggregate number as representative, research productivity falls in half every 13 years: ideas are getting harder and harder to find.” The implication they draw is the one that matters for this project: “just to sustain constant growth in GDP per person, the United States must double the amount of research effort every 13 years to offset the increased difficulty of finding new ideas.”
- Over the long run, effort rose by 23× and productivity fell by 41×. “Since the 1930s, research effort has risen by a factor of 23, an average growth rate of 4.3 percent per year. Research productivity has fallen by an even larger amount, by a factor of 41.” An earlier version of this entry said productivity fell by “a comparable factor” to the rise in effort, which understates it; the two figures are 23 and 41.
- Moore’s Law is the cleanest case, and it is stark. “The number of researchers required today to achieve the famous doubling of computer chip density is more than 18 times larger than the number required in the early 1970s.” The productivity decline follows arithmetically: “Assuming a constant growth rate for Moore’s Law, the implication is that research productivity has fallen by this same factor of 18, an average rate of 6.8 percent per year.” Semiconductors are nonetheless the least diminishing sector they study — “A is growing at 35 percent per year, while research productivity is falling at 7 percent per year,” which they read as “the sector with the least degree of diminishing returns in idea production.”
- The decline is not an artifact of one sector. “Our robust finding is that research productivity is falling sharply everywhere we look,” across crop yields, medical innovation, and firm-level panels as well as semiconductors. The paper opens by calling it settled: “A first-order fact of growth empirics is that research productivity is falling sharply.”
- The paper is explicit that ideas-per-dollar is the wrong measure, and this log contains a lot of ideas-per-dollar. The authors note that “A large literature documents that the flow of new ideas per research dollar is declining,” and then disqualify it: “essentially all the idea-driven growth models in the literature predict that ideas per (real) research dollar will be declining… In other words, these natural measures are not really informative about whether research faces constant or diminishing returns.” The theory-relevant object is ideas per researcher. Several entries here report cost per result — AIxCC’s $152 per task, AlphaProof Nexus’s few hundred dollars per problem, AISI’s $12,500 per attempt — and this is the warning that none of them, on its own, measures returns.
- Why it is load-bearing. Every domain in this log has a large and rising research-effort denominator that mostly goes unmeasured. A falling yield per attempt is the normal state of research, so an apple-picking prediction of falling yield is only distinctive if it falls faster than this baseline. Nothing in this log yet makes that comparison — this sentence is the log’s own assessment, not the paper’s.
- Dates: NBER working paper 23782 issued 2017-09-08; published in the American Economic Review 110(4), April 2020; the underlying series run from the 1930s to about 2015.
- Bears on: Q1 growth rate, Q5 returns.
- Links: AER · NBER w23782 · working paper PDF
- Status: verified against the AER abstract and the working-paper PDF, retrieved 2026-07-26. The 18× and 6.8% figures are quoted from the paper; the aggregate factor is read from its Figure 2 discussion rather than a table. Figure reproduced from the source.
Hao and co-authors: AI expands individual impact and contracts collective focus (2024)
Independent (academic). The largest bibliometric study of AI’s use in science: an LLM classifier labels AI-augmented papers across 41.3 million natural-science papers, and adopters are compared with non-adopters on output, citations, career timing, topic breadth, and follow-on engagement. It is correlational, and the effect sizes are large enough that the selection problem is the first thing to say about them.
- The design, with the classifier’s own accuracy stated. “we used a pretrained language model to identify AI-augmented research, with an F1-score of 0.875 in validation against expert-labeled data. Using a dataset of 41.3 million research papers across natural science and covering distinct eras of AI, here we show an accelerated adoption of AI tools among scientists and consistent professional advantages associated with AI usage, but a collective narrowing of scientific focus.”
- The individual-level associations, which are very large. “Scientists who engage in AI-augmented research publish 3.02 times more papers, receive 4.84 times more citations, and become research project leaders 1.37 years earlier than those who do not.”
- The collective-level counterpart, in the opposite direction. “By contrast, AI adoption shrinks the collective volume of scientific topics studied by 4.63% and decreases scientist’s engagement with one another by 22.00%.”
- The authors’ own reading, and it is close to this project’s thesis. “AI adoption in science presents a seeming paradox – an expansion of individual scientists’ impact but a contraction in collective science’s reach – as AI-augmented work moves collectively toward areas richest in data. With reduced follow-on engagement, AI tools appear to automate established fields rather than explore new ones, highlighting a tension between personal advancement and collective scientific progress.”
- The identification problem, which the abstract does not address. No instrument or exogenous shock is claimed, so a threefold publication difference between adopters and non-adopters is equally consistent with productive scientists adopting AI first. The word in the abstract is “associated,” and it should be preserved in any use. The 4.63% and 22.00% figures are abstract-level and were not checked against the body. This caveat is the log’s.
- Why it belongs here. “Moves toward areas richest in data” and “automate established fields rather than explore new ones” are the streetlight and depletion mechanisms this project is about, measured across all of natural science rather than in three domains. It is the widest-scope evidence in the log and the weakest-identified.
- Dates: arXiv 2024-12-10, with versions through 2025-11-29; the arXiv listing notes acceptance at Nature, which this log has not confirmed with a DOI.
- Bears on: Q1 growth rate, Q4 expertise, Q7 incidence.
- Unused: not yet cited in the argument. It is the closest thing available to a field-wide test of the incidence prediction, and its correlational design is why the argument should cite it with the caveat attached rather than as a headline.
- Links: arXiv 2412.07727
- Status: verified-abstract — quotes and version history checked against the arXiv listing, retrieved 2026-07-26. Body figures not read; the design is a matched observational comparison, not an experiment.
Acemoglu: the simple macroeconomics of AI (2024)
Independent (academic). The standard low-end estimate of AI’s aggregate productivity effect, reached by a task-based application of Hulten’s theorem (Acemoglu 2024). It is in the log for two reasons: it is the number the growth debate is anchored on, and its own argument for why the estimate may be too high is an apple-picking argument in different words.
- The headline, from the April 2024 version. “Using existing estimates on exposure to AI and productivity improvements at the task level, these macroeconomic effects appear nontrivial but modest—no more than a 0.71% increase in total factor productivity over 10 years.”
- His reason for thinking even that is too high, which is the interesting part. “The paper then argues that even these estimates could be exaggerated, because early evidence is from easy-to-learn tasks, whereas some of the future effects will come from hard-to-learn tasks, where there are many context-dependent factors affecting decision-making and no objective outcome measures from which to learn successful performance. Consequently, predicted TFP gains over the next 10 years are even more modest and are predicted to be less than 0.55%.”
- The exposure denominator. From the body: “0.23 × 0.199 = 4.6% of all tasks (or occupations) will be impacted by AI and computer” vision.
- Three different headline figures are in circulation for this one paper, and the entry records all three. The April 2024 MIT version says 0.71% and less than 0.55%. The NBER working paper of May 2024 says “no more than a 0.66% increase in total factor productivity (TFP) over 10 years” and “less than 0.53%.” Aghion and Bunel characterize his result as about 0.07 percentage points a year [→ Aghion and Bunel]. Pin the version whenever the number is quoted; this log’s rule on revised figures is why all three are here rather than the latest.
- The scope limit that matters most for this project. The model has no idea-production channel at all: AI enters only through task-level cost savings in the production of goods and services. So it cannot speak to AI’s contribution to research, which is what this log is about, and it should never be cited as though it could. This is the log’s point and it is the explicit motivation for the next entry.
- Dates: MIT version 2024-04-05; NBER working paper 32487 issued May 2024; published in Economic Policy 40(121), 2025, which was not read here.
- Bears on: Q1 growth rate, Q5 returns, Q7 incidence, Q8 benchmarks — the easy-to-learn-tasks argument is a claim about which benchmarks are informative.
- Links: MIT PDF · NBER w32487
- Status: verified — the MIT-version quotes read from that PDF and the NBER-version figures read from the NBER listing, retrieved 2026-07-26, so the discrepancy between them is checked rather than inferred. The published journal version was not read and may differ again.
Aghion and Bunel: a higher estimate, with the ideas channel explicitly omitted (2024)
Independent (policy note). The direct reply to Acemoglu, using a historical-analogy approach and a re-parameterized version of his own task-based formula (Aghion and Bunel 2024). It is the single most useful entry in the log for Q5, because the authors state in the abstract that the channel this whole project is about has been left out of both estimates.
- Their estimates, and the omission, in one abstract. “Based on the first approach, we estimate that the AI revolution should increase aggregate productivity growth by between 0.8 and 1.3pp per year over the next decade. Using the second approach but with our own reading of the recent empirical literature on the various components of the task-based formula, we obtain a median estimate of 0.68pp additional annual total factor productivity (TFP) growth. Our estimates do not take into account the fact that AI automates tasks not only in the production of goods and services, our focus in this note, but also in the production of ideas.”
- The spread of the second approach. Their reading of the same formula gives “aggregate productivity growth by between 0.07pp and 1.24pp, with a median estimate of 0.68pp,” against Acemoglu’s “much smaller extra growth estimate of 0.07 pp per year.”
- They discount the Copilot trial the log also treats cautiously. “Peng et al. (2023) is less relevant because the task evaluated is too finely defined” [→ Copilot RCT]. So the disagreement with Acemoglu is partly about which micro estimates to feed the formula, not only about the formula.
- Their passage on the ideas channel, quoted at length because it is the closest thing to this project’s thesis from growth economists. “AI could automate, or at least facilitate, the generation of new ideas (Aghion et al., 2018). It will thus help us generate new inventions and solve complex problems, as in the case of AlphaFold, which helps find new proteins, or GNoME, which suggests new materials that could be used in vehicles or everyday objects. The impact of AI on science and innovation is difficult to quantify, especially as AI’s ability to generate new ideas could face practical difficulties. For instance, it is not enough to identify several million potential new materials; they must still be validated experimentally. Nonetheless, AI will at the very least make the work of researchers easier. As AI tools gradually assist humans in identifying new hypotheses, designing protocols, and conducting experiments, the production of relevant ideas will increase. However, the time horizon of these effects remains highly uncertain.”
- And the structural claim they attach to it. “These effects are leading to a permanent increase in the rate of productivity growth. The magnitude of this effect, however, is difficult to quantify.”
- Why this entry justifies the log’s existence. Both sides of the headline macro debate omit the ideas channel and say so, and one of them names experimental validation as the binding difficulty — which is the validation-bottleneck thesis [→ validation bottleneck] appearing in a growth note two years before DeepMind’s essay. The quantity everyone agrees is missing is the quantity this log is trying to assemble. This is the log’s framing.
- Dates: note dated June 2024, circulated via the Federal Reserve Bank of San Francisco.
- Bears on: Q1 growth rate, Q5 returns, Q6 intertemporal, Q8 benchmarks.
- Links: PDF
- Status: verified — all quotes read from the PDF, retrieved 2026-07-26. A policy note rather than a refereed paper, and the 0.8–1.3 point figure comes from a historical analogy to past general-purpose technologies rather than from estimation.
Withdrawn evidence
Toner-Rodgers, “AI, Scientific Discovery, and Product Innovation” (2024) — WITHDRAWN, do not cite
Disavowed (MIT). This November 2024 preprint reported that an AI materials-discovery tool deployed at a large R&D lab raised materials discovered by 44%, patent filings by 39%, and product innovations by 17%, with gains concentrated among the most able scientists. It became the most-cited empirical result on AI and scientific discovery, and specifically on how AI interacts with researcher expertise — which is exactly the question this project’s Q4 asks. It is logged here so that it is not re-used.
- MIT disavowed the paper on 2025-05-16. Its Committee on Discipline stated it has “no confidence in the provenance, reliability or validity of the data” and “no confidence in the veracity of the research contained in the paper.” MIT asked that it be “withdrawn from public discourse.”
- The author is no longer at MIT, and MIT asked arXiv and the QJE to withdraw it. Because arXiv accepts withdrawal requests only from authors, and the author had not submitted one, MIT wrote to arXiv directly.
- Acemoglu and Autor, who had both publicly praised it, joined the disavowal. Their statement notes the paper was “already known and discussed extensively in the literature on AI and science, even though it has not been published in any refereed journal.”
- Subsequent reporting indicates fabrication rather than error. The WSJ account describes an apparently invented study, including a faked data-use agreement, rather than a data-handling mistake.
- Consequence for this project: Q4 has no headline finding. The most quotable claim about AI and researcher expertise is not evidence. Everything the argument says about expertise is therefore assembled from domain-specific observations, which is weaker but real.
- Dates: preprint November 2024; MIT disavowal 2025-05-16; TechCrunch report 2025-05-17; retrieved 2026-07-26.
- Bears on: Q4 expertise — as a negative entry, recording what cannot be used.
- Links: MIT Economics statement · TechCrunch · WSJ account
- Status: verified — the disavowal is verified against MIT’s own statement, retrieved 2026-07-26. The paper’s original figures are reproduced above only to make it identifiable and must not be cited as findings. # Conceptual models
These models locate AI in different parts of the research process: the idea-production function, the division of research into tasks, recursive feedback, or the validation bottleneck. They are grouped here because their mechanisms cut across cyber, mathematics, and algorithms.
Benjamin Jones: AI in R&D (2025)
Independent (economic model). Jones models research as a unit interval of complementary tasks whose outputs combine into progress. Humans can perform every task; machines can perform a share \(\gamma_t\), with machine productivity summarized by \(M_t\) and task bottlenecks governed by \(\theta\) (Jones 2025).
- AI automates tasks, not necessarily whole results. When \(\gamma_t<1\), machines produce some task-level inputs while humans perform the remaining tasks. Strong complementarity means the human-only tasks can bottleneck the final research outcome even if AI becomes arbitrarily productive at its own tasks.
- The human requirement is conditional, not absolute. In the model’s limiting case \(\gamma_t\to1\), machines take over all R&D tasks and progress no longer requires human research labor. Thus the model implies that partial task automation does not independently produce the composite result; it does not assume that human involvement is intrinsically necessary.
- Breadth can matter more than intelligence. With bottlenecks, expanding the share of tasks AI can perform can accelerate progress more than extreme productivity gains on a narrow task subset.
- No fixed frontier assumption. The framework explicitly studies increases in \(\gamma_t\) as AI takes over additional tasks. Its defining feature is task-level substitution plus complementarity, not a permanently fixed boundary between automatable and non-automatable tasks.
- The idea production function is a CES over a unit measure of tasks. Equation (1) is \(\dot Z_t = \zeta Z_t^{\phi}\big[\int_0^1 r_t(j)^{\theta}dj\big]^{1/\theta}\) with \(\theta<0\), where \(\theta\) “governs the degree of complementarity between tasks - i.e., the strength of ‘bottlenecks’” and \(\phi\) decides whether “research advances might become easier (\(\phi > 0\)) or harder (\(\phi < 0\)) as progress continues.” Two notation traps for anyone reading this alongside the argument document: Jones’s \(\theta\) is the CES exponent (the argument calls that \(\rho\), and reserves \(\theta\) for the elasticity of substitution \(1/(1-\theta_{\text{Jones}})\)), and Jones separately uses \(\rho\) for the share of remaining tasks humans still perform.
- Humans can perform every task, and within a task the two inputs are alternatives at a constant rate. Equation (2) sets \(r_t(j) = m_t(j)x_t(j)\) for \(0\le j<\gamma_t\) and \(r_t(j)=H\,l_t(j)\) for \(0\le j\le1\): “we imagine that humans can do all these tasks, but that machines have been created over time that perform some fraction of these tasks.” Machines are deployed only where cost-effective, \(m_t(j)/\mu_t \ge H/w_t\) (Assumption 1), the comparison being available at all because “research labor can do any task.”
- Proposition 1 is a CES unit-cost function, which pins down the isoquant. Maximizing progress subject to \(D_t = \mu_t X_t^r + w_t L_t^r\) gives \(\dot Z_t/Z_t = \zeta Z_t^{\phi-1}D_t\big/\big[\gamma_t(\mu_t/M_t)^{\frac{\theta}{\theta-1}} + (1-\gamma_t)(w_t/H)^{\frac{\theta}{\theta-1}}\big]^{\frac{\theta-1}{\theta}}\), and “all heterogeneity in the machine-task productivities is summarized by the single index \(M_t\).” That denominator is the unit cost of the task aggregate, so the primal technology it is dual to is \(\big[\gamma_t y_1^{\theta} + (1-\gamma_t)y_2^{\theta}\big]^{1/\theta}\) over per-task outputs \(y_1 = (M_tX+HL_1)/\gamma_t\) and \(y_2 = HL_2/(1-\gamma_t)\). The duality is this log’s derivation; the paper states the cost side and does not draw the isoquant.
- Infinite machine intelligence buys a bounded multiple, and that bound is the ceiling the argument tests. Corollary 3: “In the limit where \(M_t\to\infty\), the rate of progress increases by a multiple \(\eta_\infty = (1-s_t^X)^{-1/b}\) for \(\theta<0\),” with \(b=\theta/(\theta-1)\) and \(s^X_t\) the machine expenditure share. Jones’s illustration takes \(\theta=-1\) and \(s^X=1/3\), so the factor is \(2.25\): “the rate of progress would a bit more than double with infinite productivity across the entire current set of non-labor tasks.” Corollary 1 gives \(s^X_t = \gamma_t\) when machines and labor are exactly break-even per dollar (\(C_t = M_tw_t/H\mu_t = 1\)), in which case the bound reduces to \((1-\gamma_t)^{1/\theta-1}\) — computed here from the two results, not stated in the paper.
- Dates: conference manuscript September 2025; NBER working paper 34312 issued 2025-10-02.
- Bears on: Q2 autonomy, Q3 demand, Q5 returns, Q7 incidence.
- Links: NBER working paper 34312 · September 2025 manuscript
- Status: verified against the full manuscript.
Bazzichi, Riccaboni, and Castellacci: recombinant innovation (2026)
Independent (economic model). This April 2026 model puts ideas in a knowledge space and asks whether AI pushes R&D firms toward close, incremental recombinations or distant, radical ones.
- Two AI margins point in different directions. Higher AI productivity can make distant combinations more feasible. But increasing the share of research tasks assigned to AI has an inverted-U effect: automation initially supports more radical combinations, then shifts research back toward incremental combinations once human–AI complementarity erodes.
- Streetlight and duplication mechanisms. Heavy reliance on similar systems concentrates search in data-rich, well-explored regions (the “streetlight effect”) and makes different researchers converge on the same suggestions (the “stepping-on-toes effect”).
- Strong limiting prediction. Under the paper’s functional form, optimal recombinant distance collapses to zero at full automation. This is not a generic theorem about AI; it follows from the model’s assumption that originality requires a residual complementary human contribution.
- Distinct from apple-picking. Both can predict shallow and duplicate-heavy output, but this model locates the cause in homogenized search and lost human complementarity, not an intrinsic reach ceiling. It also predicts that greater AI productivity can increase radicalness even while broader automation eventually reduces it.
- Dates: arXiv 2026-04-02.
- Bears on: Q3 demand, Q5 returns, Q7 incidence.
- Links: arXiv 2604.02189
- Status: verified against the full paper.
DeepMind: conjecture machines and the validation bottleneck (2026)
Vendor (Google DeepMind policy essay, July 2026). A qualitative theory of AI-driven science: agents make hypotheses and candidate solutions abundant and cheap, while testing whether they survive contact with reality remains slow, costly, physical, and institutional.
- Domain prediction. AI contributes end-to-end results first where checking is cheap and automatable — code execution, scoring functions, formal proof — while physical experiments, expert review, and tacit laboratory work become tighter bottlenecks elsewhere.
- Candidate glut rather than researcher equivalence. More agents can generate more proposals without proportionally increasing validated knowledge. The relevant scarce input becomes verifier throughput, including peer review and experimental infrastructure.
- Math is only partly exempt. Formalized proofs can be checked automatically, but natural-language proofs can still create “proof indigestion” faster than mathematicians can absorb them.
- Relationship to Jones. This is a more specific bottleneck account, not a complete production model: it says which task should become scarce as generation gets cheap, but does not model the changing task boundary or aggregate growth.
- Dates: published July 2026; the page shows no posting date, so this is the coarsest date in the log.
- Bears on: Q3 demand, Q7 incidence.
- Links: Conjecture Machines
- Status: verified against the primary essay; vendor.
Davidson, Halperin, Houlden, and Korinek: recursive R&D feedback (2026)
Independent (economic growth model). A 2026 semi-endogenous growth model asks when automating AI research creates superexponential growth through an innovation network.
- Two reinforcing loops. Better technologies raise research productivity in connected sectors (for example, software and hardware improve each other), while higher output finances more accumulable machine researchers. Together these loops can offset diminishing returns to ideas.
- Bottlenecks matter, but need not dominate. Slow complementary sectors can block explosive growth; sufficiently fast expansion of task automation can relax those bottlenecks.
- Different empirical object. The model predicts acceleration and cross-sector spillovers over time, not whether any one contribution is shallow, autonomous, duplicate, or easy to verify. The three domain snapshots in the companion argument therefore cannot adjudicate its central claim without a time series linking AI-generated improvements back into subsequent AI capability.
- Dates: NBER working paper 35155 issued 2026-04-30.
- Bears on: Q1 growth rate, Q6 intertemporal.
- Links: NBER working paper 35155
- Status: verified against the full working paper.
Aghion, Jones, and Jones: AI in the idea production function (2017)
Independent (economic model), peer-reviewed as a volume chapter. The foundational model of AI in knowledge production, and the direct ancestor of the ceiling test in the companion argument’s formalization (Aghion, Jones, and Jones 2019). AI enters the input index of the idea production function as the automated share of research tasks, and the elasticity of substitution does all the work. Anyone extending the argument’s formal section should start here rather than with the argument.
- The organizing insight, which is Baumol’s. “One theme that emerges is based on Baumol’s ‘cost disease’ insight: growth may be constrained not by what we are good at but rather by what is essential and yet hard to improve.”
- The functional form, in their notation. They write \(\dot A_t = A_t^{\phi}\big((B_tK_t)^{\rho} + (C_tS_t)^{\rho}\big)^{1/\rho} \equiv A_t^{\phi}F(B_tK_t, C_tS_t)\), “where \(S_t\) is the research labor used to make ideas,” with \(\beta_t\) the automated task fraction entering through \(B_t\) and \(C_t\). Their symbols are not the argument’s reserved notation: their \(\beta\) is the automated research-task share (the argument’s \(s\)), their \(\phi\) is the stock exponent, and their \(\gamma\) is an explosion index. Translate before citing.
- Partial automation of research gives a level effect, not a growth effect — this is the ceiling result. “The second line follows if \(K_t/S_t\) is growing over time (i.e. if there is economic growth) and if the elasticity of substitution in \(F(\cdot)\) is less than one, which we’ve assumed. In that case, the CES function is bounded by its scarcest argument, in this case researchers. Automation then essentially produces a level effect but leaves the long-run growth rate of the economy unchanged if \(\phi<1\).”
- Complete automation of idea production gives a singularity. “Once all tasks can be automated — i.e. once an A.I. replaces all people in the idea production function — the production of new ideas is given by \(\dot A_t = K_tA_t^{\phi}\). With \(\phi>0\), this differential equation is ‘more than linear.’… it is easy to see from this solution that \(A(t)\) exceeds any finite value before date \(t^* = 1/(\phi A_0^{\phi})\). This is a singularity.”
- Whether full automation is required depends on the aggregator, and they are precise about it. “With the CES case and an elasticity of substitution less than one, we require that all tasks are automated. If only a fraction of the tasks are automated, then the scarce factor (labor) will dominate, and growth rates do not explode. We show in this section that with Cobb-Douglas production, a Type II singularity can occur as long as a sufficient fraction of the tasks are automated. In this sense, the singularity might not even require full automation.”
- A pessimistic result of theirs that almost never gets cited. “In the Appendix we show that if some steps in the innovation process require human R&D, A.I. could possibly slow or even end growth by exacerbating business-stealing, which in turn discourages human investments in innovation.”
- Why it is the most important conceptual entry in the log. The argument’s central formal claim — that task replacement’s ceiling is proportional to labor while apple-picking’s is not — is this paper’s bounded-by-the-scarcest-argument result, restated for a different stock. The argument reaches it independently and does not currently cite it. That is an omission rather than a disagreement. This assessment is the log’s.
- Dates: NBER working paper 23928, October 2017; published as a chapter in The Economics of Artificial Intelligence: An Agenda, 2019.
- Bears on: Q1 growth rate, Q2 autonomy, Q5 returns, Q6 intertemporal.
- Links: NBER w23928 · working paper PDF
- Status: verified — every quote and equation above re-checked against the working-paper PDF’s own text, retrieved 2026-07-26. The Baumol sentence is from the abstract, which repeats it almost exactly in the introduction as “economic growth may be constrained not by what we do well but rather by what is essential and yet hard to improve”; the scarcest-argument, singularity, Cobb-Douglas, and business-stealing quotes are from the body and its footnote. The working paper is not peer-reviewed; the 2019 volume chapter is.
Korinek and Suh: whether wages collapse depends on the tail of task complexity (2024)
Independent (economic model). A transition model in which rising capability automates progressively more complex tasks (Korinek and Suh 2024). It is the closest published analogue to a reachable-set formulation, defined over a distribution of task complexity rather than over a stock of results — which makes it the natural comparison for apple-picking’s moving reach height.
- Two regimes, turning on whether human task complexity is bounded. If the complexity distribution has a sufficiently thick infinite tail, “there is always enough work for humans, and wages may rise forever.” If human task complexity is bounded and full automation occurs, “wages collapse.”
- The intermediate case is where the interesting behavior is. Automation productivity may generate “broad-based gains in the returns to all factors,” while “bottlenecks to growth from irreproducible scarce factors may exacerbate the decline in wages.”
- How it relates to apple-picking. Both models make the reachable set a threshold on a fixed distribution and both let the threshold rise with capability. The difference is what the distribution is over: task complexity here, difficulty of results there. Korinek and Suh’s boundedness question — thick tail or bounded support — is exactly the question the argument’s alternative formalizations section asks about the difficulty density. The two literatures are asking one question in two vocabularies. This comparison is the log’s.
- Dates: arXiv 2024-03-17; also circulated as an NBER working paper in 2024.
- Bears on: Q2 autonomy, Q3 demand, Q5 returns, Q6 intertemporal.
- Links: arXiv 2403.12107 · NBER listing
- Status: verified-abstract — the quoted phrases and dates checked against the arXiv listing, retrieved 2026-07-26. The NBER working-paper number was seen in a search result rather than confirmed on nber.org, so confirm it before citing that number specifically.
Ide and Talamas: autonomous AI helps the most knowledgeable, assistive AI helps the least (2023)
Independent (economic model). A knowledge-hierarchy model in which AI agents can act as co-workers, solvers, or co-pilots (Ide and Talamas 2024). AI enters through which rung of the hierarchy it can staff, so capability determines the layer rather than scaling an input index. It is the best formal treatment in the log of the interaction between autonomy and expertise, which is the pair the argument’s Q4 row keeps running into.
- The central result, and it is a conditional one. “We model AI as a technology that converts computational resources into ‘AI agents’ that operate autonomously (as co-workers and solvers/co-pilots) or non-autonomously (solely as co-pilots). Autonomous AI primarily benefits the most knowledgeable individuals; non-autonomous AI benefits the least knowledgeable. However, output is higher with autonomous AI. These findings reconcile contradictory empirical evidence and reveal tradeoffs when regulating AI autonomy.”
- Why the reconciliation claim matters for this log. The expertise section holds studies that disagree about sign — compression in customer support and in an education-gap experiment, divergence among Kenyan entrepreneurs [→ support agents, education gap, Kenya]. This model says the sign should depend on whether the AI acts autonomously or assists, which is a structured prediction rather than an appeal to setting. Nothing in the log tests it, and it is testable. This reading is the log’s.
- Dates: arXiv 2023-12-09, with twelve versions through 2025-05-17; a journal DOI is listed on the arXiv page.
- Bears on: Q2 autonomy, Q3 demand, Q4 expertise.
- Links: arXiv 2312.05481 · journal DOI
- Status: verified-abstract — the abstract, authorship, and version history checked against the arXiv listing, retrieved 2026-07-26. Twelve versions over eighteen months, so any result quoted from the body needs its version pinned.
Besiroglu, Emery-Xu, and Thompson: AI-augmented R&D is more capital-intensive (2022)
Independent (academic, peer-reviewed in Research Policy). Estimates idea production functions for two computer-vision tasks and reads off factor shares (Besiroglu, Emery-Xu, and Thompson 2024). It is the closest thing in the log to a measured elasticity of research output with respect to compute, which is the parameter the argument’s Q5 row is about.
- The finding, with the authors’ conclusion stated as conditional. “We assess this impact by estimating the idea production function for AI in two computer vision tasks that are considered key test-beds for deep learning and show that AI idea production is notably more capital-intensive than traditional R&D. Because increasing the capital-intensity of R&D accelerates the investments that make scientists and engineers more productive, our work suggests that AI-augmented R&D has the potential to speed up technological change and economic growth.”
- What this log will not claim from it. The frequently-repeated summary that US growth might double, and the specific estimated capital shares, are not in the abstract and have not been checked against the body here. Do not attach a doubling figure to this entry.
- Why it bears on the argument’s formal section. Every one of the four theories is a statement about how AI spend enters the input index, and the capital share of idea production is the empirical content of that statement. Two computer-vision tasks is a thin basis for it, but it is more than the argument currently has, which is nothing. This framing is the log’s.
- Dates: arXiv 2022-12-15 (v2 2023-01-02); published in Research Policy 53(7), 2024.
- Bears on: Q1 growth rate, Q5 returns, Q6 intertemporal.
- Links: arXiv 2212.08198
- Status: verified-abstract — abstract, dates, and journal details checked against the arXiv listing, retrieved 2026-07-26. The publisher blocks automated fetching, so the body and its estimates have not been read.
Measurement and benchmark validity
Q8 asks which benchmarks predict real value, and it is the only one of the eight questions where the relevant literature is about the instruments rather than about AI. These entries audit the measurements the rest of the log depends on. They are collected rather than distributed across the domains because the failure modes are general: a score can move without any capability moving, a ranking can invert under a different scoring rule, and a proxy can be optimized while the objective it stands in for does not budge.
Two entries auditing the optimization benchmarks specifically stay in the Algorithms section, because that is what they audit [→ benchmark reliability, PERFOPT]. The FrontierMath funding-disclosure episode is recorded inside that entry for the same reason [→ FrontierMath]. Grace’s selection warning is the oldest statement of the general problem and sits with her survey [→ Grace].
Kapoor and co-authors: AI agents that matter (2024)
Independent (academic, Princeton). The general methodological critique of agent benchmarking, and the reason to distrust a leaderboard position as evidence of anything. It is the parent of the specific audits elsewhere in the log.
- Accuracy-only evaluation distorts what gets built. “First, there is a narrow focus on accuracy without attention to other metrics. As a result, SOTA agents are needlessly complex and costly, and the community has reached mistaken conclusions about the sources of accuracy gains.”
- Holdout sets are often absent, so overfitting is invisible. “Third, many agent benchmarks have inadequate holdout sets, and sometimes none at all. This has led to agents that are fragile because they take shortcuts and overfit to the benchmark in various ways.”
- Two audiences get conflated, which is exactly the Q8 question. “Second, the benchmarking needs of model and downstream developers have been conflated, making it hard to identify which agent would be best suited for a particular application.”
- Reproducibility. “Finally, there is a lack of standardization in evaluation practices, leading to a pervasive lack of reproducibility.”
- Why it is load-bearing for this log rather than a caveat. Almost every capability figure recorded here is a benchmark score, and the first point above says such scores conflate capability with cost and scaffold sophistication — which is the same confound Naptime measured at twentyfold [→ Naptime] and PERFOPT measured across agent frameworks [→ PERFOPT]. Three independent routes to one conclusion. This synthesis is the log’s.
- Dates: arXiv 2024-07-01.
- Bears on: Q1 growth rate, Q5 returns, Q8 benchmarks.
- Links: arXiv 2407.01502
- Status: verified-abstract — all four quotes checked against the arXiv abstract, retrieved 2026-07-26.
The SWE-bench illusion: memorization rather than reasoning (2025)
Independent (academic, Purdue and Microsoft authors). The strongest contamination critique of the benchmark most lab announcements quote, and it supplies its own out-of-distribution control rather than only raising the possibility.
- The claim, hedged by the authors themselves. “We present empirical evidence that performance gains on SWE-Bench-Verified may be partially driven by memorization rather than genuine problem-solving.” The word is “partially,” and the entry keeps it.
- The headline diagnostic, with the control that makes it a diagnostic. “We show that state-of-the-art models achieve up to 76% accuracy in identifying buggy file paths using only issue descriptions, without access to repository structure. This performance is merely up to 53% on tasks from repositories not included in SWE-Bench, pointing to possible data contamination or memorization.” Locating a bug without seeing the code is only possible if the answer is already known.
- A second diagnostic pointing the same way. “Similar patterns are also observed for the function reproduction task, where the verbatim similarity is much higher on SWE-Bench Verified than on other similar coding benchmarks (up to 35% consecutive 5-gram accuracy on SWE-Bench Verified and Full, but only up to 18% for tasks in other benchmarks).”
- What it does to the rest of the log. SWE-bench scores are the usual public evidence for rapid agentic coding progress, and this says an unknown share of the level is memorization. It does not follow that the trend is spurious, since contamination would have to be growing over time to produce a false slope — but nothing here establishes that it is not. This reading is the log’s.
- Dates: arXiv 2025-06-14 (v4 2025-12-01).
- Bears on: Q1 growth rate, Q7 incidence, Q8 benchmarks.
- Links: arXiv 2506.12286
- Status: verified — the abstract of v4 read verbatim on arXiv, retrieved 2026-07-26.
Sakana on kernel benchmarks: a vendor conceding exploitable loopholes (2025)
Vendor (Sakana AI). Included because it is a vendor stating in a primary document that the previous generation of CUDA-kernel speedup claims was measured on a gameable harness. That makes it evidence about the reliability of kernel-speedup figures generally, which several entries here report.
- The concession about the existing benchmarks. “existing kernel generation benchmarks suffer from exploitable loopholes and insufficient diversity in testing conditions, hindering true generalization assessment.”
- What they built in response. “we introduce robust-kbench, a new benchmark for rigorous evaluation of kernel performance and correctness across varied scenarios.”
- The result is stated qualitatively, and the absence of a multiple is the notable part. “Evaluated on robust-kbench, our approach produces CUDA kernels outperforming torch implementations for practical applications, including forward and backward passes.” No headline speedup factor appears, which is a marked change from the earlier generation of claims in this area.
- Why it matters for reading the kernel results in this log. TTT-Discover’s cross-hardware kernel gains are reported against human leaderboard submissions rather than against a torch baseline [→ TTT-Discover], which is a stronger comparator, but the general lesson stands: a kernel speedup is a measurement on a harness, and harnesses in this area have been shown to be gameable by the people building the agents. This framing is the log’s.
- Dates: arXiv 2025-09-16; the landing page for the earlier work now resolves to this paper.
- Bears on: Q1 growth rate, Q2 autonomy, Q8 benchmarks.
- Links: arXiv 2509.14279 · project page
- Status: verified-abstract — quotes checked against the arXiv abstract, retrieved 2026-07-26. The earlier claims this paper supersedes, and the independent replication that reportedly found them overstated, are secondhand and are deliberately not quoted here.
GDPval: a benchmark built to predict economic value, with its authors’ limits (2025)
Vendor (OpenAI). The current best-funded attempt to connect a benchmark score to economic value, and a useful source on its own limitations. It measures professional deliverables rather than research, so its relevance is as a template for what a value-predictive benchmark looks like.
- Construction and coverage. “GDPval covers the majority of U.S. Bureau of Labor Statistics Work Activities for 44 occupations across the top 9 sectors contributing to U.S. GDP. Tasks are constructed from the representative work of industry professionals with an average of 14 years of experience. We find that frontier model performance on GDPval is improving roughly linearly over time, and that the current best frontier models are approaching industry experts in deliverable quality.”
- Denominators. 1,320 tasks across 44 occupations, with a 220-task open-sourced gold subset across 9 sectors.
- The headline is a win-or-tie rate on the subset, not a win rate on the whole. “Claude Opus 4.1 was the best performing model on the GDPval gold subset,” with “47.6% of deliverables…graded as better than (wins) or as good as (ties) the human deliverable.” Both qualifications matter and both are routinely dropped.
- The authors’ own limitations, which are the reason this is a Q8 entry rather than a Q1 one. Tasks “are precisely-specified and one-shot, not interactive”; the evaluation focuses on “self-contained knowledge work”; the dataset is an “initial cut” rather than comprehensive; and it cannot capture “extensive tacit knowledge” or work requiring “communication between individuals.” Research is interactive, ill-specified, and tacit-knowledge-heavy, so a GDPval score is not a proxy for research capability.
- Dates: arXiv 2025-10-05.
- Bears on: Q1 growth rate, Q2 autonomy, Q8 benchmarks.
- Links: arXiv 2510.04374
- Status: verified — abstract and metadata from the arXiv listing and the task counts, win-or-tie rate, and limitations from the arXiv HTML of v1, retrieved 2026-07-26. Produced by a lab evaluating frontier models including competitors’.
AI-discovered drugs: the proxy clears, the objective does not (2024)
Vendor (Boston Consulting Group authors), peer-reviewed journal article. Clinical-trial outcomes for molecules discovered by AI-native biotech companies. This is the cleanest case in the log of a measurable proxy being optimized while the objective it stands for does not move, which is the Q8 failure mode in its purest form.
- Both phases, with the authors’ own sample caveat in the same sentence. “In Phase I we find AI-discovered molecules have an 80-90% success rate, substantially higher than historic industry averages. This suggests, we argue, that AI is highly capable of designing or identifying molecules with drug-like properties. In Phase II the success rate is ∼40%, albeit on a limited sample size, comparable to historic industry averages. Our findings highlight early signs of the clinical potential of AI-discovered molecules.”
- The structure of the result is the finding. Phase I tests safety and tolerability, which track drug-likeness — a property with computable proxies to optimize against. Phase II tests whether the drug works in patients, which has no such proxy. The advantage is large where a proxy exists and absent where it does not. That is the same pattern as cheap-verifier dominance across this log’s three domains, arriving from pharmacology. The reading is the log’s; the authors say only “comparable to historic industry averages.”
- The denominator is not established here and must not be invented. The abstract says only “a limited sample size.” Secondary sources give molecule counts between about twenty and about seventy; none is verified, so no rate from this entry should be quoted with an N.
- Dates: published in Drug Discovery Today 29(6), 2024.
- Bears on: Q1 growth rate, Q2 autonomy, Q5 returns, Q8 benchmarks.
- Links: DOI 10.1016/j.drudis.2024.104009
- Status: verified-abstract — the abstract was retrieved through the Europe PMC record for the DOI, retrieved 2026-07-26, because the publisher blocks automated fetching; the body has not been read and no denominator has been confirmed. The authors are consultants with commercial interests in AI-native biotech.
Stack Overflow developer survey: adoption high, trust low (2025)
Independent (Stack Overflow), self-selected survey. The practitioner-reported version of the Q8 question: why a capable-looking tool can fail to produce value. Weak evidence by the log’s own ranking, included because the “almost right” figure names a specific mechanism that the measured studies corroborate.
- Adoption. “84% of respondents are using or planning to use AI tools in their development process,” and “51% of professional developers use AI tools daily.”
- Trust, with both sides. “46% of developers actively distrust the accuracy of AI tools” against 33% who trust it and 3% who are “highly trusting.”
- The mechanism, and it is the one the METR trial measured. 66% encounter “AI solutions that are almost right, but not quite,” and 45.2% report that “Debugging AI-generated code is more time-consuming.” METR’s randomized trial found exactly this overhead — reviewing and correcting output offsetting the time saved generating it [→ METR RCT] — so the survey’s mechanism has an experimental counterpart even though the survey itself cannot establish it.
- Denominator and its limits. 33,662 responses on the overall usage question. Self-selected sampling, so these are not population estimates and the log’s evidence ranking puts stated perceptions at the bottom.
- Dates: published 2025; field dates are not stated on the page read.
- Bears on: Q1 growth rate, Q3 demand, Q8 benchmarks.
- Links: survey AI section
- Status: unverified as measurement, verified as to figures — the percentages and the response count were read from the survey page, retrieved 2026-07-26. A self-selected online survey of stated perceptions, with no counterfactual.
Simple baselines match code evolution, so the machinery may not be what works (2026)
Independent (academic, Gideoni, Risi, and Gal). An attribution audit of the evolutionary-coding-agent literature, including a direct replication of nine AlphaEvolve problems. It is the only entry in this log that asks whether the search method credited with a mathematical result is what produced it, which is the attribution question every AI-discovery claim in the Math and Algorithms sections rests on.
- The claim, across three domains. The paper tests “two simple baselines over three domains: finding better mathematical bounds, designing agentic scaffolds, and machine learning competitions,” and reports that the simple baselines “match or exceed much more sophisticated methods in all three domains.”
- The replication, with its denominator. Nine problems from the AlphaEvolve paper were used as case studies [→ AlphaEvolve mathematics]. Randomly sampling programs from an LLM matched AlphaEvolve on two problems, and matched or improved on the strong open-source baseline ShinkaEvolve on eight of the nine.
- The mechanism claim is the important part, and it relocates the credit. For mathematical bounds, the search space and the domain knowledge placed in the prompt are what chiefly determine performance, with the evolutionary pipeline secondary; the authors conclude the primary challenge is designing good search spaces rather than the search itself. If that is right, an AI-improved bound is substantially a human-specified-search-space result, which is the same “expertise moved to the harness” pattern the algorithms domain shows [→ TTT-Discover, PERFOPT].
- What it does not claim. It does not say the bounds were not improved, nor that LLMs contributed nothing — random sampling from an LLM is still using the model. It says the sophistication of the scaffold is not where the gain comes from. Conflating the two would overstate it, and this distinction is the log’s.
- Scope caveat. Nine problems out of 67, and the paper is a preprint whose peer-review status is unclear: closely-titled versions appear on OpenReview as both “Simple Baselines are Competitive with Code Evolution” and “Random Baselines for Simple Code Problems are Competitive with Code Evolution,” the latter listed against NeurIPS 2025. This log has not established which is the version of record, and the two titles differ in how strong a claim they make.
- Dates: arXiv 2026-02-18; the OpenReview and NeurIPS 2025 listings of the closely-titled versions are not separately dated here.
- Bears on: Q1 growth rate, Q4 expertise, Q8 benchmarks.
- Links: arXiv 2602.16805 · OpenReview · closely-titled NeurIPS version
- Status: unverified — the three-domain claim, the nine-problem replication counts, the search-space conclusion, and the 2026-02-18 date are taken from the arXiv listing and search-surfaced summaries, retrieved 2026-07-26. Neither the paper body nor the OpenReview versions have been read, and no figure is quoted. Verify before the argument leans on it.
Expertise and demand
Almost nothing in this section is about cyber, math, or algorithms. It is here because Q4 lost its headline finding to a fabrication [→ Toner-Rodgers] and Q3 had no occupation-level evidence at all, so the argument was reasoning about expertise and demand from domain anecdote. This literature measures the interaction between AI and user ability directly, often with randomization, and it measures labor-market outcomes with a counterfactual — on tasks and occupations that are mostly not research.
Every entry carries an external-validity discount and should be cited with it: a consultant writing a memo is not a mathematician attacking an open problem, a freelance copywriter is not a security researcher, and the reachable zone in one setting says little about the other. Two entries carry a smaller discount than the rest, because software developers are among the occupations they cover [→ canaries, and the two Copilot studies in the algorithms section]. The section was previously titled “outside the three domains,” which stopped being accurate once those were added.
The section’s most useful property is that the studies disagree about the sign, and the disagreement is structured rather than noisy: it tracks whether the task has a checkable answer and how good the starting point was. The synthesis below collects the designs in one place [→ experimental evidence].
Dell’Acqua and co-authors: the jagged technological frontier (2023)
Independent (academic, preregistered field experiment), peer-reviewed. 758 Boston Consulting Group consultants randomized to no AI, GPT-4, or GPT-4 with a prompt-engineering overview, after a baseline performance measurement. The source of the “jagged frontier” term the cyber entries use.
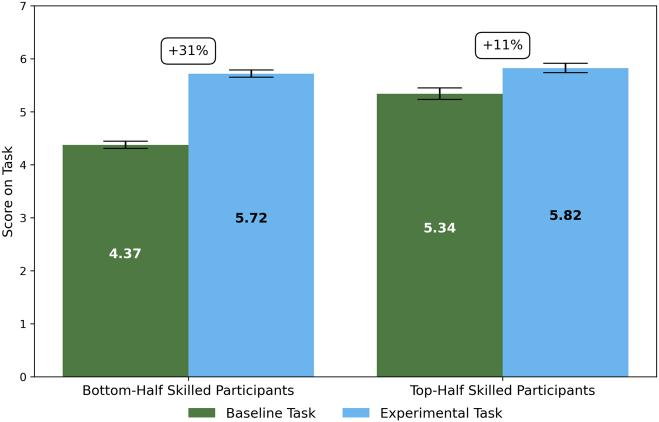
The paper’s Figure 4, for the inside-the-frontier tasks. Bottom-half skilled participants score 4.37 at baseline and 5.72 with AI, a 31% gain; top-half participants score 5.34 and 5.82, an 11% gain. Both groups improve and the gap between them narrows. The paper’s outside-the-frontier experiment, reported separately, runs in the other direction.
- Inside the frontier the effect is large and positive. Across 18 realistic consulting tasks, subjects with AI completed 12.2% more tasks, 25.1% more quickly, at significantly higher quality.
- Outside it the effect reverses sharply. On a complex managerial task chosen to sit beyond AI’s capability, subjects using AI were 19% less likely to reach a correct solution than those without it. Same workers, same workflow, similar apparent difficulty.
- This is the cleanest experimental statement of a reach boundary. A task-level discontinuity in the sign of the effect, established by randomization, is what apple-picking and task replacement both predict and what uniform acceleration does not. It does not discriminate between the two, because both posit a boundary; they differ on what happens at it.
- Gains were largest for the lowest performers. The below-average consultants gained most, so within the frontier the effect was skill-compressing.
- Idea diversity fell. The paper documents a compression in the diversity of ideas among AI-using consultants, which is the same homogenization mechanism the recombinant-innovation model predicts [→ recombinant innovation].
- Dates: field experiment conducted 2023 with GPT-4; HBS working paper September 2023; published in Organization Science 2026-03-01.
- Bears on: Q4 expertise, Q5 returns, Q7 incidence.
- Links: Organization Science · HBS PDF
- Status: verified-abstract — headline figures checked against the published abstract and the HBS working-paper PDF, retrieved 2026-07-26. Figure reproduced from the source.
Brynjolfsson, Li, and Raymond: generative AI at work (2023)
Independent (academic, staggered field rollout). About 5,000 customer-support agents at a software firm, using the phased deployment of an AI assistant for identification. The most-cited evidence that AI compresses the within-occupation skill distribution.
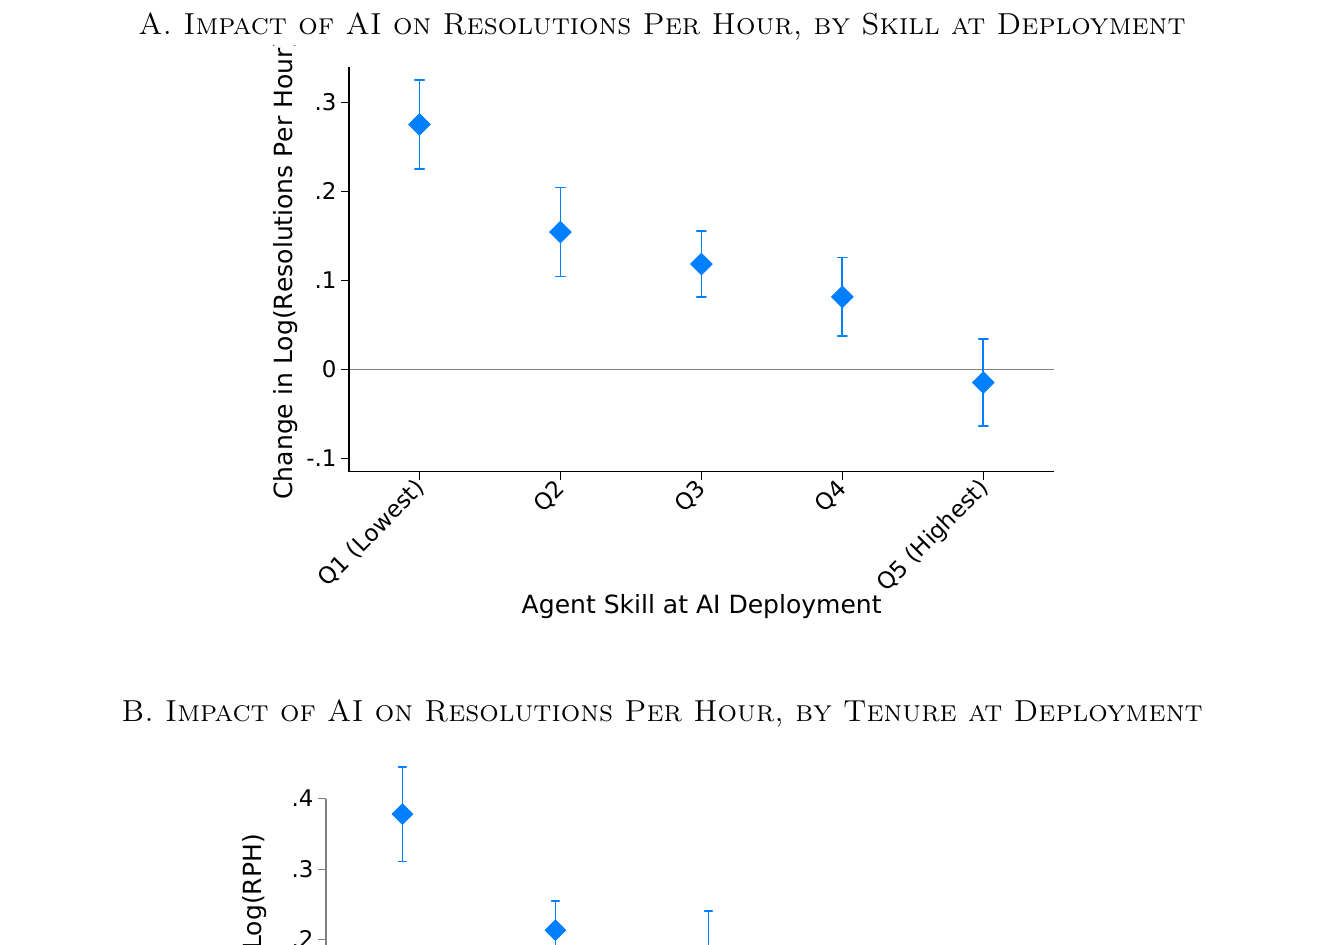
The paper’s Figure 5. Panel A groups agents into quintiles of pre-AI skill and panel B by tenure at deployment; both plot the change in log resolutions per hour following deployment. The gradient is monotone in both panels, and in each the top group’s estimate is indistinguishable from zero.
- Average productivity rose 14%, and the gain was concentrated among the least skilled. In the authors’ words, access to the tool “increases productivity, as measured by issues resolved per hour, by 14% on average, including a 34% improvement for novice and low-skilled workers but with minimal impact on experienced and highly skilled workers.” The sample is 5,179 agents.
- “Minimal impact” is visible as zero in the figure. The top skill quintile and workers with more than twelve months’ tenure both have point estimates indistinguishable from zero.
- The implied mechanism is knowledge transfer. The assistant surfaced the practices of high performers to everyone else, which raises the floor without moving the ceiling — a floor-raise, not a frontier-shift.
- Why the sign matters here. If AI mainly substitutes for expertise the researcher does not have, it should widen participation in discovery without accelerating the frontier. That is closer to apple-picking’s reachable zone than to human replacement. But the setting is a routine task with a known-good answer, which is the least research-like setting imaginable.
- Dates: NBER working paper 31161 issued 2023-04-20; deployment data from 2020–2021; subsequently published in the Quarterly Journal of Economics.
- Bears on: Q3 demand, Q4 expertise.
- Links: NBER w31161
- Status: verified — NBER working paper 31161 (April 2023, revised November 2023) read directly, retrieved 2026-07-26; the 14%, 34%, and 5,179 figures are quoted from its abstract. Figure 5 reproduced from the source. This supersedes an earlier
unverifiedstatus that flagged the 14% and 34% as unchecked.
Otis and co-authors: the uneven impact on Kenyan entrepreneurs (2024)
Independent (academic, randomized field experiment). 640 Kenyan small-business owners randomized to a GPT-4-powered business adviser over WhatsApp, tracked for five months. Included because it finds the opposite heterogeneity to the customer-support study, on a more open-ended task.
The paper’s Figure 3. The outcome is a standardized business-performance index. Panel A is the average treatment effect, 0.04 s.d. with a confidence interval spanning zero; panels B and C split the sample by initial performance, at −0.08 s.d. for low performers and +0.16 for high; panel D is the difference between them, 0.23 s.d. Estimates control for pre-treatment performance, time and stratum fixed effects, and covariates selected by double-LASSO.
- No average effect, and a large gap by baseline ability. The authors cannot reject a null average treatment effect on revenues and profits, but the effect for baseline low performers is nearly 0.25 standard deviations below that for high performers.
- High performers gained more than 15%; low performers lost nearly 10%. AI access actively harmed the weaker half.
- The mechanism is selection among suggestions, not different suggestions. The paper finds the divergence does not come from differences in questions asked or advice received, but from which advice entrepreneurs chose to implement. Judgement about which output to trust is the scarce complement.
- This is the single most important contrast in this section. Where the task has a checkable right answer, AI compresses the skill distribution; where it is open-ended and the user must filter, AI widens it. Research is the open-ended case. That points toward AI raising the return to expert judgement in exactly the settings this project cares about — and it is also the mechanism the METR developer RCT describes, where accepting AI output uncritically was the cost [→ METR RCT].
- Dates: five-month RCT; HBS working paper 24-042, 2024; pre-published online in Management Science 2026-07-10; a practitioner summary appeared in MIT Sloan Management Review, Summer 2026.
- Bears on: Q4 expertise, Q7 incidence.
- Links: HBS working paper PDF · HBS listing · Berkeley Haas summary
- Status: verified — full working-paper PDF read, retrieved 2026-07-26. The null average effect, the ±10%/15% subsample figures, and the selection mechanism are checked against the body; the panel values in the figure are the paper’s own printed coefficients. Figure 3 reproduced from the source. Note that the gap is 0.23 s.d. as printed in Figure 3, which the text rounds to “nearly 0.25.”
Does generative AI narrow education-based productivity gaps? (2026)
Independent (academic, randomized online experiment). 1,174 adults aged 25–45 with heterogeneous education, randomized to complete an incentivized business problem-solving task with or without a generative-AI assistant. Designed specifically to estimate the between-education-group gap, which within-firm studies cannot.
- AI closed about three quarters of the education-based productivity gap. Higher-education participants outperformed lower-education participants by 0.548 standard deviations without AI; with AI the gap fell to 0.139.
- Everyone gained, but the low-education group gained much more. So this is compression, agreeing with the customer-support study and disagreeing with the Kenya experiment.
- The compression is in task execution, not in capability. Education gaps persisted in a follow-up exercise without AI, which the authors read as AI relaxing cognitive constraints rather than transferring human capital. The distinction matters for Q4: borrowed capability disappears when the tool does.
- Design note. Conducted outside firms deliberately, because organizational selection compresses educational heterogeneity and makes within-firm estimates unrepresentative of the population gap. That is a real advantage over the other entries here, offset by the task being an artificial exercise.
- Dates: NBER working paper 34851, issued February 2026 (2026-02-13).
- Bears on: Q4 expertise.
- Links: NBER w34851
- Status: verified-abstract — all figures checked against the paper’s abstract, retrieved 2026-07-26.
Doshi and Hauser: AI raises individual creativity and lowers collective diversity (2024)
Independent (academic, peer-reviewed in Science Advances). Writers randomized to generative-AI story ideas. Included because it measures the aggregate-level cost of a tool that helps each user individually, which is the shape of the duplication problem in the discovery domains.
- Individually more creative, collectively more alike. Stories written with AI assistance were rated more creative on average, while the diversity of the resulting body of work fell by roughly 10%.
- This is the streetlight and stepping-on-toes mechanism, measured. The recombinant-innovation model predicts that shared systems concentrate search in the same regions and make researchers converge on the same suggestions [→ recombinant innovation]; XBOW’s duplicate rate is the same phenomenon in cyber [→ XBOW]. This is the cleanest experimental demonstration of it, in a domain where output diversity can be measured directly.
- Why it bears on apple-picking. Every searcher using the same model reaches for the same apples. Under apple-picking that produces duplicates and a depleting reachable zone; under task replacement it does not obviously produce anything. The prediction is shared with the recombinant model, so the evidence supports the family rather than the specific theory.
- Scope. Creative writing, not research, and diversity of stories is not diversity of ideas in a technical field.
- Dates: published in Science Advances, July 2024. The exact publication date has not been confirmed here.
- Bears on: Q5 returns, Q7 incidence.
- Links: Science Advances
- Status: unverified — the primary page is behind a bot check and could not be fetched, so the figures and the date come from secondary summaries, retrieved 2026-07-26. Do not cite until the primary is read.
Noy and Zhang: ChatGPT compresses the writing productivity distribution (2023)
Independent (academic, preregistered randomized experiment), peer-reviewed in Science. The cleanest randomized evidence that generative AI helps lower-ability workers more (Noy and Zhang 2023). It is also a case where the working paper and the published version report different figures, which the entry records rather than resolving.
- The working-paper version, in standard deviations. “In a preregistered online experiment, we assign occupation-specific, incentivized writing tasks to 444 college-educated professionals, and randomly expose half of them to ChatGPT. Our results show that ChatGPT substantially raises average productivity: time taken decreases by 0.8 SDs and output quality rises by 0.4 SDs.”
- The compression result and its mechanism, which is the Q4-relevant sentence. “Inequality between workers decreases, as ChatGPT compresses the productivity distribution by benefiting low-ability workers more. ChatGPT mostly substitutes for worker effort rather than complementing worker skills, and restructures tasks towards idea-generation and editing and away from rough-drafting.”
- The published version, in percentages and with a different sample count. “we assigned occupation-specific, incentivized writing tasks to 453 college-educated professionals and randomly exposed half of them to ChatGPT. Our results show that ChatGPT substantially raised productivity: The average time taken decreased by 40% and output quality rose by 18%.”
- The version discrepancy, recorded per this log’s rule. The March 2023 working paper reports 444 participants and 0.8 / 0.4 standard deviations; the July 2023 Science version reports 453 participants and 40% / 18%, and drops the “substitutes for worker effort” sentence from the abstract in favor of one on persistence of adoption. Cite whichever version you actually mean.
- Substitution rather than complementarity is the finding to carry forward. If AI substitutes for effort rather than complementing skill, then it should compress outcomes wherever the task has a checkable answer and do nothing for the skill itself — which is what the education-gap experiment found when it tested for retention [→ education gap]. Writing a memo is a long way from attacking an open problem, and the external-validity discount for this whole section applies with full force.
- Dates: working paper 2023-03-02, preregistered at the AEA RCT Registry; published in Science 381, 2023-07-14.
- Bears on: Q1 growth rate, Q4 expertise, Q8 benchmarks.
- Links: working paper PDF · Science
- Status: verified for the working paper, whose quotes were read from the PDF, retrieved 2026-07-26. The published figures were read from an aggregator’s record of the DOI rather than from the publisher page, which blocks automated fetching, so they are verified-abstract at one remove and should be re-checked against Science before being leaned on.
Hui, Reshef, and Zhou: freelance demand fell, and top freelancers fell hardest (2023)
Independent (academic), difference-in-differences. Employment and earnings for freelancers on a large online platform around the release of ChatGPT. It is the closest thing in the log to a measured demand effect on knowledge work, and its heterogeneity result points against the complementarity story the log’s other expertise entries suggest.
- The headline estimates, with standard errors. “Following the release, the monthly number of jobs on the platform for freelancers in more affected occupations decreases by 2% (s.e.=0.004), and total monthly compensation decreases by 5.2% (s.e.=0.016).” On the extensive margin, freelancers are “1.2 percentage points” less likely to receive any job in a given month, “which is approximately a 10% drop compared” to baseline.
- The quality gradient runs the wrong way for complementarity, and the authors are explicit. “Exploring the heterogeneity by freelancers’ employment history, we do not find evidence that high-quality service, measured by their past performance and employment, moderates the adverse effects on employment. In fact, we find suggestive evidence that top freelancers are disproportionately affected by AI. These results suggest that in the short term generative AI reduces overall demand for knowledge workers of all types, and may have the potential to narrow gaps among workers.”
- Sample and window. “We restrict our attention to the period from January 2022 through April 2023… Our final data set consists of 92,547 freelancers.” For scale: “on average, a freelancer starts a job once every three months, for an average monthly pay of $171.”
- The authors’ own horizon caveat, which should travel with the figures. “Notably, in this paper we provide novel, preliminary evidence on the short-term effects of generative AI. However, the long-term implications may be significantly different, and it is unclear how our findings extend to longer time horizons.”
- A disclosed data limitation that biases the estimate toward zero. “our sample only includes freelancers with active profiles at the time of obtaining the data, as we do not observe terminated accounts,” and they observe only “a snapshot of the freelancer pool as it was in April 2023.” Freelancers who left entirely are missing, so the measured decline is a lower bound. The direction of the bias is the log’s inference from their statement.
- Dates: CESifo working paper 10601, 2023; data window January 2022 to April 2023; published in Organization Science 35(6), 2024.
- Bears on: Q3 demand, Q4 expertise, Q7 incidence.
- Links: CESifo PDF · RePEc listing
- Status: verified — all quotes read from the CESifo working-paper PDF, retrieved 2026-07-26. The published Organization Science version was not read and its figures may differ; occupational exposure is measured by classification rather than by observed AI use.
Demirci, Hannane, and Zhu: postings for automation-prone freelance work fell 21% (2024)
Independent (academic), difference-in-differences. The companion demand-side study measured on job posts rather than on freelancer outcomes, separating text generation from image generation. Its finding about what survives is the apple-picking-shaped part.
- Both headline figures, with the comparison group and the window. “Our findings indicate a 21% decrease in the number of job posts for automation-prone jobs related to writing and coding, compared to jobs requiring manual-intensive skills, within eight months after the introduction of ChatGPT… We also find that the introduction of Image-generating AI technologies led to a 17% decrease in the number of job posts related to image creation.”
- What remains gets harder and better paid. “We show that the reduction in the number of job posts increases competition among freelancers while the remaining automation-prone jobs are of greater complexity and offer higher pay.” A residual that is more complex after the easy work is absorbed is the composition change apple-picking predicts, observed in a labor market rather than in a research domain.
- One channel is correlational and they say so. “We use Google Trends to show that the more pronounced decline in the demand for freelancers within automation-prone jobs correlates with their higher public awareness of ChatGPT’s substitutability.”
- Dates: CESifo working paper 11276, 2024; the window is the eight months after the ChatGPT release; accepted at Management Science.
- Bears on: Q3 demand, Q5 returns, Q7 incidence.
- Links: RePEc listing
- Status: verified-abstract — the quotes were checked against the CESifo record, retrieved 2026-07-26. No sample size appears in the abstract and the working-paper PDF was not opened, so do not attach a denominator to this entry.
Brynjolfsson, Chandar, and Chen: entry-level employment in AI-exposed occupations (2025)
Independent (Stanford Digital Economy Lab), administrative payroll data. The most-cited labor-market evidence on entry-level displacement, and the entry in this section with the least external-validity discount, because software developers are among the exposed occupations (Brynjolfsson, Chandar, and Chen 2025). It still measures a labor market rather than a research frontier.
- The headline, with its control and the null for experienced workers. “Using high-frequency administrative data from ADP, we document six facts characterizing labor market shifts following the widespread adoption of generative AI. Early-career workers (ages 22-25) in AI-exposed occupations experienced 16% relative employment declines, controlling for firm-level shocks, while employment for experienced workers remained stable. Adjustments occur primarily via employment rather than compensation, with employment changes concentrated in occupations where AI automates rather than augments labor. Results are robust to excluding technology firms and occupations that are remotable.”
- The automation-versus-augmentation split, which is the finding that discriminates. “Fact 3: Entry-level employment has declined in applications of AI that automate work, with muted changes for augmentation.” Their exposure measure comes from a vendor: “we use data on generative AI usage from the Anthropic Economic Index,” which “provides an estimate of the share of queries that pertain to each occupation” and classifies queries as “automative,” “augmentative,” or neither. That dependency is worth naming, since the key split rests on a vendor’s classification of its own traffic.
- The margin of adjustment. “Fact 5: Labor market adjustments are visible in employment more than compensation… The findings indicate less divergence in compensation compared to employment across more and less exposed occupations.”
- Breadth across the exposure distribution, read from their appendix figure rather than quoted. Close to 70% of occupations in the least-exposed quintile see rising early-career employment over October 2022 to September 2025, against under half in the most-exposed quintile.
- The authors’ own epistemic hedge, and their choice of the word “facts”. “These six facts provide early large-scale evidence consistent with generative AI disproportionately impacting entry-level workers in the American labor market.” The abstract says “consistent with,” not “caused by,” and the paper calls them facts rather than estimates.
- No exact sample size exists to cite. The paper reports only “monthly, individual-level payroll records through September 2025, encompassing millions of workers across tens of thousands of firms.” Do not invent a denominator for it.
- An earlier draft reported a different figure. Versions circulating from August 2025 give 13% where the November version gives 16%, so pin the version when quoting.
- How it bears on this project. The log’s Q3 gap asks for occupation-level causal evidence on security researchers, mathematicians, or ML engineers. This is not that, but it is the nearest available: an exposed-occupation set that includes software development, an age gradient, and an automation-versus-augmentation split that maps onto the task-replacement prediction. The cyber workforce survey reports the same age pattern from self-report [→ cyber labour], which is weak corroboration from an independent direction.
- Dates: version dated 2025-11-13; data window October 2022 to September 2025.
- Bears on: Q3 demand, Q4 expertise, Q7 incidence.
- Links: working paper PDF · landing page
- Status: verified — all quotes read from the working-paper PDF, retrieved 2026-07-26. Not peer-reviewed; exposure is measured from a vendor-supplied classification; and no exact worker count is published.
Aghion and co-authors: French firms that adopted AI grew (2025)
Independent (academic, peer-reviewed proceedings), difference-in-differences. Firm-level AI adoption in France. It points the opposite way from the freelancer and payroll studies above, and the reason is worth holding onto: it measures a different era of AI and a different unit.
- The whole abstract, since each of the four findings carries. “Using French firm-level data on AI adoption from 2017–2020, we find that, first, firms adopting AI are larger and more productive and skill intensive. Second, difference-in-difference estimates reveal an increase in firm-level employment and sales after AI adoption, suggesting that the induced productivity gains allow firms to grow and outweigh potential displacement effects. Third, occupations classified in recent work as substitutable with AI expand. Fourth, AI usage is a relevant dimension of heterogeneity in the labor demand response: We find positive employment growth for certain uses (e.g., information and communications technology security) and negative for others (e.g., administrative processes).”
- The scope limit is decisive and is easy to miss. The adoption window ends in 2020, so “AI” here is machine learning and analytics rather than generative models or agents. The first finding is explicitly a selection statement rather than an effect. Setting this against the 2023–2025 studies above is therefore not a contradiction to be resolved but two different technologies measured in two different periods. This point is the log’s.
- The fourth finding is the transferable one. Employment rose for security uses and fell for administrative ones, within the same firms and period. Incidence by use case rather than by occupation or firm is the cut the argument’s Q7 row wants, and this is the only entry in the log that makes it on employment data.
- Dates: adoption data 2017–2020; published in AEA Papers and Proceedings 115, May 2025.
- Bears on: Q3 demand, Q5 returns, Q7 incidence.
- Links: AEA article page
- Status: verified-abstract — the abstract checked against the AEA article page, retrieved 2026-07-26. A four-page proceedings note; the body and identification checks were not read.
Zhao and co-authors: AlphaFold barely changed who collaborates (2025)
Independent (academic). An adopter-versus-non-adopter study of structural biologists around AlphaFold, testing the common claim that AI bridges disciplines. It is here as a negative result on the composition channel, in the one domain where an AI tool has most plainly changed practice.
- The null, with its denominators. “By analyzing 1,247 AlphaFold-related papers and 7,700 authors from Scopus, we employ bibliometric analysis and causal inference to compare interdisciplinary collaboration between AlphaFold adopters and non-adopters. Contrary to the widespread belief that AI facilitates interdisciplinary collaboration, our findings show that AlphaFold increased structural biology-computer science collaborations by just 0.48%, with no measurable effect on other disciplines.”
- The mechanism they propose, which is a substitution story. “AI creates interdisciplinary collaboration demands with specific disciplines due to its technical characteristics, but this demand is weakened by technological democratization and other factors. These findings demonstrate that artificial intelligence (AI) alone has limited efficacy in bridging disciplinary divides or fostering meaningful interdisciplinary collaboration.”
- Why a null is worth an entry. If a widely-adopted AI tool democratizes a capability, the researcher who would have supplied that capability is no longer needed as a collaborator — so a null on collaboration is consistent with a large effect on practice. That reading is the authors’ mechanism, and it is the same shifting-rather-than-rising pattern the argument’s Q4 row reports across all three domains.
- Dates: arXiv 2025-08-18 (v2 2025-10-27).
- Bears on: Q3 demand, Q4 expertise, Q7 incidence.
- Links: arXiv 2508.13234
- Status: verified — abstract, authors, and dates checked against the arXiv listing, retrieved 2026-07-26. The abstract asserts causal inference without naming a design, and the body was not read, so treat the identification as quasi-experimental at best.
Syntheses assembled here
Four cross-cutting comparisons that no single source supplies, assembled from the entries above so that the argument and a later reader can cite them once instead of rebuilding them. Every entry in this section carries the derived status: nothing in it is quoted as though a source had said it, every input is named by anchor, and each is reproducible from those inputs. Two further derived entries sit with the material they are built from: the comparison of efficiency rates across domains, with the aggregate measures [→ efficiency rates], and the exponent-bound series extracted from ANTEDB, now in the math document [→ ANTEDB rates].
Four of them exist because the same defects recur across a hundred-odd entries and are invisible one entry at a time. A cost figure means nothing without knowing what the comparable figures are; an autonomy claim means nothing without knowing what the word covered in the other cases; a rate means nothing without a denominator, and most of the rates here do not have one.
Inventory of the 67 AlphaEvolve problems, as the frame for a historical baseline (2026)
This log’s synthesis. Not a source: an inventory built here from the AlphaEvolve mathematics paper and its companion repository [→ AlphaEvolve mathematics], so that the historical baseline the known gaps ask for can be built on a stated frame rather than on whichever problems turned out to be convenient. It answers the prior question — which of these problems even has a record history to compare against — and extracts whatever history the paper already carries.
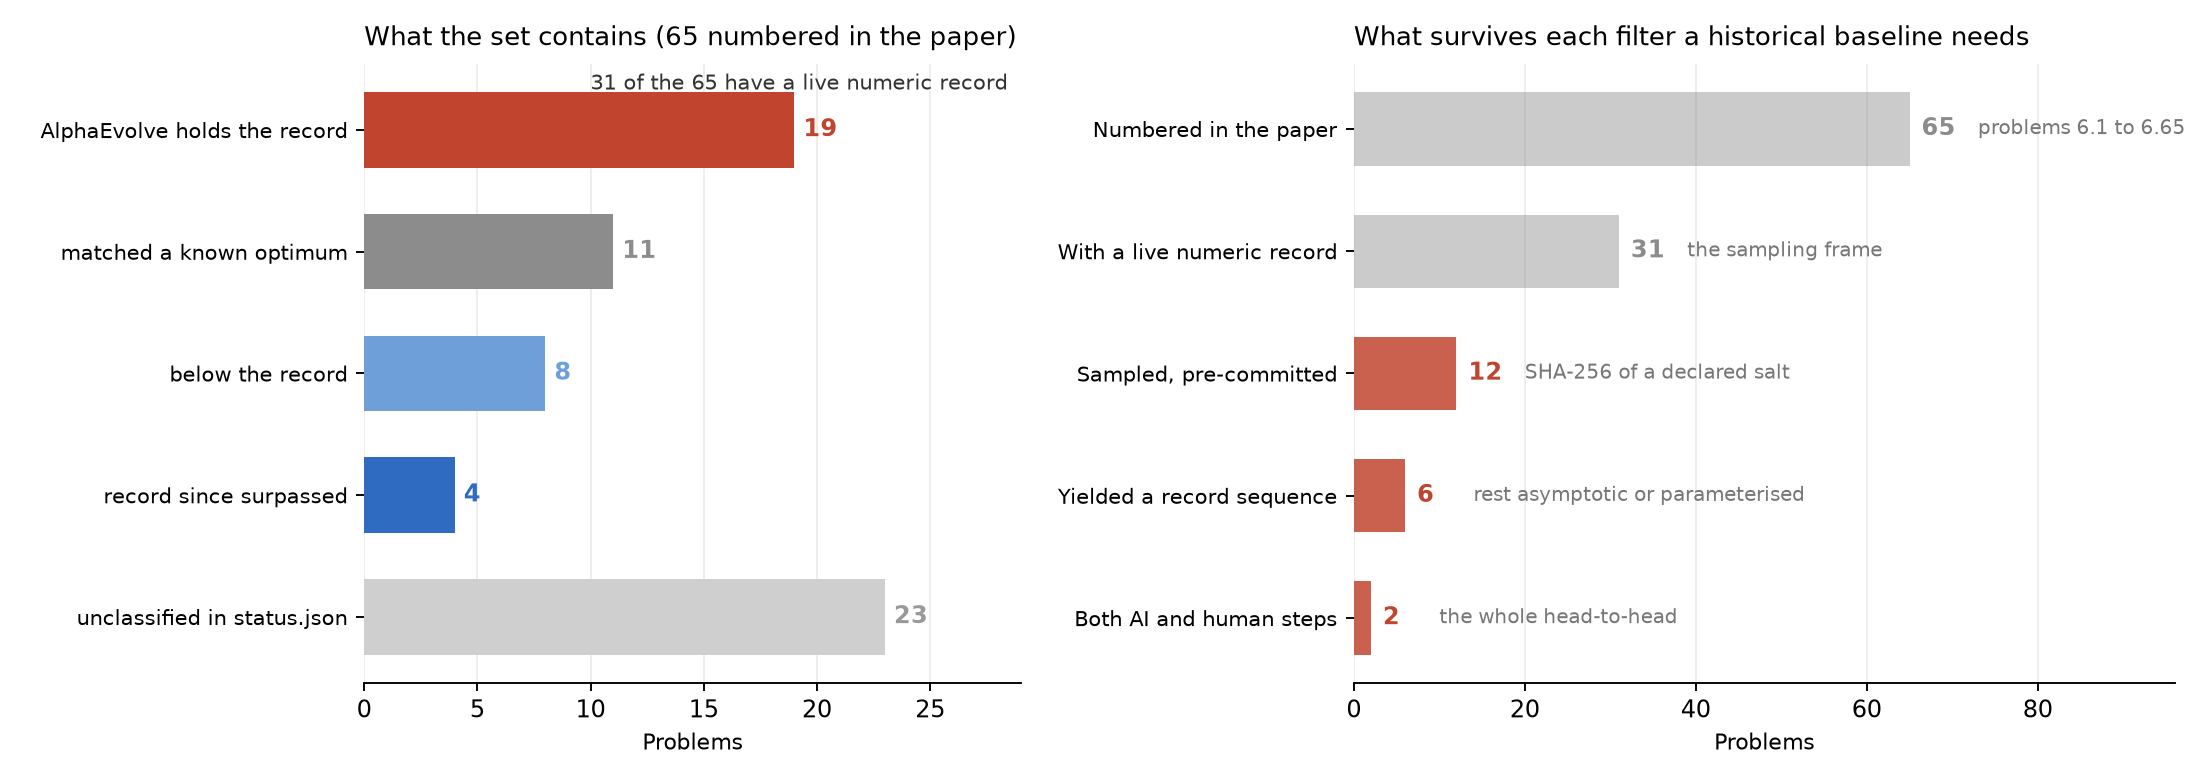
Left: the repository’s own status.json classification, applied to the 65 problems the paper numbers under the assumed index mapping described below. The 31 problems in the first, third and fourth categories are those with a live numeric record; the matched-optimal group has a terminated history and the unclassified group is mostly conjectures and non-record tasks. Right: the same set after each filter needed to compare an AI record step against the historical steps on the same quantity, ending at the two quantities where both exist [→ record steps]. Counts computed here from the two named inputs.
- A prior-art search found nobody had done this. The nearest miss is HorizonMath, a benchmark of over 100 unsolved problems with automated verification, which compares AI output to best-known published results and carries no historical dimension [→ HorizonMath]. Dated record tables exist per problem — Packomania and Erich’s Packing Center for packings, Radziszowski’s Small Ramsey Numbers dynamic survey, the well-known tabulation of the matrix-multiplication exponent — and MathBases indexes roughly 400 such databases, but no one has joined them to the AI results. A general statistical literature on record progression exists for sports, biology and technology and does not cover mathematics. So the data and the method both exist and have not been put together.
- The paper’s authors decline the historical survey explicitly, which is why it is missing. Their stated reason: “For reasons of space, we do not attempt to exhaustively survey the history of each of the problems listed here, and refer the reader to the references provided for each problem for a more in-depth discussion of known results.” The references are therefore the intended route to the history, and this inventory follows it.
- How it was built. The data repository’s
alphaevolve_inventory.pyreads a localpdftotextextraction of the paper plus a checkout of the companion repository, locates each problem’s definition inside the paper’s problem section, and records its title, topic group, the bracketed references cited within its span, the publication year of each of those references from the parsed bibliography, any inline bound string, and the repository’s status classification. Output is canonical in the data repository and vendored here atproblems/math-alphaevolve-inventory/alphaevolve-inventory.csvin the data repository. Neither the paper nor its text is redistributed here. - The frame is 65 numbered problems, not 67, and roughly 50 distinct ones. The paper defines problems 6.1 to 6.65, while the repository’s
status.jsonindexes 1 to 67, so the two enumerations cannot be identical and the identity mapping is an assumption every row records as such. Separately, at least twelve of the repository’s 67 experiment directories are the same problem under two names. Counted here. - Only about half the problems have a live record to compare against. Under the assumed mapping the statuses come out as 19 where AlphaEvolve holds the record, 11 where it matched a known optimum, 8 where it fell below the record, 4 where its result has since been surpassed, and 23 unclassified. The 31 in the first, third and fourth groups are the ones with a live numeric record; the matched-optimal group has a terminated history and the unclassified group is mostly conjectures and non-record tasks. So the sampling frame for a baseline is about 31 problems.
- Most of the last one to three record steps are already dated, which was the surprise. Of the 65 problems, 63 cite at least one dated reference, 52 cite at least two, and 30 cite at least four; the bibliography yields 302 entries of which 298 carry a year. Spot-checked against problems whose histories are known independently: the Sidon autoconvolution problem returns 2010 and 2017, matching the Matolcsi–Vinuesa and Cloninger–Steinerberger attributions its own notebook gives, and the classic moving sofa returns 1992 and 2024, matching Gerver and Baek. Among problems citing two or more dated works the median span between earliest and latest cited year is 36 years, so these are decades-deep literatures rather than fresh ones.
- What the dated citations are not. A cited year is the year of a cited work, not of a record improvement on that problem’s quantity: background references, surveys, and method papers are mixed in with the papers that moved the bound. Separating them requires reading the cited papers, which is the manual step this inventory scopes rather than performs. Nothing in the CSV should be read as a record sequence.
- Two design constraints the inventory makes visible. First, the sample must be drawn from the 31-problem frame before the answers are looked at, because tractability correlates with being well-curated and so with progress rate — the selection warning this log quotes against itself applies with full force here [→ Grace]. Second, for the packing problems the historical baseline is itself computer search: record improvements have been machine-generated since the 1990s and many are unpublished, with Packomania reporting improvements arriving daily. On those problems an AI-versus-history comparison is automated-versus-automated, so whether each prior record was human-proved or machine-found has to be coded per problem or the headline comparison means nothing. Both points are this log’s.
- Dates: the paper is arXiv 2025-11-03, and the extraction used v3 dated 2025-12-22; the repository was read at its state of 2026-07-26; the cited works span 1898 to 2025 and the inventory was built 2026-07-26.
- Bears on: Q1 growth rate, Q7 incidence, Q8 benchmarks.
- Links: built by the data repository’s
alphaevolve_inventory.pyfrom arXiv 2511.02864 and the companion repository; the CSV is vendored atproblems/math-alphaevolve-inventory/alphaevolve-inventory.csvin the data repository. - Status: derived — every field is computed by the named script from the two named inputs and is reproducible from them; nothing is quoted as though a source had said it, apart from the authors’ own sentence declining the historical survey, which is quoted verbatim. Two extraction bugs were found and fixed during construction and are recorded because they would have corrupted the output silently: cross-references to a problem occurring before its definition caused the preceding problem’s span to swallow its content, and the topic-group headings were only partly matched so group labels drifted forward. Both were caught by checking two problems whose histories are known independently, which is the check to repeat if the script is changed.
AI record steps against human steps on the same quantities (2026)
This log’s synthesis. Not a source: dated record sequences built here for the AlphaEvolve problems, so the AI-era step can be set against the historical steps on the same quantity. This is the comparison the discussion of that paper does not contain. It was built in two stages: a pre-committed sample of twelve problems, transcribed from the paper’s own prose on 2026-07-26, and a frame-completing extension of the remaining twelve record-status problems, researched from the primary literature on 2026-07-28.
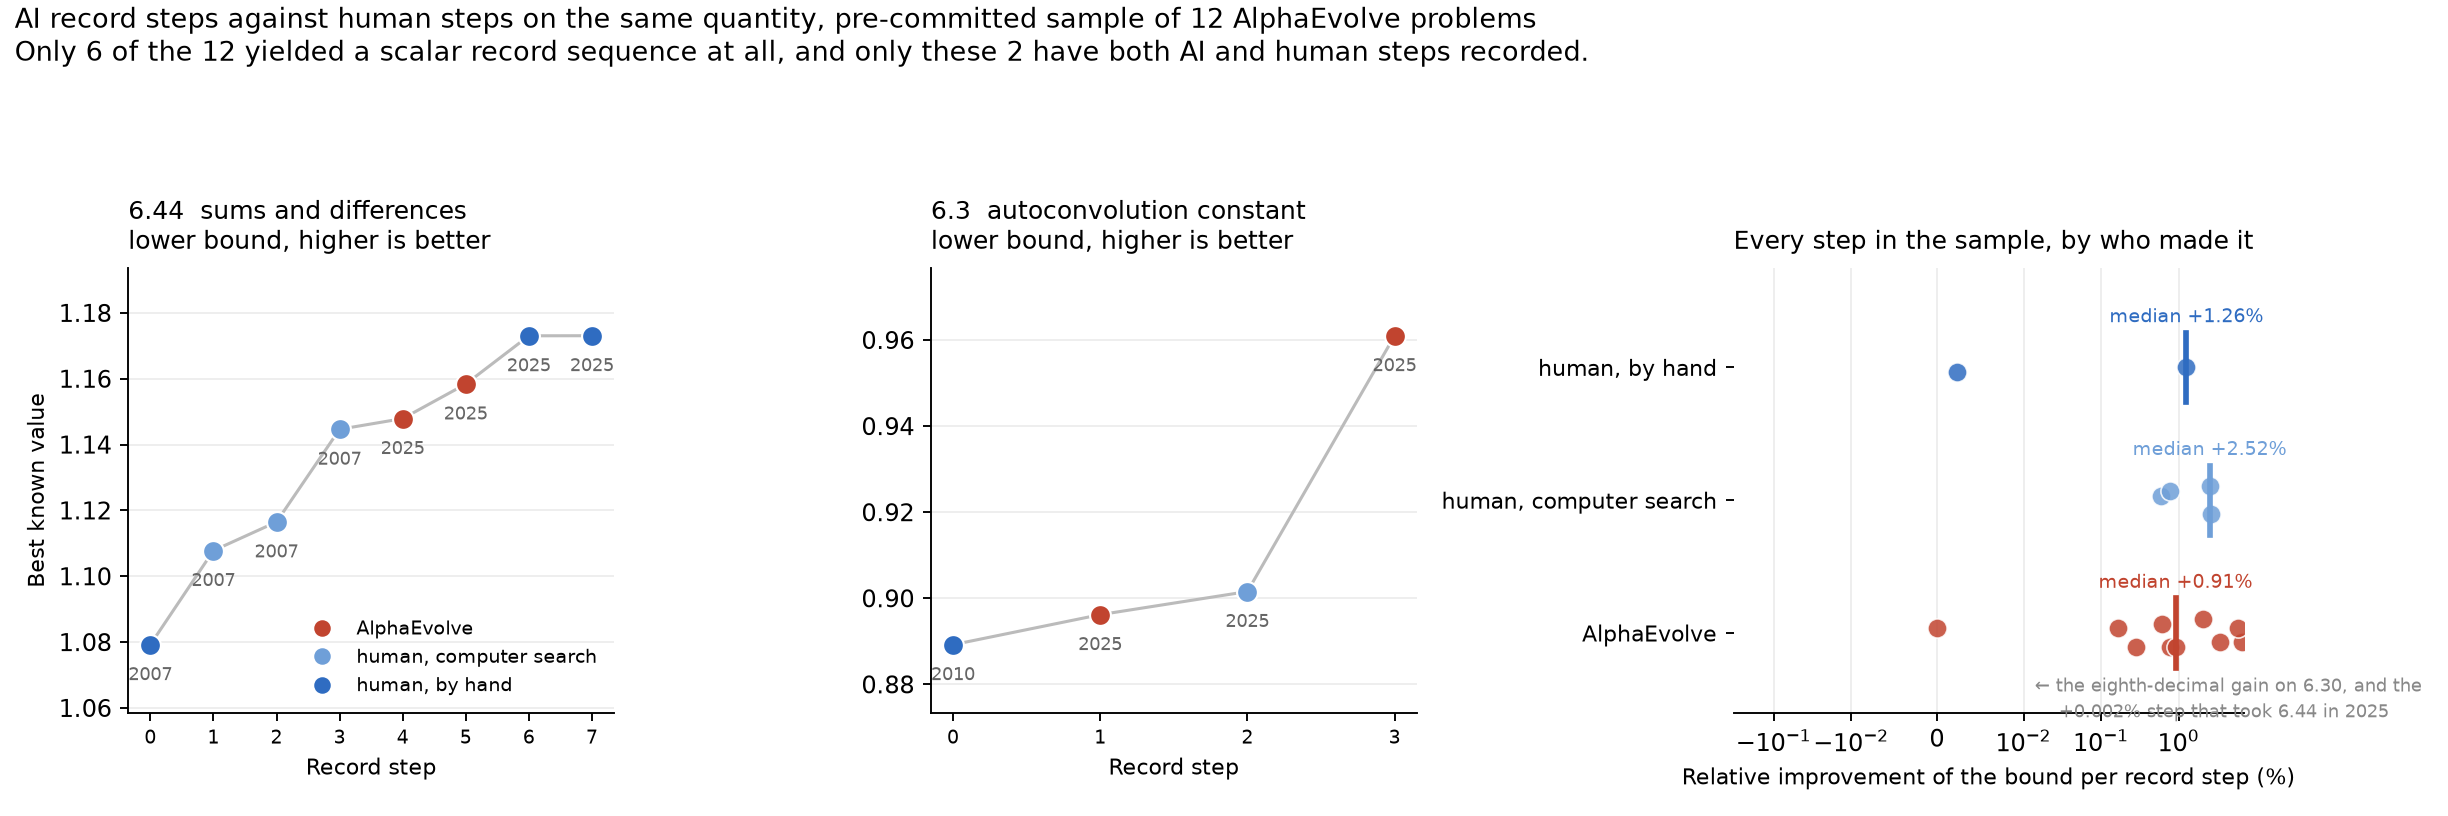
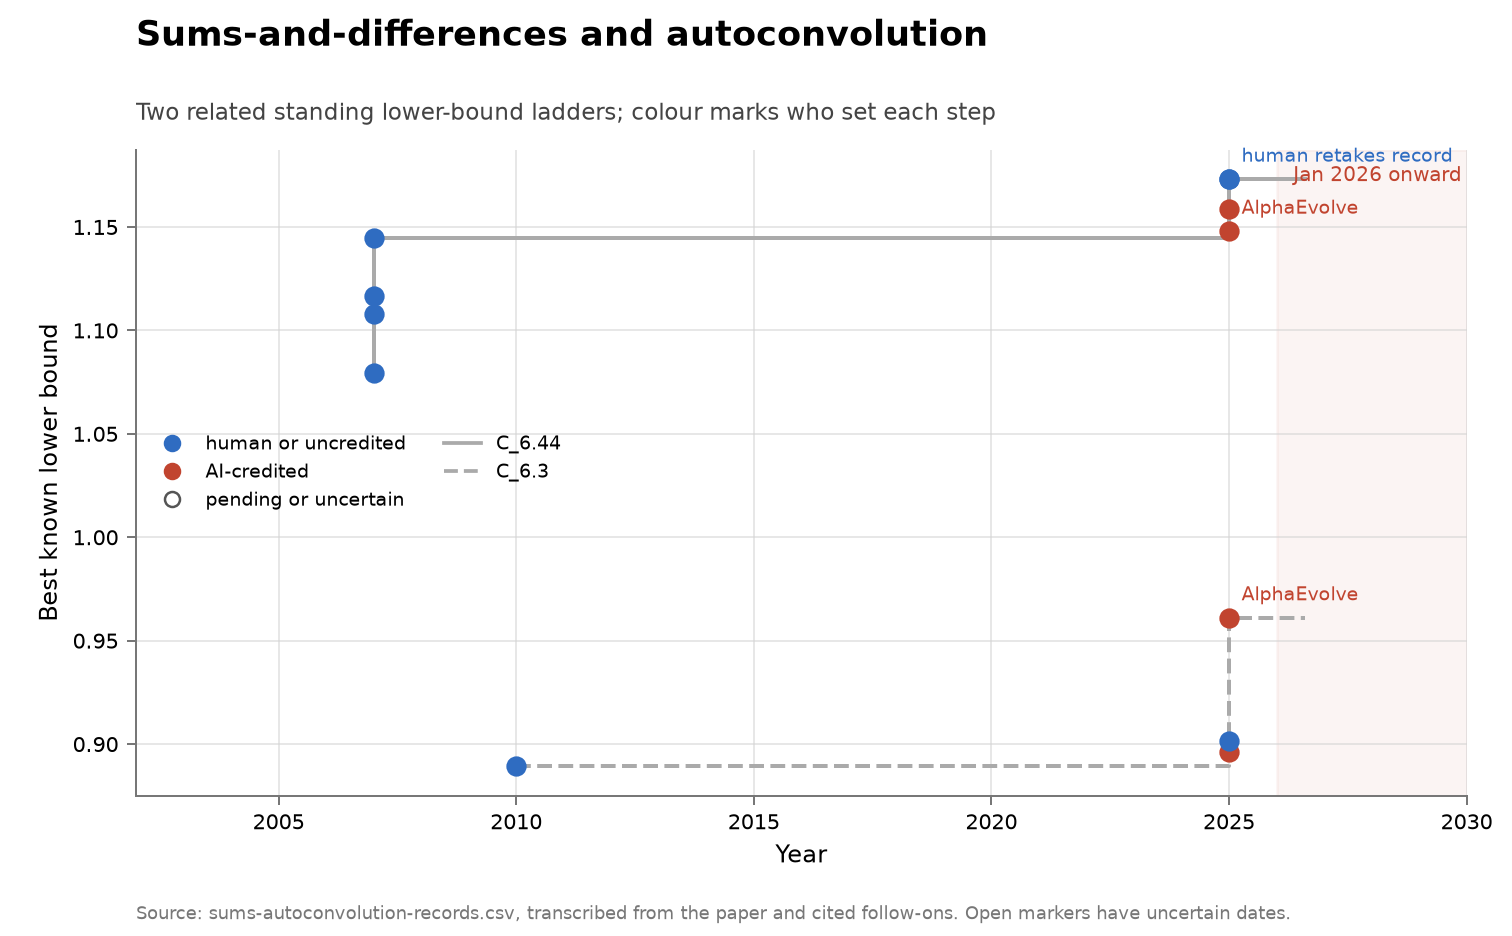
The three sequence panels plot the best known value against record step, not against year, because several steps share a year; marker colour is who made the step and each point is annotated with its year. The right panel pools every record step in the frame with a computable size — steps that improved a value the paper cited but not the actual standing record are excluded — with the vertical bar at each group’s median. Values are transcribed from the sources named per step in the vendored CSV; the agent coding and the medians are this log’s.
- How the pre-committed sample was drawn, before any values were read. The frame is the 31 problems whose status is
world_record,worse_than_recordorformer_record— those with a live numeric record [→ AlphaEvolve inventory]. Twelve were selected as the smallest SHA-256 digests of a declared salt joined to the problem label, a rule anyone can recompute: 6.1, 6.3, 6.4, 6.9, 6.10, 6.30, 6.35, 6.36, 6.38, 6.40, 6.42, 6.44. The draw happens to contain all fourformer_recordproblems, so already-surpassed problems are over-represented about two and a half fold; it is kept rather than redrawn, because redrawing on inspection is the thing pre-commitment exists to prevent. - The frame was completed on 2026-07-28. The twelve remaining
world_recordandformer_recordproblems — 6.2, 6.5, 6.7, 6.8, 6.32, 6.48, 6.49, 6.50, 6.59, 6.60, 6.61, 6.64 — were researched from the primary literature: the papers the AlphaEvolve paper cites, the community record tables it relies on, and the post-2025 sources that moved the records afterwards. Every step carries its source quote and link in the CSV’s note field. The protection against selection here is completion rather than sampling: nothing was left out, so nothing could be picked. The extension was assembled after the AI results were known, which is why the two stages are kept distinct in the script and should be quoted as such. - Half the pre-committed sample has no scalar record sequence, and that finding stands. Six of the original twelve could not be reduced to a dated series of numbers (asymptotic bounds, parameter families, values living in a repository, or no AI improvement to place). The extension’s twelve all yielded sequences, which is not a contradiction: the extension covered only record-status problems, where a scalar record is close to definitional. Across the full frame, every record-status problem now has either a dated sequence or a documented reason none exists.
- Head-to-heads are no longer two quantities but twelve. Quantities carrying both AI and non-AI steps: 6.3, 6.44, 6.2, 6.5, 6.7, 6.8, both 6.50 slices, both 6.59 grids, 6.61’s lower bound, and 6.64. In eight of the twelve, the AI step is smaller than the human steps on the same quantity; the exceptions are 6.3 (after seeing a competitor’s method), 6.7 (after being handed the key construction), and the two 6.50 slices, where the “human” steps it beats are a solver’s last-decimal refinements of the AI’s own value. Computed here from the vendored series.
- The pooled medians, over the completed frame. Per record step with a computable size: +0.98% for AlphaEvolve against +2.52% for human computer search and +2.83% for human work by hand; the transformer-guided PatternBoost steps run +3.90% and the collective agent platform’s kissing-number gain +1.85%. On the pre-committed sample alone the figures were +0.91%, +2.52% and +1.26% — the AI median barely moves with triple the data, and the human medians stay above it. With n=28 AI steps and n=22 human steps these are still small samples; the safe claim remains “the same order of magnitude, with the AI steps somewhat smaller.”
- The extension found two cases where the paper’s claimed improvement was not one, and they are the sharpest thing in this entry. On the spherical designs (6.32), AlphaEvolve reports constructions that “improved on the literature bounds” it cites — Sloane’s library, 204 and 240 points — but Womersley’s symmetric spherical designs of 2016, which the paper does not cite, already gave 192 and 234 points: AlphaEvolve’s 198 is worse than the standing record at t=19 and its 234 a tie at t=21, and both sit at looser numerical tolerance than Womersley’s. Those two steps are flagged
is_record: noin the CSV and excluded from the medians. A record claim is only as good as the literature search under it, and the one systematic check this log has run found the search missing a 2016 result. - Both 6.50 records fell to an off-the-shelf solver within a month. FICO ran its Xpress global solver — by its own account with no custom algorithm — and beat AlphaEvolve’s max-min-ratio values on both slices, verified with DeepMind’s own tool; the paper acknowledges one of the two (“The latter was later improved further in [25]”). A record an unmodified commercial solver retakes in weeks says more about how contested the quantity was than about discovery.
- One stated prior bound was stale and one was mistranscribed. The paper presents 19/14 as the standing Ring Loading upper bound, but Däubel had already proved 1.3 in 2019 — the AI step was on the lower bound, where the prior record was genuine, so the result stands but the paper’s context does not. And its stated prior autoconvolution bound of 1.50992 matches no source found; the primary and the earlier white paper both give 1.5098. Both found by going primary on 2026-07-28.
- The deepest-looking record fell only with the key handed over. The difference-basis constant (6.7) had stood since Golay, 1972 — 53 years, the oldest record with an AI step anywhere in this log. But the paper itself reports AlphaEvolve “was not able to beat the 2.6571 upper bound” unaided; the improvement came after it was given working Singer difference-set code. The 53-year headline and the dependence on the human hint belong in the same sentence. A residual discrepancy — one secondary source states Golay’s bound as 2.6458 rather than 2.6571 — is recorded in the CSV and unresolved against the paywalled 1972 primary.
- The kissing number’s post-AI history now runs through a collective agent platform. After AlphaEvolve’s 593 (2025), Cohn’s records table (as of 2026-06-22) lists 604 in dimension 11, credited to a collective AI-agent platform; Ganzhinov’s peer-reviewed constructions meanwhile beat AlphaEvolve in dimensions 10 and 14 but not 11. So the one quantity here with a half-century of dated human steps ended up contested between two kinds of AI system, which is a different picture from AI-versus-human.
- A human took back the record on 6.44 within months, in a paper titled after doing so. The sequence ends with two human improvements above AlphaEvolve’s 1.1584, the first by Gerbicz, whose cited title is “Sums and differences of sets (improvement over AlphaEvolve).” On the one pre-committed quantity with a real contest, insight-led human work overtook search-led AI work, and the paper records it.
- On 6.3 the two approaches leapfrogged, and the AI’s larger step came after seeing the human’s. Prior bound 0.88922; AlphaEvolve 0.8962 in “a quick experiment”; Boyer and Li independently 0.901564 by gradient methods; then, in the authors’ words, “Seeing this result, we ran our experiment for a bit longer,” reaching 0.961. The largest AI step in the frame was taken with knowledge of a competitor’s method.
- Some of the “human” baseline is itself AI, which the coding now records. The 2024 baselines on the grid problems (6.59, 6.60) were set by PatternBoost, transformer-guided search that the AlphaEvolve paper itself calls “an AI-assisted computer search”; those steps carry their own agent code rather than being counted as human. The AI-versus-human comparison is not binary at the frontier of these problems, and pooling PatternBoost either way moves the human median.
- Several steps are explicitly compute-bounded rather than idea-bounded, in the authors’ own words. On 6.3, “We believe that with even more parts, this lower bound can be further improved.” On 6.42, the construction “can likely be improved further.” On 6.35, it “can likely still be improved slightly by manual analysis.” And on the circle packing problem the authors generalize the point: “the problem allows for continued numerical refinement, where further gains are largely a function of computational investment.”2 On these quantities “who holds the record” is a statement about who last spent compute, not about who understands the problem best.
- The provenance of the human baseline is often not a paper. Several prior records live on Erich Friedman’s packing pages, whose “+” convention truncates values — slightly understating prior records and therefore slightly overstating AI gains — and one of which now shows AlphaEvolve’s value for Heilbronn n=13 while still crediting Cantrell 2007, so page and paper disagree about who holds it. One step is cited with literal
[YEAR]and[DATE]placeholders unfilled; another rests on a MathOverflow thread whose baseline volume was added in a later edit. For a substantial share of these quantities the historical baseline is a community leaderboard maintained by continuous computer search, which is the confound the inventory flagged, now confirmed across the frame. - What would still make this stronger. The eight
worse_than_recordproblems outside the pre-committed draw and the elevenmatched_optimalproblems are not baselined — the former have no AI record step to place, the latter’s histories terminated at a proven optimum, so both were excluded by design, but their step-size histories would thicken the human distribution. And four extension steps still carry uncertain dates (date_certain: no), including the 1977 kissing-number step whose first explicit statement could not be pinned. - Dates: the record steps span 1949 to 2026; the pre-committed sample was drawn and transcribed 2026-07-26; the frame extension researched and added 2026-07-28.
- Bears on: Q1 growth rate, Q4 expertise, Q5 returns, Q7 incidence.
- Links: built by the data repository’s
alphaevolve_records.py; sample values transcribed from arXiv 2511.02864; extension steps carry their source quote and link per row; the CSV is vendored atproblems/math-alphaevolve-records/alphaevolve-records.csvin the data repository. - Status: derived — every value is transcribed from a named source, with the quoted sentence and reference recorded against each step in the script and CSV, so each is checkable; the agent coding, the
is_recordflags, the relative gains and the medians are this log’s. Structural limits: the paper is the sole source for the pre-committed sample’s values, so a step it failed to mention is invisible there; the extension corrects for that by going primary, and in doing so found the two non-record claims, the stale bound, and the transcription slip recorded above.
2 The full passage is worth having, because it is a vendor describing a race with no ceiling: “In our initial work, AlphaEvolve found new constructions improving these bounds. To adhere to the three-digit precision established in [129, 128], our publication presented a simplified construction with truncated values, sufficient to secure an improvement in the third decimal place. Subsequent work [25, 94] has since refined our published construction, extending its numerical precision in the later decimal places. As this demonstrates, the problem allows for continued numerical refinement, where further gains are largely a function of computational investment. A brief subsequent experiment with AlphaEvolve readily produced a new construction that surpasses these recent bounds.”
Every rate in the log that has a denominator (2026)
This log’s synthesis. Not a source. The log’s first standing rule is to prefer a denominator to a headline, and this is the inventory of where one exists. It is the fastest way to see that the yields cluster low and that the highest-looking figures are the ones measured on the most artificial task.
- How it was built. Every entry above was read for a claim of the form “N of M” or an explicit percentage with a stated base; those are collected here with their anchors. Figures without a base are excluded by construction, which is why several of the log’s most-quoted results do not appear. Nothing here is quoted; each figure lives in its own entry with the source’s wording.
- Open research problems, formal proof. 9 of 353 open Erdős problems, about 2.5%, and 44 of 492 OEIS conjectures, about 9% [→ AlphaProof Nexus]. Of roughly 47 AI-standalone Erdős contributions, about 13 full resolutions and about 9 incorrect [→ Erdős wiki].
- Competition mathematics. 25 of 30 olympiad geometry problems, against 25.9 for the average gold medalist [→ AlphaGeometry]; 84% of 25 years of geometry problems, up from 54% [→ AlphaGeometry 2]; 5 of 6 IMO 2025 problems as a vendor claim [→ Aristotle]; 5 of 6 for the graded gold [→ IMO 2025].
- Vulnerability discovery and exploitation. 54 of 63 planted vulnerabilities found and 43 patched, with 18 real zero-days and 11 patches [→ AIxCC]; about 132 confirmed-and-resolved of about 1,060 submissions, with about 208 duplicates [→ XBOW]; about 20% reproduction on 1,507 vulnerabilities [→ CyberGym]; 13 of 15 one-day CVEs with the description and about 1 of 15 without [→ Fang one-day]; 9 valid vulnerabilities at an 82% valid-submission rate, second of eleven [→ ARTEMIS]; 15.6 of 32 attack steps at the highest budget, and 1.2–1.4 of 7 on the industrial range [→ AISI cyber].
- Software and ML engineering. 1.96% of 2,294 GitHub issues at launch [→ SWE-bench]; bronze-medal level in 16.9% of 75 Kaggle competitions [→ MLE-bench]; a 21.0% average replication score on 20 ICML papers [→ PaperBench]; 21% on the hardest of 270 reproducibility tasks [→ CORE-Bench]; under 5% success on 102 optimization tasks [→ GSO]; 0.23× of expert speedup on 498 tasks [→ SWE-fficiency]; 1 of 3 autonomous manuscripts above a workshop threshold [→ AI Scientist-v2]; 47.6% wins-or-ties on a 220-task subset [→ GDPval].
- The pattern, which is this log’s reading and not any source’s. Where the task is a fixed set of real problems and the denominator is published, the yield is almost always under a quarter, and often under a tenth. The exceptions are competition mathematics, where problems are constructed to be solvable in hours, and the one-day exploitation case, where the human-written description supplies the localization. Both exceptions are informative about what makes a task tractable rather than counterexamples to the pattern.
- What the inventory cannot do. These denominators are not commensurable. A planted synthetic bug, an open Erdős problem, and a Kaggle competition differ in difficulty by an unknown amount, so the figures cannot be averaged or ranked across rows. The inventory establishes the order of magnitude of published yields and the fact that most entries have no denominator at all, nothing finer.
- Dates: assembled 2026-07-26 from entries dated 2016 to 2026-07.
- Bears on: Q1 growth rate, Q2 autonomy, Q5 returns, Q7 incidence, Q8 benchmarks.
- Links: every input is an entry in this document; the external links are on those entries. Assembled by hand rather than by script, so a reader re-checking it should re-read the named entries (validator checks anchors resolve, not arithmetic).
- Status: derived — every figure is quoted in the entry it comes from, and this entry quotes nothing itself.
Every cost-per-result figure in the log (2026)
This log’s synthesis. Not a source. Cost per result is the most-quoted number in this literature and the least comparable, and Bloom and co-authors argue it is the wrong measure in principle [→ ideas harder to find]. This entry collects the figures so the range is visible and the objection can be applied to all of them at once.
- How it was built. Every dollar-denominated figure in the log, with what it is denominated per. Vendor figures are marked, because most of them are vendor figures.
- Per confirmed vulnerability or exploit. About $152 per competition task [→ AIxCC]; $12,500 per attempt at a 100M-token budget, $125k for ten runs [→ AISI runs]; a 27-year-old OpenBSD bug at under $20,000 across about 1,000 scaffold runs, with the single successful run under $50, and FFmpeg vulnerabilities at roughly ten thousand dollars over several hundred runs, all vendor-reported [→ Mythos]; a full root exploit from a known vulnerability at under $1,000 and half a day, vendor-reported [→ Mythos]; about $42,000 per bug implied by a contested deployment report [→ Palo Alto]; detection of a showcased overflow by a model priced at $0.11 per million tokens [→ AISLE].
- Per hour of work. $18 an hour for some agent variants against $60 an hour for professional penetration testers [→ ARTEMIS].
- Per mathematical result. A few hundred dollars per resolved open Erdős problem, with the full system saving 2× to 5× over a basic verify-and-retry loop on the hardest cases [→ AlphaProof Nexus].
- Per algorithmic or research artifact. A hard $1 per task cap, under which only surface-level optimizations appeared [→ AlgoTune]; a few hundred dollars of test-time compute for state-of-the-art kernels, with the accounting unresolved [→ TTT-Discover]; under $15 per generated paper, judged by the authors’ own automated reviewer [→ AI Scientist]; $50,000 in model credits per team from each of three labs for the AIxCC final [→ AIxCC].
- The range is about six orders of magnitude, and that is the finding. From $1 per optimization task to about $42,000 per bug. This log’s reading: the spread is set almost entirely by the difficulty and realism of the target, not by the price of tokens, so a cost-per-result figure is a statement about the task and only incidentally about the system. Two figures from the same vendor post differ by more than two orders of magnitude depending on whether failed runs are counted [→ Mythos], which is the clearest single demonstration.
- Why none of these measures returns, stated by the source that says it best. Bloom, Jones, Van Reenen, and Webb: ideas per research dollar is predicted to decline by essentially every idea-driven growth model, so “these natural measures are not really informative about whether research faces constant or diminishing returns” [→ ideas harder to find]. The theory-relevant object is ideas per researcher. Every figure above is the disqualified measure.
- What a usable version would need. All attempts counted, not only successful ones; a fixed target population; and the human cost of choosing the target and verifying the output included. One entry approaches this by reporting cost against solve rate at a fixed problem [→ AlphaProof Nexus]; nothing else does.
- Dates: assembled 2026-07-26 from entries dated 2020 to 2026-07.
- Bears on: Q1 growth rate, Q5 returns, Q6 intertemporal, Q8 benchmarks.
- Links: every input is an entry in this document, and the external links are on those entries. Assembled by hand; the four source documents are the only reference needed to re-check it.
- Status: derived — every figure is quoted in the entry it comes from, and this entry quotes nothing itself.
What “autonomous” turned out to mean, case by case (2026)
This log’s synthesis. Not a source. Q2 asks whether AI can produce a complete result with no human driving it, and nearly every entry claiming so means something different by it. This is a coded ladder, applied to the log’s autonomy claims, so that the question can be asked at a fixed rung instead of re-litigated per case.
- How it was built. Five rungs, defined below, then each of the log’s autonomy claims assigned to the highest rung its own entry supports. The assignment is this log’s judgment about what the entries say, not a claim by any source, and a reader who reads an entry differently should move it.
- Rung 1, execution on a specified subproblem. The human states the problem, supplies the localization, and verifies. The exploitation results with the CVE description in hand are here, and the twelvefold drop when the description is withheld is the measurement of how much rung 1 was contributing [→ Fang one-day]. Benchmark scores are almost all rung 1 by construction, because a benchmark supplies the target [→ Naptime for the authors saying so].
- Rung 2, search within a human-built harness on a human-chosen target. The model does not know the answer, but an expert built the scaffold and the verifier. Most of the log’s strongest results sit here: the kernel records [→ TTT-Discover], the evolutionary coding results [→ AlphaEvolve, FunSearch], the formal proof searches [→ AlphaProof Nexus, Aristotle], the leaderboard records [→ nanogpt], and the pre-LLM systems that show this rung did not require language models [→ Cyber Grand Challenge, AlphaTensor and AlphaDev].
- Rung 3, unaided discovery on a target class, with human verification after. The system finds something nobody had specified, and an expert confirms it. Big Sleep’s twenty open-source bugs, with a human only in final review, and the live SQLite zero-day are here [→ Big Sleep], as are the AIxCC finalists’ 18 real zero-days [→ AIxCC] and CyberGym’s incidental 34 [→ CyberGym].
- Rung 4, a complete result the field accepts, on a problem the field cared about. The unit-distance disproof is the log’s clearest case, and it is unusual in that the model was reportedly not specialized, not scaffolded for proof search, and not aimed at the problem [→ unit-distance]. Erdős #728 is a weaker instance, hedged by an operator-in-the-loop convention [→ Erdős 728]. One autonomously generated manuscript above a workshop acceptance threshold is a rung-4 claim about a much lower bar [→ AI Scientist-v2].
- Rung 5, choosing what to work on. No entry in this log reaches it. Every case above has a human selecting the target, the problem class, or the corpus. The log records no instance of a system choosing a research agenda and being judged to have chosen well.
- What the ladder shows, and it is the log’s reading. The autonomy claims cluster at rung 2, the headline claims that travel furthest are rung 3 and 4, and the gap between rungs 2 and 4 is almost entirely a question of who supplied the verifier and who chose the target — not of what the model did inside the loop. That is why the argument’s closing caveat, that autonomous almost always means autonomous execution, is the right reading, and it is also why “autonomous” in a vendor headline cannot be compared across entries without doing this coding first.
- Where the coding is contestable. Rung 4 for the unit-distance result rests on the vendor’s account of what the model was and was not given, which no outside party can check [→ unit-distance]. The rung-3 cases rest on how much the human final review contributed, which is nowhere itemized. Both are the log’s assignments and both could move a rung on better information.
- Dates: assembled 2026-07-26 from entries dated 2016 to 2026-05.
- Bears on: Q2 autonomy, Q4 expertise, Q8 benchmarks.
- Links: every input is an entry in this document, and the external links are on those entries. Nothing here is quoted from a source; the rungs are this log’s construction.
- Status: derived — an assignment of the log’s own entries to categories the log invented, reproducible from those entries and quoting nothing.
The randomized and quasi-experimental evidence, in one place (2026)
This log’s synthesis. Not a source. The log’s evidence ranking puts randomization at the top, and only a handful of entries qualify. Collected here because they disagree about sign, and because the disagreement is structured rather than noisy — which is more useful than any one of them.
- How it was built. Every entry whose design randomizes AI access or exploits a plausibly exogenous rollout, with its sign, setting, and sample. Effect sizes are quoted in the entries, not here.
- Randomized, positive, on constructed tasks. Writing tasks, about 450 professionals, large positive with compression toward lower-ability workers [→ Noy and Zhang]. An HTTP-server implementation, about 35 completers per arm, 55.8% faster with a 21–89% interval and a null on success rate [→ Copilot RCT]. A business problem-solving exercise, 1,174 adults, about three quarters of the education gap closed [→ education gap]. Consulting tasks, 758 consultants, positive inside the frontier and 19% worse outside it [→ jagged frontier].
- Randomized, negative or null, on real work. Real issues on the contributors’ own mature repositories, 16 developers and 246 issues, 19% slower [→ METR RCT]. A security-related programming task, 159 developers, no significant effect on code security and experience not substitutable [→ Gemini and developer experience]. Kenyan small-business owners, 640 firms, null on average and negative for initial low performers [→ Kenya].
- Randomized, positive, pooled across firms. Three trials at three firms, 4,867 developers, about 26% more completed tasks — and this log has not verified it against the working paper [→ pooled RCTs].
- Quasi-experimental, on rollouts and thresholds. Staggered deployment to about 5,000 support agents, 14% average and 34% for novices [→ support agents]. A Copilot eligibility discontinuity, 187,489 developers, composition shifted toward coding and away from project management [→ Copilot composition]. Freelance platform difference-in-differences, 92,547 freelancers, employment and compensation down and top freelancers hit hardest [→ freelancer demand]. Job postings, automation-prone categories down 21% [→ posting demand]. Payroll records, entry-level employment in exposed occupations down 16% [→ canaries]. French firms 2017–2020, employment and sales up [→ French firms].
- The structure of the disagreement, which is this log’s reading. Sign tracks two things. It tracks the quality of the starting point: gains are positive on constructed or unoptimized tasks and zero-to-negative on mature repositories with high standards, which is the same collapse the optimization benchmarks show [→ SWE-fficiency, GSO]. And it tracks whether the task has a checkable answer: where it does, AI compresses the skill distribution; where the user must judge which output to trust, it widens it. Both patterns are established by randomization, in different studies, and neither is established within a research domain.
- What the whole set cannot do. Every randomized entry measures task execution, none measures discovery, and none is in cyber, math, or algorithms except one underpowered null on code security [→ Gemini and developer experience]. So the strongest designs in the log are the furthest from its subject, and the entries closest to its subject are demonstrations. That trade-off is the central measurement problem of this document, and no entry escapes it.
- Dates: assembled 2026-07-26 from entries whose fieldwork runs 2020 to 2026.
- Bears on: Q1 growth rate, Q3 demand, Q4 expertise, Q7 incidence.
- Links: every input is an entry in this document, and the external links are on those entries. Assembled by hand from the entries’ own design descriptions; see the evidence-weighting rules above for how the tiers were defined.
- Status: derived — a classification of the log’s own entries by design, quoting nothing and reproducible from them.
Known gaps
Where the evidence is thin, by question. These are the entries a future version of this log most needs, and their absence is the main reason the argument’s verdict is a ranking of theories rather than a measurement. Each paragraph says what has been added since the gap was first written, so the section records progress rather than restating the same complaint.
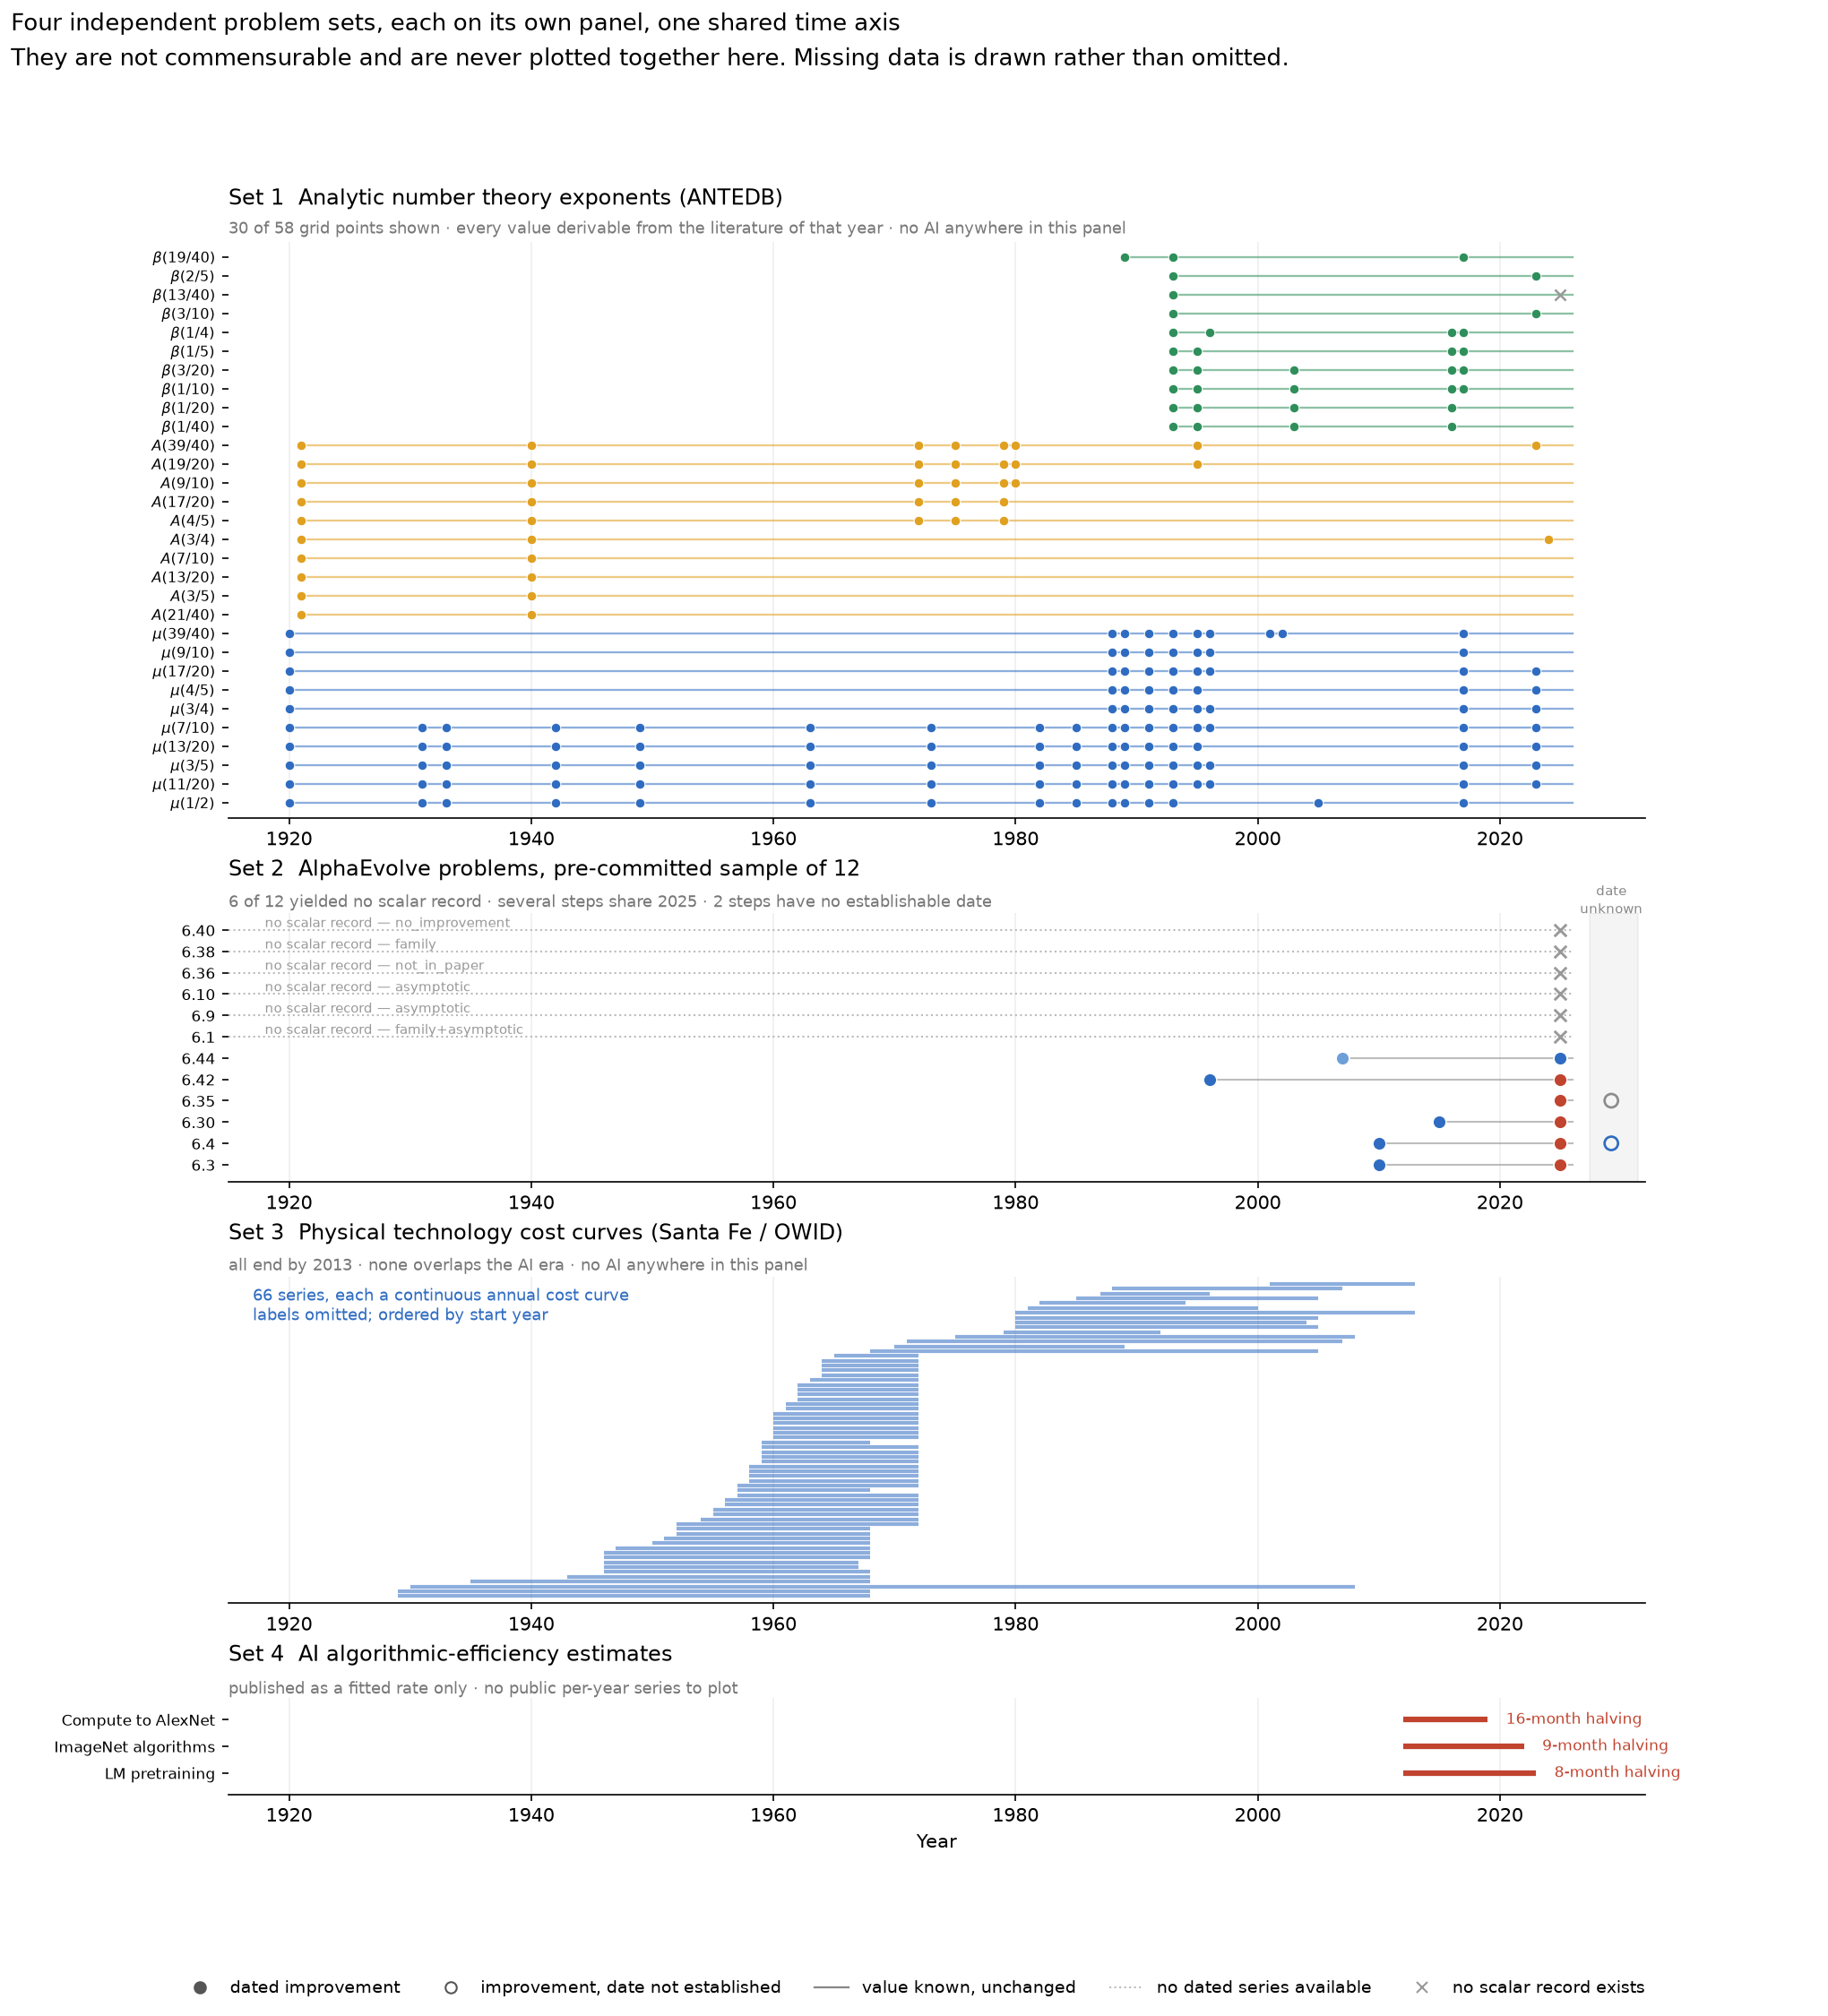
The four problem sets this log draws efficiency evidence from, each on its own panel and never pooled, on one shared year axis. Rows are individual problems. A filled dot is a dated improvement, a solid line a stretch over which the value is known and unchanged, an open dot an improvement whose date could not be established, a dotted line a problem with no dated series available, and a cross a problem in the set for which no scalar record exists. Set 1 is the exponent database [→ ANTEDB rates], set 2 the sampled AlphaEvolve problems [→ record steps], set 3 the technology cost curves [→ OWID], and set 4 the AI algorithmic-efficiency estimates [→ Epoch on LMs, ImageNet, compute-to-AlexNet]. Sets 1 and 3 contain no AI. The symbols and the grouping are this log’s; the dates are as recorded in the entries named.
Read across the panels, two things are visible that no single entry states. The sets barely overlap in time, so comparisons between them are across eras rather than like-for-like. And the density of dated evidence is very uneven: set 1 holds hundreds of dated improvements over a century, while set 2 holds sixteen steps, half its problems empty, and two undatable.
Q1: Growth rate
Q1 growth rate is measured only in proxies, and the proxies now have a good baseline. No source here estimates AI’s effect on a domain-level efficiency curve of the kind the OWID series plot. The pretraining curve is measured but ends before agents mattered [→ algorithmic progress]; the RCT measures a task-level effect in one setting [→ METR RCT]. Nothing connects the two. What has improved is the counterfactual rather than the estimate: the log now holds three independent pre-AI algorithmic-progress series measured with hardware physically held constant or removed [→ Sherry and Thompson, Bixby, SAT Museum], the hardware curve they should be compared against [→ hardware price-performance], and two macro estimates whose authors both state that the ideas channel is excluded from them [→ Acemoglu, Aghion and Bunel]. The math domain, which had no efficiency curve of any kind, now has six, extracted from the exponent database and running 1920 to 2024 [→ ANTEDB rates]. So the rate an AI contribution would have to beat is now well characterized in all three domains, and the contribution itself still is not measured in any of them.
Nobody has put the AI mathematics results against a historical baseline, and this log’s exponent series is the method that would. The AlphaEvolve mathematics paper improved bounds on roughly a fifth of 67 problems [→ AlphaEvolve mathematics], and the discussion of it splits into two unsatisfying halves. One half is rhetorical — “decades of human effort,” “untouched for over 50 years” — which is a claim about a baseline without a baseline. The other quotes magnitudes, mostly fourth- and fifth-decimal-place nudges, and defends them qualitatively on the grounds that in these areas “progress can be at times glacial.” Neither assembles what would settle it: the dated record of prior improvements on those same problems, so the AI-era step can be compared with the distribution of historical step sizes and the intervals between them. Two per-problem anchors exist in the coverage — 56 years for Strassen, and an Erdős minimum-overlap record that “hadn’t budged since 2016” — and they differ by a factor of six, which is why anecdotes cannot substitute for the distribution. That comparison is exactly what this log built for the analytic-number-theory exponents [→ ANTEDB rates]. Doing the same for the 67 problems is the single highest-value addition to the math domain, and it is tractable: the problems are named and their literatures are dated. Until someone does it, “AI improved 20% of these bounds” and “human mathematics improves these bounds all the time” are both true and neither is informative.
In math the gap is not thin evidence but a sourced absence, which is a different kind of finding. For cyber and algorithms the problem is that nobody has measured AI’s effect on a domain efficiency curve. For the exponent bounds the position is stronger and stranger: there is now a century-long curve, and no AI has moved any part of it. The database’s authors describe AI integration as a future possibility they have not pursued, the automation that did produce new bounds is a solver over collated relations rather than a model, and the one recorded attempt to point an AI system at analytic number theory failed even with expert hints [→ ANTEDB rates, ANTEDB, AlphaEvolve mathematics]. So the math domain supplies a clean pre-AI baseline and a clean null, and the argument should not treat its Q1 row as merely unmeasured there. What is genuinely missing is the other side: a dated attempt, at known cost, on a fixed set of these exponents, which would turn the null into a measurement.
The three domains’ baselines differ by three orders of magnitude, which reframes what “bending the curve” would mean. Pretraining efficiency halves in about 8 months and the fastest physical cost curve in about 8.6 [→ Epoch on LMs, efficiency rates]; classical algorithmic progress moves in jumps every 3 to 5 years [→ SAT Museum]; analytic number theory’s exponents halve on timescales of 82 to 1,204 years [→ ANTEDB rates]. An AI contribution that would be invisible against the pretraining curve would be transformative against the exponent curves, so a single question about whether AI raises “the rate of efficiency growth” is really three questions with different answers, and the argument’s Q1 row does not currently separate them. This is the log’s reading.
Q3: Demand
Q3 demand has quasi-experimental estimates now, but none of them is in a research occupation. curl’s program closure and ARTEMIS’s hourly rates measure neither headcount nor wages [→ curl, ARTEMIS], and the cyber labour indicators come from an industry survey and a job-posting scrape with no counterfactual [→ cyber labour]. The additions since do have counterfactuals and point in different directions: freelance employment and compensation down with top freelancers hit hardest [→ freelancer demand], postings for automation-prone work down 21% [→ posting demand], entry-level employment in exposed occupations down 16% [→ canaries], and French firm-level employment up in a pre-generative period [→ French firms]. Two of those cover software developers, which is the closest any of it comes to this project’s domains. Occupation-level causal evidence for security researchers, mathematicians, or ML researchers specifically remains absent, and the entry-level concentration is the finding most worth extending to them, since it is the junior work through which the next generation of researchers trains.
Q4: Expertise
Q4 expertise has been rebuilt out of domain, and the sign is contested. The most-cited result on how AI interacts with researcher ability has been disavowed [→ Toner-Rodgers]. The randomized literature added since points both ways, and the disagreement is structured rather than noisy. Where the task has a checkable right answer, AI compresses the skill distribution: support agents gained 34% at the novice end and nothing at the top [→ support agents], and an online experiment closed three quarters of the education gap [→ education gap]. Where the task is open-ended and the user must judge which suggestion to act on, AI widens it: Kenyan entrepreneurs split +15% against −10% by baseline ability, through selection among suggestions rather than differences in the suggestions themselves [→ Kenya]. Research is the open-ended case, and the METR developer RCT’s mechanism — uncritical acceptance of output being the cost — is the same one [→ METR RCT].
Two things are still missing. None of this is measured *in* cyber, math, or algorithms, except one underpowered null on code security [→ [Gemini and developer experience](2026-07-23-apple-picking-sources-cyber.llm.html#src-gemini-dev-security)]. And none of it measures discovery, as against execution of a defined task. A study measuring discovery outcomes by user expertise in one of these three domains remains the highest-value single addition.Q5: Returns
Q5 returns lack a repeated-run protocol. Duplicates and crossovers are inferred from operational data rather than designed experiments [→ XBOW, RE-Bench]. Nobody has run the same agent at equal budget repeatedly against a fixed target population and reported the yield curve. The nearest thing is AlphaProof Nexus’s agent ablation, where a basic verify-and-retry loop reached the same nine problems as the full system at 2–5× the cost on the hardest ones [→ AlphaProof Nexus] — which is a scaffold comparison at fixed problem set, not a yield curve, but it is the closest available test of whether more machinery extends reach or only cuts cost.
A baseline for “returns diminish” is now in the log, and it is not zero. Research productivity was falling by roughly 5% a year across the whole economy long before AI, halving about every 13 years, and by 6.8% a year in semiconductors [→ ideas harder to find]. Any apple-picking prediction of falling yield has to beat that baseline to be distinctive. No entry here makes that comparison.
Q6: Intertemporal evidence
Q6 intertemporal has one clean series and otherwise almost no direct evidence. The staircase question needs a dated capability series at fixed scaffold. AIxCC comes closest, because the organizers held the competition structure fixed across the August 2024 semifinal and the August 2025 final [→ AIxCC] — though the teams rebuilt their systems between the two, so even that measures the stack rather than the models. AlphaGeometry’s 54% to 84% on a fixed 25-year problem set is a second [→ AlphaGeometry 2], with the same defect: model and scaffold moved together. Every other available series confounds model generation with harness, prompting, and task mix [→ PERFOPT, TTT-Discover, FrontierMath], and the size of that confound has now been measured directly: harness changes alone moved a cyber benchmark by up to twentyfold at fixed model [→ Naptime]. This remains the weakest-supported row in the argument’s table.
The staircase, if it appears, would not be diagnostic of AI. The one domain in this log with three decades of dated, hardware-controlled progress measurement shows exactly the pattern apple-picking predicts — slow years punctuated by jumps “with a frequency of 3 to 5 years” — with no AI involved at any point [→ SAT Museum]. Sherry and Thompson chart the same step functions across 113 algorithm families [→ Sherry and Thompson], and Bixby’s version-to-version speedups are lumpy in the same way inside one product line [→ Bixby]. So finding a staircase in an AI capability series would not distinguish AI-driven progress from ordinary algorithmic progress, and the argument’s decision to demote the staircase from a test to a question about release dynamics is if anything understated. This comparison is the log’s.
Dating is itself uneven, and the gaps are informative. Two entries cannot be pinned to a month: DeepMind’s validation-bottleneck essay carries no posting date, and XBOW’s own post carries none either [→ validation bottleneck, XBOW]. The Mythos preview’s page metadata post-dates a response to it, so its true posting date is unresolved [→ Mythos]. In all three cases the undated source is a vendor or advocacy document, and in all three the date would bear on how much independent work a competing claim could represent.
Q7: Incidence
Q7 incidence has no controlled starting-point test. The pre/post comparison runs across different benchmarks rather than across staged versions of one codebase [→ AlgoTune, SWE-fficiency]. A matched experiment holding model, scaffold, budget, and metric fixed would settle it.
Cross-cutting limitations
Cross-cutting: failure denominators are usually missing. Most entries report successes without the attempts that produced them. Where a denominator exists it is recorded above and collected in one place [→ denominators]; where it does not, the figure cannot support a rate. The inventory shows that where a real problem set does have a published denominator, the yield is almost always under a quarter — so the missing denominators are unlikely to be missing at random.
Cross-cutting: the strongest designs are the furthest from the subject. Every randomized entry in the log measures task execution rather than discovery, and only one of them is in cyber, math, or algorithms — an underpowered null on code security [→ Gemini and developer experience]. Everything in the three domains is a demonstration, a benchmark, or an operational log. The single highest-value addition to this document would be a randomized or staged experiment measuring discovery outcomes in one of the three domains, by user expertise. Nothing here is a substitute for it, and the syntheses assembled above are an attempt to get as far as possible without it [→ experimental evidence].
Cross-cutting: benchmark validity is now better documented than benchmark performance. The log holds a general critique of agent benchmarking [→ agents that matter], a contamination result on the most-quoted coding benchmark [→ SWE-bench illusion], a machine-and-scoring-rule audit of the optimization benchmarks [→ benchmark reliability], a vendor conceding its own kernel harness was gameable [→ robust-kbench], a funding-disclosure failure on the headline math benchmark [→ FrontierMath], and the clearest available case of a proxy being optimized while the objective did not move [→ AI-discovered drugs]. Taken together these do not show that measured progress is illusory; they show that no single benchmark score in this document should be load-bearing on its own. That is a conclusion about method, and it is the log’s.
Chronology
Every dated event in the log in a single order, so that claims about sequence and rate can be checked without reading the entries. Rows covering a span rather than a moment — the cost-curve and algorithmic-progress measurement windows — are placed at the year the span opens. Publication dates are used where the underlying work is not separately dated; arXiv revisions are listed only where a figure could have moved. This table is derived from the entries’ **Dates:** lines and must be updated with them, and it sorts strictly by start date, so a new row goes in position rather than at the end.
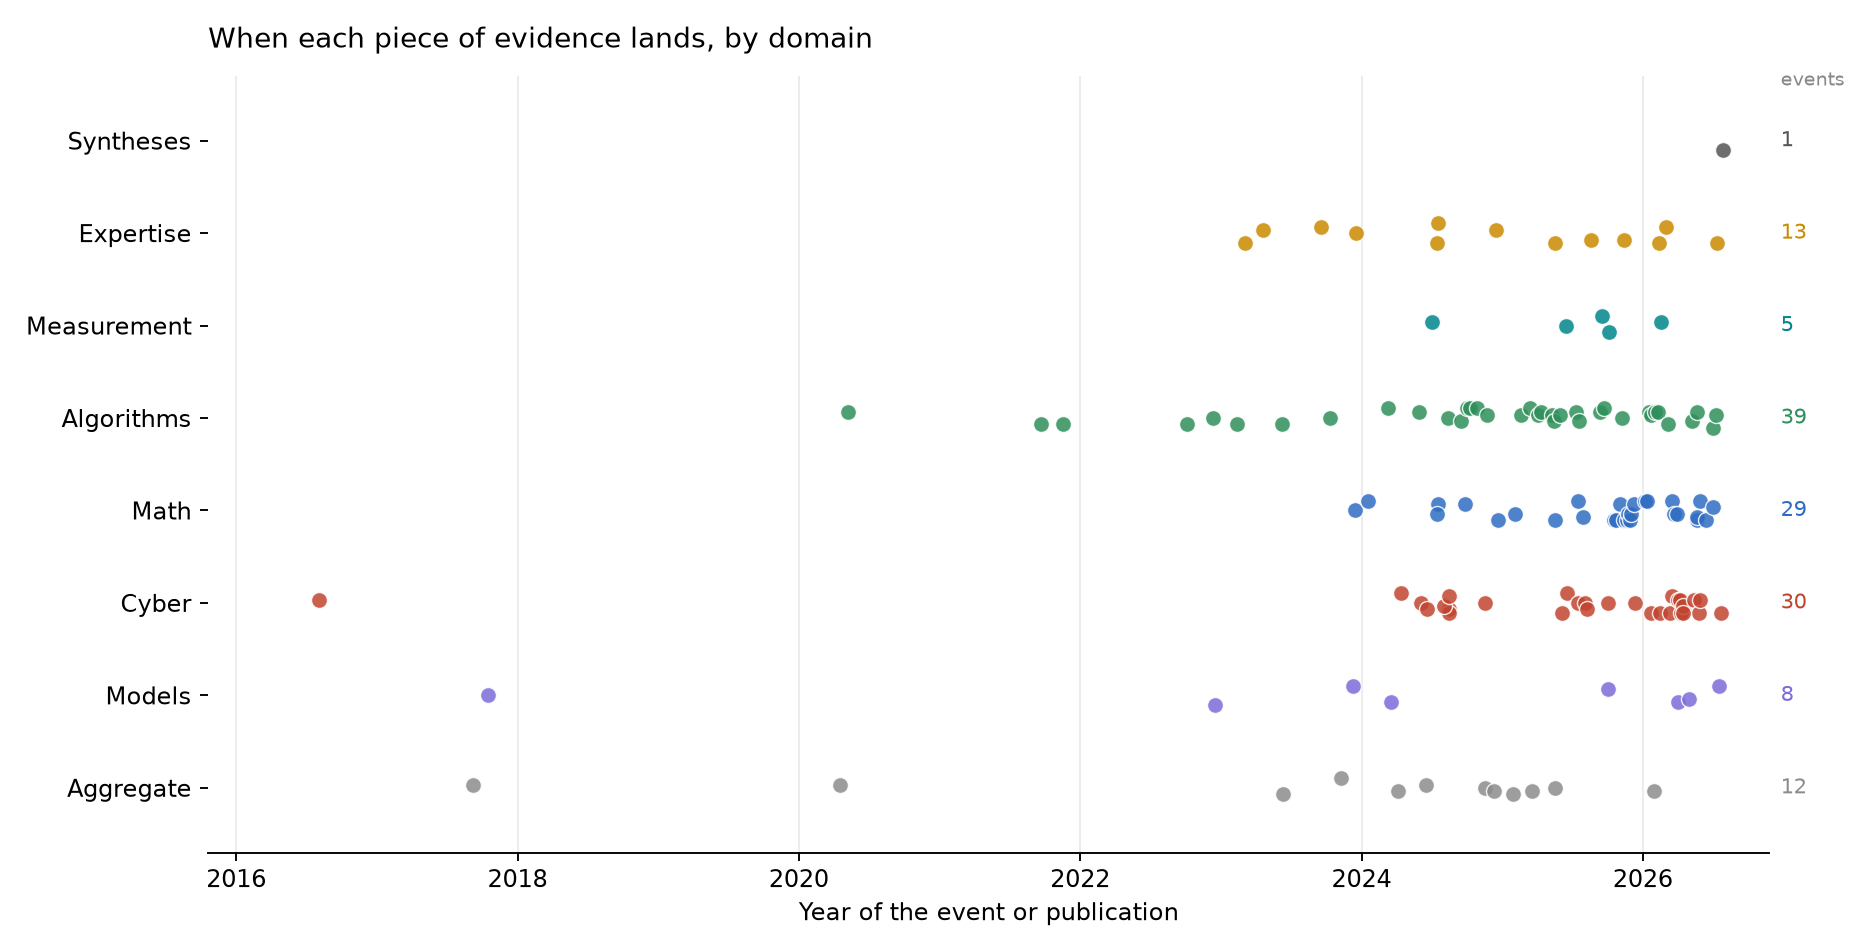
Generated by tools/sources_figures.py from the table below, so it cannot drift from it. One point per dated row, placed on the row of the section its entry belongs to, with the number of events per section at the right. The concentration in 2025 and 2026 is a property of the evidence base rather than of the log’s coverage: most of the primary sources on AI contributions in these domains were published in those two years.
| Date | Event | Entry |
|---|---|---|
| 1920–2024 | Span of the six analytic-number-theory exponent series | → |
| 1929–2013 | Span of the 66 technology cost curves | → |
| 1940–2019 | Span of the 113-algorithm-family improvement survey | → |
| 1946 | Erdős poses the unit-distance conjecture | → |
| 1988–2004 | Span of the LP solver speedup measurement | → |
| 1990s–2022 | Span of the SAT Museum’s thirty years of solvers | → |
| 2006–2023 | Span of the ML hardware price-performance measurement | → |
| 2012–2019 | Span of the compute-to-AlexNet efficiency measurement | → |
| 2012–2023 | Span of the language-model algorithmic-progress data | → |
| 2012 | Bixby: MIP solvers 29,000× faster from algorithms alone; LP progress stopped after 2004 | → |
| 2013-08-03 | Grace releases Algorithmic Progress in Six Domains; algorithms worth 50–100% of hardware | → |
| 2013-12-09 | Grace’s report last revised | → |
| 2016-08-04 | DARPA Cyber Grand Challenge: autonomous find-and-patch, nine years before AIxCC | → |
| 2017-02-23 | First SHA-1 collision published; no AI involved | → |
| 2017-09-08 | Bloom, Jones, Van Reenen, and Webb circulate Are Ideas Getting Harder to Find? | → |
| 2017-10 | Aghion, Jones, and Jones put AI in the idea production function | → |
| 2019 | GPT-2, start of the offensive-cyber horizon series | → |
| 2019-12-02 | RSA-240 and the 795-bit discrete log fall, 3x faster than extrapolated | → |
| 2020-02-28 | RSA-250 factored — the last factorization record to date | → |
| 2020-04 | Are Ideas Getting Harder to Find? published in the AER | → |
| 2020-05-08 | Hernandez and Brown define algorithmic progress as compute-to-past-capability; 44× since 2012 | → |
| 2020-08-06 | Stockfish merges NNUE — one patch worth about 58 Elo | → |
| 2021-09-20 | Sherry and Thompson: half of 113 algorithm families show little or no improvement, 14% transformative | → |
| 2021-11 | How Fast Do Algorithms Improve? appears in print in Proceedings of the IEEE | → |
| 2022-10-05 | AlphaTensor beats a fifty-year matrix-multiplication record | → |
| 2022-11-03 | Pangu-Weather: first AI model to beat operational NWP on all factors | → |
| 2022-12-10 | Erdil and Besiroglu: ImageNet compute requirements halve every nine months | → |
| 2022-12-15 | Besiroglu, Emery-Xu, and Thompson: AI R&D is more capital-intensive | → |
| 2023 | The SAT Museum re-runs thirty years of solvers on one machine | → |
| 2023-02-13 | Peng and co-authors: Copilot RCT, 55.8% faster on an HTTP-server task | → |
| 2023-03-02 | Noy and Zhang: ChatGPT compresses the writing productivity distribution | → |
| 2023-04-20 | Brynjolfsson, Li, and Raymond: support agents, +14% overall, +34% for novices | → |
| 2023-06-07 | AlphaDev’s sorting routines enter the C++ standard library | → |
| 2023-06-09 | Trudgian and Yang post the precursor exponent tables | → |
| 2023-09 | BCG jagged-frontier experiment circulated: +12.2% inside, −19% outside | → |
| 2023-10-10 | SWE-bench: the best model resolves 1.96% of 2,294 real GitHub issues | → |
| 2023-10-23 | nncp v3.2 tops the uncapped compression leaderboard; still there in 2026 | → |
| 2023-11-09 | Epoch: ML hardware price-performance doubles every 2.1 years | → |
| 2023-11-14 | GraphCast beats ECMWF HRES on 89.3% of 2,760 targets | → |
| 2023-12 | Hui, Reshef, and Zhou: freelance jobs down 2%, compensation down 5.2% | → |
| 2023-12-01 | Sphere-packing lower bound improved for all dimensions, first time since 1947 — by humans | → |
| 2023-12-09 | Ide and Talamas: autonomous AI helps the knowledgeable, assistive AI the least | → |
| 2023-12-14 | FunSearch: first LLM result on an open problem, cap sets and bin packing | → |
| 2024 | Otis and co-authors run the Kenyan entrepreneur RCT: +15% high, −10% low | → |
| 2024-01-17 | AlphaGeometry solves 25 of 30 olympiad geometry problems | → |
| 2024-02-02 | Hutter Prize: fx-cmix record, human-written | → |
| 2024-03-09 | Algorithmic progress in language models, arXiv | → |
| 2024-03-17 | Korinek and Suh: wages collapse only if human task complexity is bounded | → |
| 2024-04-05 | Acemoglu: no more than 0.71% TFP over ten years, and less if tasks are hard to learn | → |
| 2024-04-11 | Fang and co-authors: 87% of one-day CVEs exploited with the description, 7% without | → |
| 2024-05-28 | modded-nanogpt baseline, 45 min | → |
| 2024-06 | Aghion and Bunel: 0.68pp median, with the ideas channel explicitly excluded | → |
| 2024-06-02 | Fang and co-authors: teams of agents on zero-day vulnerabilities | → |
| 2024-06-20 | Project Naptime: security tooling moves a benchmark up to twentyfold at fixed model | → |
| 2024-07 | AlphaProof and AlphaGeometry 2 reach IMO silver with multi-day compute | → |
| 2024-07 | Doshi and Hauser: AI raises individual creativity, cuts collective diversity ~10% | → |
| 2024-07-01 | Kapoor and co-authors: AI agents that matter | → |
| 2024-07-14 | Noy and Zhang published in Science, with different figures | → |
| 2024-07-15 | PutnamBench: 1,692 formalizations, solvers clear “a handful” | → |
| 2024-08 | AIxCC semifinal: 37% of synthetic bugs found, 25% patched | → |
| 2024-08 | GPT-4o, start of the AISI cyber-range series | → |
| 2024-08-02 | Meta CYBERSECEVAL 3: Llama 3 fails every stage past reconnaissance | → |
| 2024-08-12 | The AI Scientist: automated papers at under $15 each | → |
| 2024-08-15 | Cybench: agents clear tasks humans solved in up to 11 minutes | → |
| 2024-09-03 | Hutter Prize: fx2-cmix record, human-written | → |
| 2024-09-17 | CORE-Bench: 21% on the hardest reproducibility tasks | → |
| 2024-09-25 | The Equational Theories Project launches | → |
| 2024-10-02 | Song and co-authors: Copilot raises contributions 5.9%, coordination time 8% | → |
| 2024-10-09 | MLE-bench: bronze-medal level in 16.9% of 75 Kaggle competitions | → |
| 2024-10-27 | Hoffmann and co-authors: Copilot shifts developers from coordination to coding | → |
| 2024-11 | Big Sleep’s first SQLite find, in a development branch | → |
| 2024-11 | Toner-Rodgers preprint appears | → |
| 2024-11-10 | CIFAR-10 speedrun: the Muon record, 2.59 s | → |
| 2024-11-22 | RE-Bench, arXiv | → |
| 2024-12 | Demirci, Hannane, and Zhu: postings for automation-prone work down 21% | → |
| 2024-12-04 | GenCast beats the ECMWF ensemble on 97.2% of targets | → |
| 2024-12-10 | Hao and co-authors: AI expands individual impact, contracts collective focus | → |
| 2024-12-20 | Epoch discloses OpenAI’s funding of and access to FrontierMath | → |
| 2025 | An LLM-evolved solver wins the SAT Competition main track | → |
| 2025-01-28 | Tao launches ANTEDB with automated exponent-pair improvements | → |
| 2025-02–06 | Window of the METR developer RCT | → |
| 2025-02-05 | AlphaGeometry 2: 84% of 25 years of geometry problems, up from 54% | → |
| 2025-02-20 | MLGym, arXiv | → |
| 2025-02-25 | ECMWF’s own ML model AIFS becomes operational: up to 20% skill, ~1000x less energy | → |
| 2025-03-12 | Epoch: inference prices fall 9× to 900× a year depending on the milestone | → |
| 2025-03-18 | METR time horizons: 50% horizon doubling every ~7 months since 2019 | → |
| 2025-04-02 | PaperBench: a 21.0% replication score, below the human baseline | → |
| 2025-04-10 | The AI Scientist-v2: one of three manuscripts above a workshop threshold | → |
| 2025-05 | AlphaEvolve raises the 11-dimensional kissing bound 592→593 | → |
| 2025-05 | Aghion and co-authors: French firms adopting AI grew employment and sales | → |
| 2025-05-09 | Cui and co-authors pool three coding-assistant RCTs: +26% tasks, 4,867 developers | → |
| 2025-05-14 | AlphaEvolve announced; 48-multiplication matrix result | → |
| 2025-05-16 | MIT disavows Toner-Rodgers | → |
| 2025-05-29 | GSO, arXiv | → |
| 2025-06 | XBOW tops a HackerOne leaderboard | → |
| 2025-06-03 | CyberGym, arXiv | → |
| 2025-06-14 | The SWE-bench illusion: 76% bug localization without the repository | → |
| 2025-07 | Gemini Deep Think officially graded IMO gold | → |
| 2025-07-10 | METR RCT: AI made experienced developers 19% slower | → |
| 2025-07-15 | Big Sleep’s live SQLite zero-day, CVE-2025-6965 | → |
| 2025-07-19 | AlgoTune, arXiv | → |
| 2025-07-28 | Harmonic announces Aristotle’s formally verified IMO 2025 proofs | → |
| 2025-08-04 | Big Sleep discloses 20 novel open-source bugs | → |
| 2025-08-08 | AIxCC final: 86% found, 68% patched, 18 real zero-days, ~$152/task | → |
| 2025-08-18 | Zhao and co-authors: AlphaFold raised cross-disciplinary collaboration 0.48% | → |
| 2025-09-09 | SATLUTION claims repository-scale LLM solver evolution | → |
| 2025-09-11 | First AI-set modded-nanogpt record (hiverge.ai, 2.625 min) | → |
| 2025-09-16 | Sakana concedes kernel benchmarks have exploitable loopholes | → |
| 2025-09-23 | DORA 2025: throughput sign flips positive, stability still negative | → |
| 2025-10 | GPT-5 “solves” Erdős problems — actually literature retrieval | → |
| 2025-10-01 | HackerOne reports 560+ valid reports from autonomous agents | → |
| 2025-10-02 | Benjamin Jones’s AI-in-R&D model issued as NBER w34312 | → |
| 2025-10-05 | GDPval: 47.6% wins-or-ties against experts on a 220-task subset | → |
| 2025-10-15 | First AI-set CIFAR-10 record: Hiverge, 1.99 s | → |
| 2025-10-23 | Ganzhinov beats AlphaEvolve’s kissing bounds in dimensions 10 and 14, falls one short in 11 | → |
| 2025-11-03 | AlphaEvolve on 67 mathematical problems; analytic number theory the recorded failure | → |
| 2025-11-08 | SWE-fficiency, arXiv | → |
| 2025-11-12 | AlphaProof published in Nature; Ringer’s hands-on assessment appears | → |
| 2025-11-13 | Brynjolfsson, Chandar, and Chen: entry-level employment down 16% | → |
| 2025-11-18 | Gurobi 13 released: 8.2% MILP gain, no AI credited | → |
| 2025-11-20 | Early science acceleration experiments with GPT-5, arXiv | → |
| 2025-11-22 | Tao on problem selection, Mathstodon | → |
| 2025-11-26 | Gundlach and co-authors: efficiency estimates are reference-dependent | → |
| 2025-11-28 | ThetaEvolve: an 8B open model passes two AlphaEvolve bounds | → |
| 2025-11-30 | Tao on the long tail of unsolved problems, Mathstodon | → |
| 2025-12-08 | The Equational Theories Project settles 22,028,942 implications | → |
| 2025-12-10 | ARTEMIS pentest comparison, arXiv | → |
| 2026-01-07 | Tao’s caveat on Erdős #728, five days before the writeup | → |
| 2026-01-12 | Erdős #728 Lean-proof writeup, arXiv | → |
| 2026-01-16 | Locus/Intology modded-nanogpt record, 1.765 min | → |
| 2026-01-21 | curl ends its bug bounty after AI submission flood | → |
| 2026-01-22 | TTT-Discover, arXiv | → |
| 2026-01-29 | METR Time Horizon 1.1: recent doubling time falls to 88.6 days | → |
| 2026-02 | Opus 4.6, end of the AISI cyber-range series (1.7 → 9.8 steps) | → |
| 2026-02-02 | Aster modded-nanogpt record, 1.528 min | → |
| 2026-02-10 | Station modded-nanogpt record, 1.496 min | → |
| 2026-02-13 | NBER w34851: AI closes three quarters of the education productivity gap | → |
| 2026-02-18 | Simple baselines match code evolution on nine AlphaEvolve problems | → |
| 2026-02-25 | Epoch’s Ho: post-2023 software progress around 10x a year, interval 2-50x | → |
| 2026-03-01 | Jagged-frontier experiment published in Organization Science | → |
| 2026-03-06 | Karpathy’s autoresearch repository created | → |
| 2026-03-11 | UK AISI multi-step cyber attack scenarios, arXiv | → |
| 2026-03-16 | Gemini and developer experience: experience not substitutable for code security | → |
| 2026-03-16 | HorizonMath: 100+ unsolved problems, models near 0% | → |
| 2026-03-20 | Tao’s Dwarkesh interview: “jumping machines” | → |
| 2026-03-29 | Tao’s blog post on AI as a complementary style | → |
| 2026-04 | Anthropic previews Mythos; thousands of claimed vulnerabilities | → |
| 2026-04-02 | Lyptus offensive-cyber time horizons | → |
| 2026-04-02 | Bazzichi, Riccaboni, and Castellacci on recombinant innovation | → |
| 2026-04-07 | AISLE: no stable best model across cyber tasks | → |
| 2026-04-09 | Vidoc reproduces Mythos-class detection with public models | → |
| 2026-04-14 | Breunig on UK AISI Mythos runs: no diminishing returns at 100M tokens | → |
| 2026-04-15 | NIST: CVE submissions up 263% since 2020, enrichment cannot keep pace | → |
| 2026-04-30 | Davidson, Halperin, Houlden, and Korinek, NBER w35155 | → |
| 2026-05-07 | AlphaEvolve one-year update: ~0.7% of fleet compute | → |
| 2026-05-13 | Axios follow-up on the Palo Alto Mythos deployment | → |
| 2026-05-20 | Unit-distance conjecture disproved; verification posted the same day | → |
| 2026-05-21 | Current modded-nanogpt record, 1.320 min (~34× the baseline) | → |
| 2026-05-21 | AlphaProof Nexus: 9 of 353 Erdős problems, 44 of 492 OEIS conjectures | → |
| 2026-05-26 | AppSec job-posting analysis: AI mentions rise 2.1% to 7.2% in six months | → |
| 2026-05-27 | GPT-5.5 saturates the offensive-cyber horizon task set | → |
| 2026-05-28 | Williams contextualizes the unit-distance disproof | → |
| 2026-06-12 | FrontierMath v2 released after errors in 42% of problems | → |
| 2026-06-26 | cmix-lex announced: a pending Hutter Prize entry | → |
| 2026-06-30 | Erdős-problems AI wiki freezes | → |
| 2026-07 | DeepMind’s validation-bottleneck essay | → |
| 2026-07-01 | Performance-benchmark reliability audit, arXiv | → |
| 2026-07-08 | PERFOPT-Bench relay pilot, arXiv | → |
| 2026-07-09 | Fulcrum writeup claims a 1.828 s CIFAR-10 run, unacknowledged | → |
| 2026-07-10 | Kenyan entrepreneur RCT pre-published in Management Science | → |
| 2026-07-22 | SANS 2026 workforce findings reported: 16% cut headcount, entry level hardest hit | → |
| 2026-07-26 | This log last checked; the syntheses assembled, including the exponent series and the AlphaEvolve record sample | → |
| 2026-07-26 | First Stockfish master commit crediting an LLM, a 0.6% speed patch | → |