This is one of four source documents for AI’s Contribution to Discovery. The four source documents are cyber, math, algorithms and optimization, and cross-cutting evidence, models, and method.
The conventions this document follows — what an entry must contain, the status vocabulary, the standing rules, and the eight questions entries are tagged against — are set out in the method and cross-cutting document.
Overview
Each series is plotted under its own entry below, using the same charts and visual language as LLMs’ Contribution to Discovery. Each is generated by its own folder in the ai-discovery-data repository, which is canonical for the data and keeps a document, a fetching script and a drawing script beside each series.
Two questions organize this domain, and the charts are built around them: how large the flow of AI-contributed improvements is relative to the human flow, and whether the rate of discovery changed — a slope change — where agents arrived. Every chart has years on the x-axis and the standing best on the y-axis, with every known step drawn, so both questions can be read off the steps directly: who set them, and whether they arrive faster inside the shading.
On the flow, AI-set records now exist on three public instruments, and they are real but small. modded-nanogpt fell about 35× over 86 records in two years, and AI systems hold 4 of the 86, each worth roughly 1%, while the deep gains — the Muon optimizer at about 21%, U-Net skip connections at about 8% — are human [→ nanogpt]. The CIFAR-10 speedrun’s newest acknowledged record is AI-set, a 23% step, with a further 7.6% claim unacknowledged [→ CIFAR-10 speedrun]. And an LLM-evolved solver won the 2025 SAT Competition, solving about 2% more instances than the human-written solver it descends from [→ LLM-evolved SAT]. Where the other open series stay human, the AI flow is zero: every compression record on both the capped and uncapped series [→ compression records], every Stockfish gain but one 0.6% speed patch in July 2026 [→ Stockfish], and every improvement in the MIP vendor series [→ Gurobi]. Off the leaderboards the pattern repeats: AlphaEvolve improved the state of the art on about 20% of 50-plus open problems and self-reports production gains worth about 1% of Gemini training time and 0.7% of fleet compute [→ AlphaEvolve]; an autonomous two-day run recovered about 11% on a fresh codebase [→ autoresearch]; and on mature, already-optimized repositories agents reach less than 0.23× the expert speedup and under 5% success [→ SWE-fficiency, GSO]. The clearest case of an agent-era system beating the best human on a like-for-like artifact is a GPU kernel, faster by 15 to 51% depending on hardware [→ TTT-Discover].
On the slope, no series shows a change, and this is no longer just an absence of measurement. The published efficiency estimates — 113 algorithm families over eight decades, thirty years of SAT solvers rerun on one machine, Bixby’s solver test with hardware physically held constant, and three compute-to-fixed-capability estimates — all end between 2012 and 2023 [→ Sherry and Thompson, SAT Museum, Bixby, Epoch on LMs, ImageNet, compute-to-AlexNet], and the best-measured of them is now known to be reference-dependent [→ Gundlach]. But the record series keep running through the agent era, and none accelerates: nanogpt flattened as AI entered; Stockfish gained roughly 47 Elo a year in 2022–23 and 18 to 31 a year in 2024–26 on one fixed setup [→ Stockfish]; the Hutter Prize’s awarded steps stay on their 1.0–1.6% cadence and the uncapped compression frontier has not moved since October 2023 [→ compression records]; Gurobi’s own MILP gains run 8–13% a year against a doubling every year in the early history [→ Gurobi]; the CIFAR-10 yearly improvement factor shrank from ÷2.9 to ÷1.3 just as its records went AI [→ CIFAR-10 speedrun]; and the matrix-multiplication exponent has no AI step and is slowing. The inference-price series does fall steeply through the era, but it measures deployment cost rather than research output [→ inference prices]. The curve that would settle it — the labs’ internal algorithmic efficiency on their own training and inference stack — remains unobserved, with Epoch’s best guess at 10× a year inside an 80% interval of 2× to 50× [→ Epoch after 2023].
A caution for reading either question off a curve: lumpy, staircase progress is this field’s normal shape with no AI in it. Half of algorithm families never improve while 14% improve more than a thousandfold per year [→ Sherry and Thompson]; SAT solvers jump every three to five years [→ SAT Museum]; LP solvers stood still for eight years after a 3300× run [→ Bixby]; a single 2020 Stockfish patch was worth about 58 Elo where a good year is 30 to 50 [→ Stockfish]. A staircase in the agent era is therefore not by itself an AI signature, and a flat stretch is not by itself an exhausted one.
Algorithms
The entries move from pre-agent estimates of algorithmic progress to record series that reach the agent era, the still-unobserved internal software curve, agent demonstrations, optimization benchmarks, broader research-automation benchmarks, and field evidence on software work. Domain-specific performance audits stay here; benchmark-validity work that cuts across domains remains in the method document.
Pre-agent rate estimates
Sherry and Thompson: how fast do algorithms improve? (2021)
Independent (MIT CSAIL / MIT IDE). The widest survey of algorithmic progress there is: 113 algorithm families traced from the 1940s to 2019, scored by asymptotic worst-case complexity. It is the closest thing in the literature to a direct test of apple-picking, because it measures the distribution of improvement across problems rather than the average.
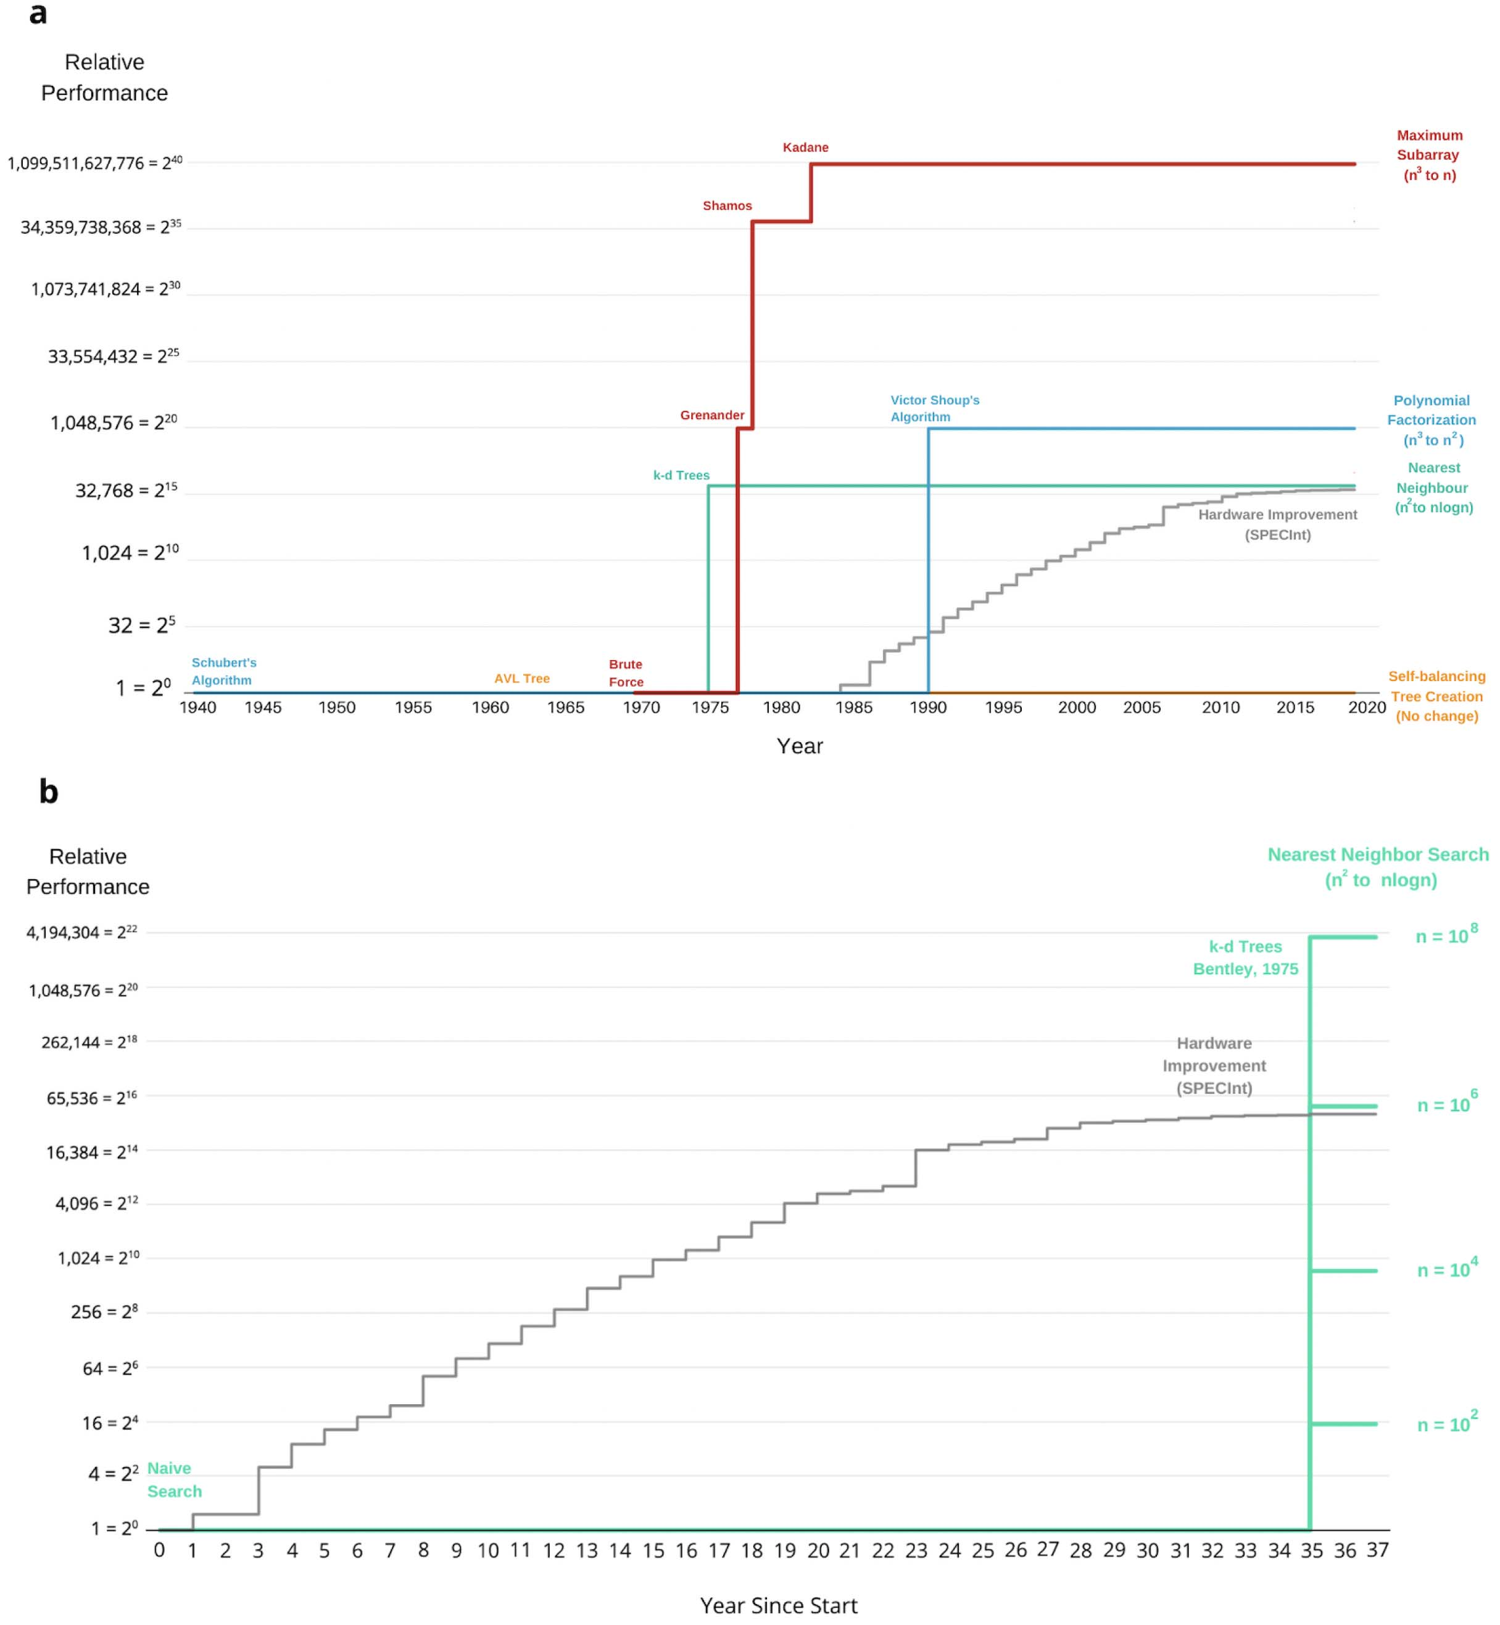
Hardware improvement is the smooth grey staircase; each algorithm family is a flat line punctuated by one or two enormous discontinuities, and some families never move at all. The lower panel makes the second point: the same algorithmic discovery is worth about 2^4 at n = 100 and about 2^22 at n = 10^8, so whether an algorithm beats hardware depends on the problem size you ask about.
- Enormous heterogeneity is the headline, not the average. “Analyzing data from 57 textbooks and more than 1137 research papers reveals enormous variation. Around half of all algorithm families experience little or no improvement. At the other extreme, 14% experience transformative improvements, radically changing how and where they can be used. Overall, we find that, for moderate-sized problems, 30%-43% of algorithmic families had improvements comparable or greater than those that users experienced from Moore’s Law and other hardware advances.”
- The distribution is bimodal, which is the apple-picking shape. “The first cluster, representing just under half the families, shows little to no improvement even for large problem sizes.” And: “The second cluster of algorithms, consisting of 14% of the families, has yearly improvement rates greater than 1000% per year.” A mean improvement rate over these families would describe almost none of them.
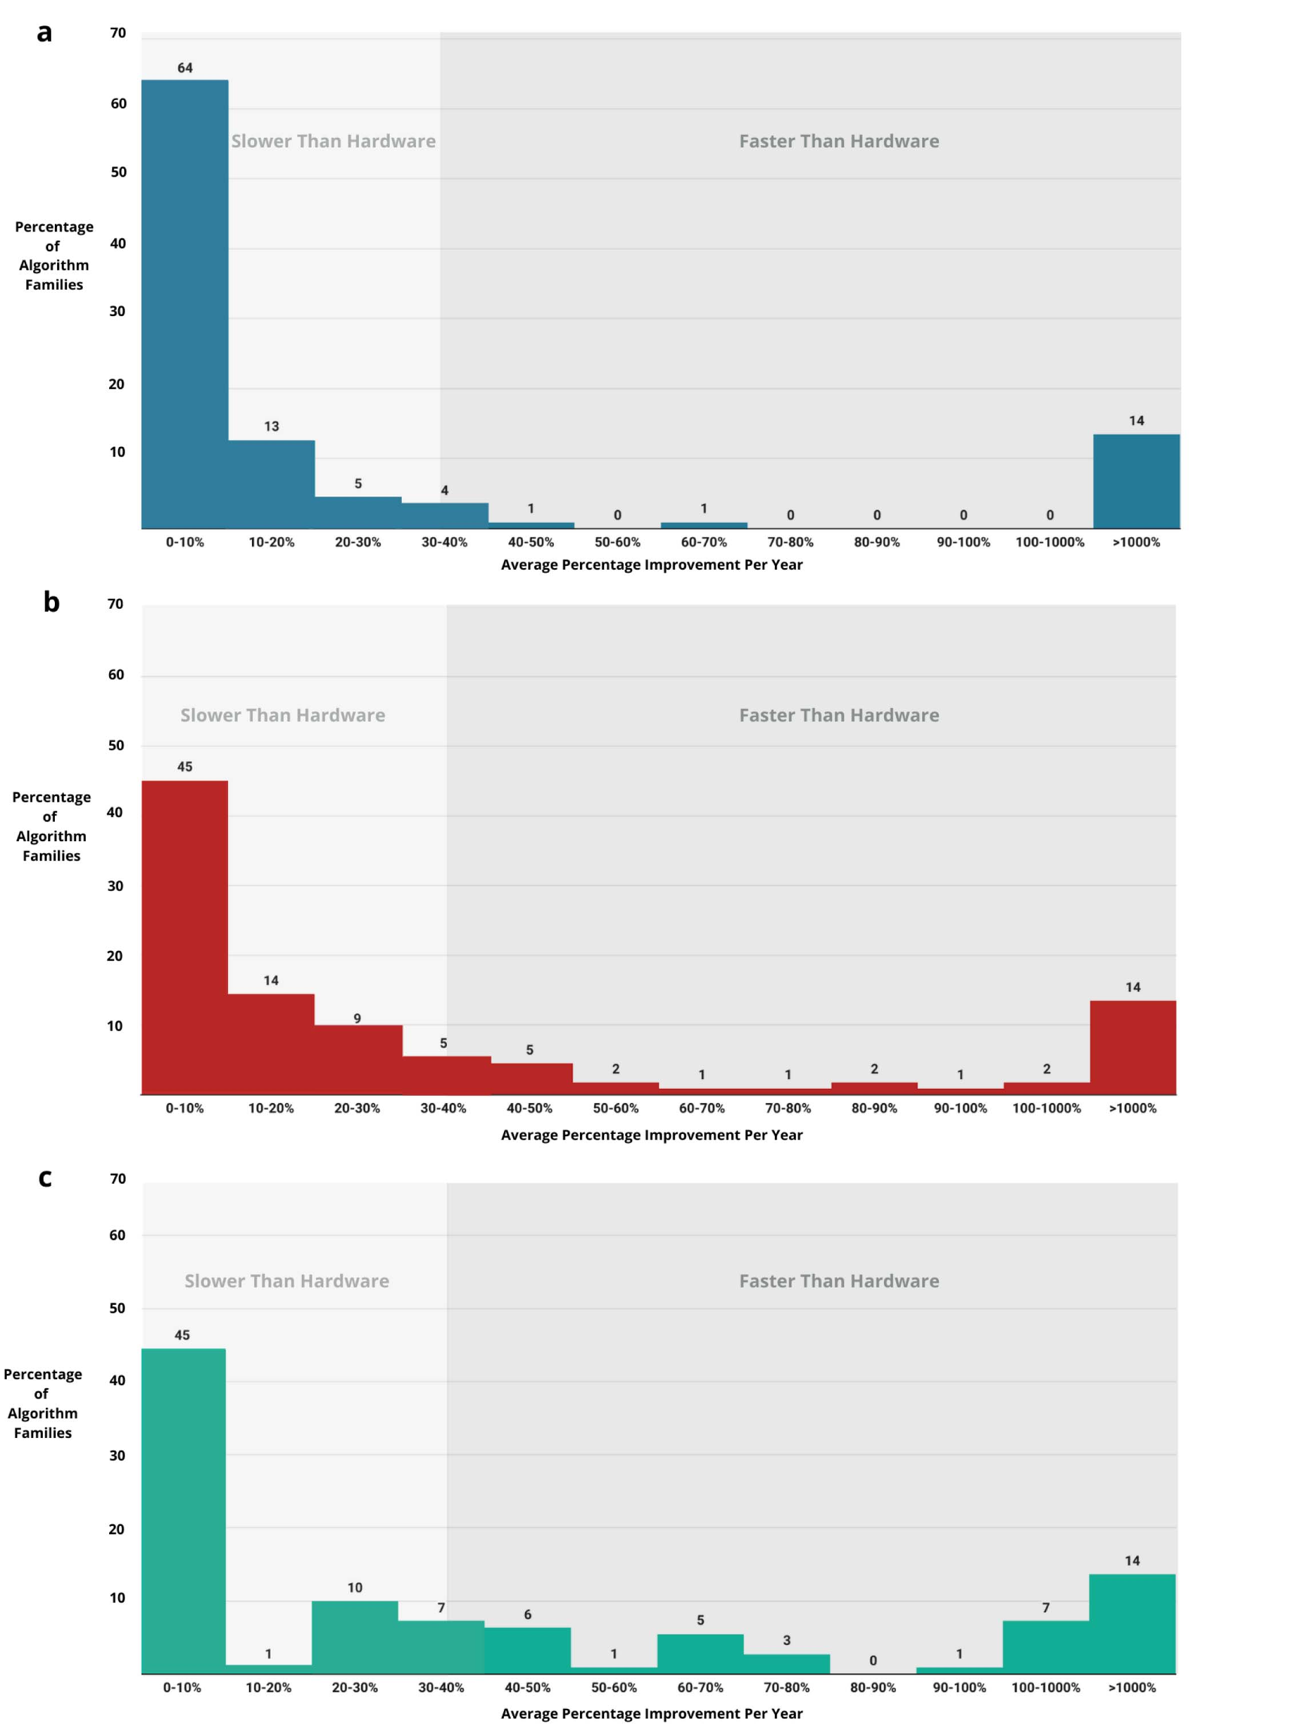
- Whether algorithms beat hardware depends entirely on problem size. “For n = 1 thousand, only 18% of families had improvement rates faster than hardware, whereas 82% had slower rates. However, for n = 1 million and n = 1 billion, 30% and 43% improved faster than hardware. Correspondingly, the median algorithm family improved 6% per year for n = 1 thousand but 15% per year for n = 1 million and 28% per year for n = 1 billion. At a problem size of n = 1.06 trillion, the median algorithm improved faster than hardware performance.”
- Improvements are rare events per family. “There are 113 algorithm families. On average, there are eight algorithms per family… there are 276 initial algorithms and subsequent improvements, an average of 1.44 improvements after the initial algorithm in each algorithm family.” Roughly one and a half improvements per family across eight decades is a very low arrival rate for a picked apple.
- The authors’ summary, in their own words. “We find enormous heterogeneity in algorithmic progress, with nearly half of algorithm families experiencing virtually no progress, while 14% experienced improvements orders of magnitude larger than hardware improvement (including Moore’s law). Overall, we find that algorithmic progress for the median algorithm family increased substantially but by less than Moore’s law for moderate-sized problems and by more than Moore’s law for big data problems.”
- The bias runs toward overstating progress, and they say so. “If inflation of leading constants is typical, it would mean that our results overestimate the scale of algorithm improvement.” They test it and find such cases are “the exception, rather than the rule,” but decline to extrapolate: “we cannot assume that this necessarily extrapolates to unmeasured algorithms since higher complexity may lead to both higher leading constants and a lower likelihood of quantifying them.”
- What is excluded matters for reading it against this log. Only exact algorithms with exact solutions count.1 So most of what the agent benchmarks in this section actually reward — constant-factor speedups, better kernels, BLAS substitutions, parallelism — is by construction invisible here. The two literatures measure different things and neither substitutes for the other.
- Why it is the sharpest conceptual evidence in the log. Apple-picking predicts that a fixed body of problems yields a few large gains and a long tail of nothing, and that the reachable set depends on where you look. This is that prediction, measured across eight decades, without any AI in it — which cuts both ways: it is the strongest confirmation of the shape and the strongest evidence that the shape is normal rather than AI-induced. That reading is the log’s, not the authors’.
- Do not use MIT FutureTech’s summary of this paper. Its page reports “13%” and “30% to 45%”; the paper says 14% and 30%-43%.
- Dates: data cover algorithms discovered from the 1940s to 2019, counting improvement years “since 1940”; early access on or about 2021-09-20 (Crossref record created that day, MIT News released the same day); print issue Proceedings of the IEEE 109(11), November 2021, pp. 1768–1777. No preprint exists. Read 2026-07-26.
- Bears on: Q1 growth rate, Q5 returns, Q6 intertemporal, Q7 incidence.
- Links: DOI 10.1109/JPROC.2021.3107219 · accepted manuscript, CC BY
- Status: verified — full text read from the CC BY accepted manuscript, whose abstract matches IEEE Xplore. Both figures reproduced from that PDF. IEEE Xplore itself is behind a bot check, so the day-level online date is inferred rather than read.
1 Sherry and Thompson, §III Methods: “This ‘exact algorithm, exact solution’ criterion also excludes, amongst others, algorithms where solutions, and even in theory, are imprecise (e.g., detect parts of an image that might be edges) and algorithms with precise definitions but where proposed answers are approximate. We also exclude quantum algorithms from our analysis since such hardware is not yet available.” And on what counts as an improvement: “We assess that an algorithm has improved if the work that needs to be done to complete it is reduced, asymptotically. This, for example, means that a parallel implementation of an algorithm that spreads the same amount of work across multiple processors or allows it to run on a GPU would not count toward our definition.”
Bixby: LP and mixed-integer programming solver speedups (2012)
Independent (author is Gurobi’s founder, so read the Gurobi figures as vendor-adjacent). The canonical measurement of algorithmic progress in optimization solvers, and methodologically the cleanest in this log: he removed hardware from the comparison physically rather than statistically.
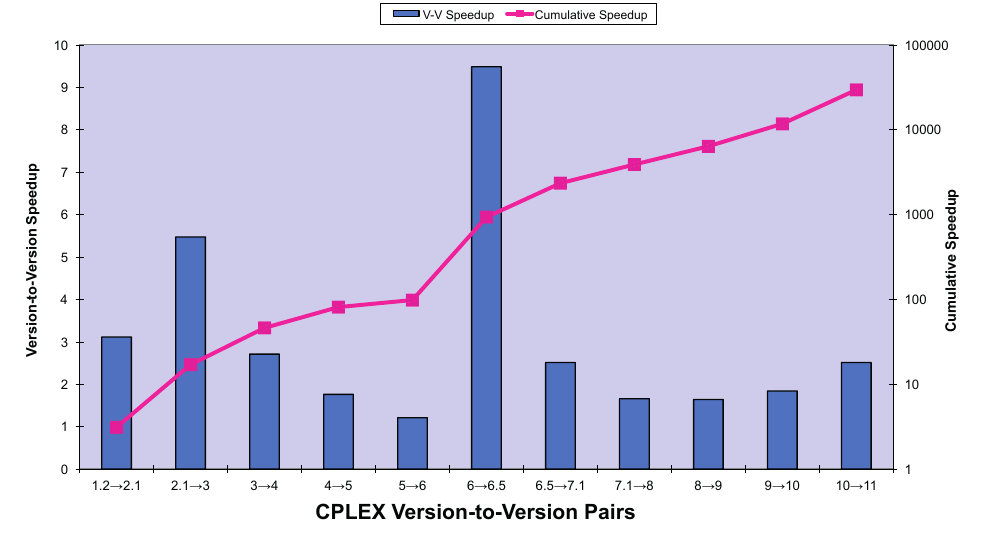
The chart from Bixby’s paper. Bars are the version-to-version speedups on the left axis; the line is their cumulative product on the right-hand log axis, ending near 30,000× at CPLEX 11. Bixby picks out two bars. The first, CPLEX 2.1 to 3.0, is “an improvement factor of nearly 5.5,” which “corresponds to the maturity of the dual simplex algorithm.” The second, CPLEX 6.0 to 6.5, “occurred in 1998, a speedup exceeding a factor of 10.0.” He also notes one exception to the pattern of steady gains: every version “with the arguable exception of CPLEX 6.0, represented a significant improvement over the previous version.”
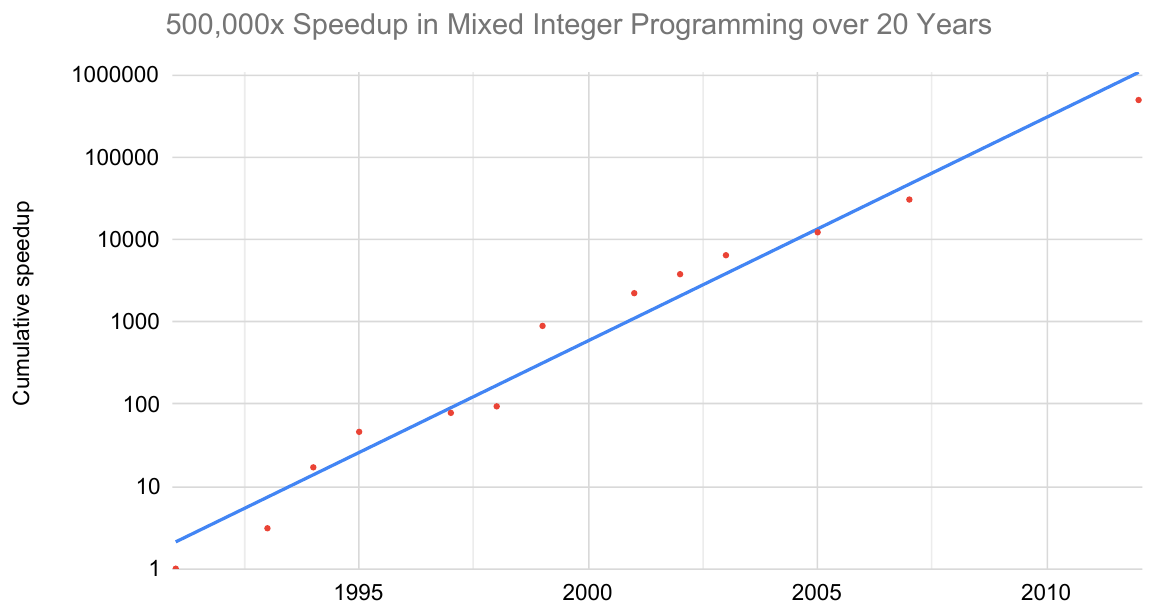
The same benchmark against calendar year rather than version pair, plotted by Hernandez and Brown and extended past Bixby’s 2007 test [→ Hernandez and Brown]. They read the slope as “a 2x speedup every 13 months,” and attribute the smoothness to aggregation: “The smooth progress is partially explained by the measure being an aggregation of many problems of varying difficulty.”
- The method is the reason to trust it. “In late 2007, I undertook a massive computational test using the CPLEX codes that had been released over the years… From this extensive library, a test set of 1892 representative models was selected. Using these models, and using a bank of identical computing machines, I recompiled each of the corresponding twelve CPLEX released versions – from Version 1.2 (the first version having MIP) through CPLEX 11 – to run on the target machine.” Every version faces identical hardware, so the ratio is machine-independent by construction, not by regression.
- MIP improved by a factor of over 29,000 from algorithms alone. “It was computed by multiplying the effects of the individual improvements, producing a projected, machine-independent improvement of a factor of over 29,000.”
- LP: 3300× algorithmic against 1600× hardware, 1988 to 2004. “In a period of sixteen years, from 1988 to 2004, by at least some measure, the average speed of at least one LP code – independent of any machine effects – improved by a factor of roughly 3300, far in excess of the improvements in the speed of computing machines over that same period; moreover, combining the effects of the algorithms and the machines gives an improvement factor exceeding six orders of magnitude.”
- The published table contains an arithmetic typo, in the original. The summary table gives “Algorithmic improvement (machine independent)… 3300×”, “Machine improvement: 1600×”, and “Total improvement (3300 · 2000): 5,280,000×”. The parenthetical says 2000 but the product is consistent with 1600 (3300 × 1600 = 5,280,000). Quote the row as printed and use 1600.
- The LP figure is reported here, not derived here. Bixby writes only that “In [7] I reported in detail on the overall improvements in the CPLEX LP code from 1988 through 2002, and subsequently updated these results in 2004.” The LP methodology lives in his 2002 Operations Research paper; only the MIP method is documented in this one. So the two headline numbers do not have equal evidentiary standing.
- His definition of “the algorithm” is generous, and he flags it. “Note that we have used here as our algorithm the best of barrier, primal, and dual. One can argue whether this is a legitimate approach, but it is the one that I have used. It means that, for each model in the test set, each of the three algorithms was run, and the solution time of the fastest of the three was taken as the solution time for the model.” Taking the per-instance minimum over three algorithms inflates the measured speedup relative to any single algorithm.
- Progress stopped, which is the part usually dropped when this paper is cited. “Since 2004 there have been essentially no improvements in the standard LP algorithms, means that LP is threatening in the future to again become a significant bottleneck in our ability to solve real-world problems of interest.” An eight-year plateau after a 3300× run is the apple-picking shape in a single well-studied problem, stated by the person best placed to know.
- Gains are lumpy, not smooth. “CPLEX 2.1 was approximately 3.1 times faster than CPLEX 1.2”; the CPLEX 3.0 jump was “nearly 5.5”, attributed to “the maturity of the dual simplex algorithm”; and “the second and by far the biggest improvement occurred in 1998, a speedup exceeding a factor of 10.0.” This is the same step-function pattern Sherry and Thompson chart [→ Sherry and Thompson], seen inside one product line.
- Do not propagate the combined MIP figure. He reports 16.2× more from Gurobi 1.0 to 5.0 “on top of the factor of 29,000,” but never multiplies them out; any ~470,000× attributed to him is a secondary-source computation.
- Dates: LP measurement spans 1988–2004; the MIP test was run in late 2007 over CPLEX versions released 1991–2007; the Gurobi extension covers 2009–2012. Published in Documenta Mathematica, Extra Volume: Optimization Stories (ISMP 2012), pp. 107–121; Crossref gives 2012-01-01 and the PDF’s embedded creation date is 2012-07-25, so cite the year only. Read 2026-07-26.
- Bears on: Q1 growth rate, Q5 returns, Q6 intertemporal, Q7 incidence.
- Links: DOI 10.4171/DMS/6/16 · open-access PDF
- Status: verified — full text read from the open-access PDF. Bixby founded Gurobi, so the Gurobi-era figures are self-reported; the CPLEX-era figures predate the company and are documented in method. Bixby’s own version-speedup chart is reproduced from his paper; the calendar-year plot of the same benchmark is reproduced from Hernandez and Brown.
Grace: algorithmic progress in six domains (2013)
Independent (MIRI technical report). The earliest attempt to put algorithmic progress and hardware progress on the same scale across unrelated fields. Preliminary by its own description, but it is where the “algorithms are worth about as much as hardware” figure originates.
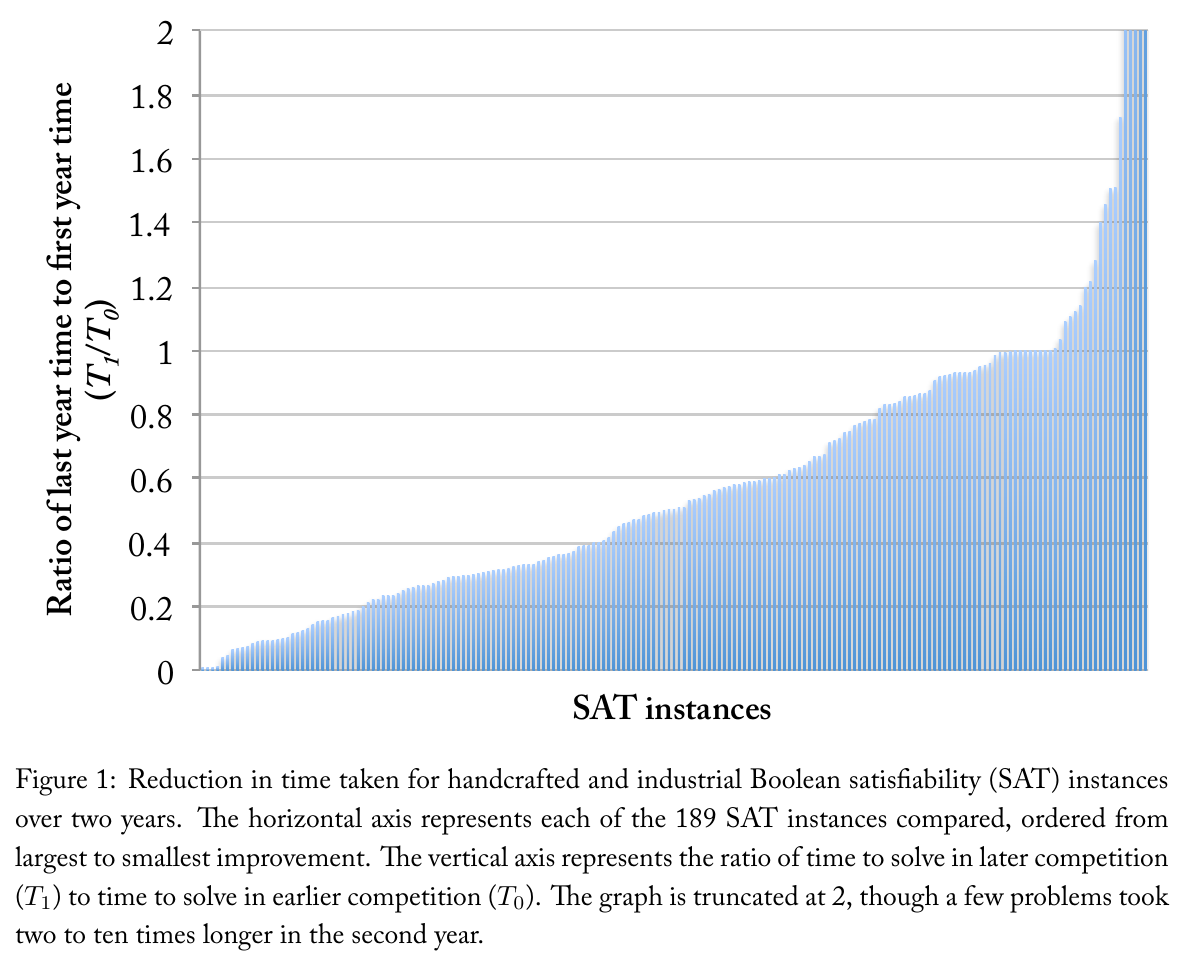
The report’s Figure 1. Each bar is one of 189 SAT instances solved in two consecutive competitions, plotted as the ratio of the later solve time to the earlier one and ordered from largest improvement to smallest; the axis is truncated at 2, though Grace notes “a few problems took two to ten times longer in the second year.” Her reading of the distribution: “the distribution is almost uniform between zero and one, with a small fraction taking much longer than before. There is a flat spot: around six percent of problems’ times changed by less than one percent between years.” Bars above 1 are instances that got slower.
- The headline, with its hedge attached. “We examine evidence of progress in six areas of algorithms research… Many of these areas appear to experience fast improvement, though the data are often noisy. For tasks in these areas, gains from algorithmic progress have been roughly fifty to one hundred percent as large as those from hardware progress. Improvements tend to be incremental, forming a relatively smooth curve on the scale of years.”
- The six domains, from the report’s own section headings. Boolean satisfiability; game playing (chess and Go); factoring; physics simulations; operations research (linear and mixed-integer programming, and scheduling); machine learning. Secondary summaries disagree — AI Impacts splits chess from Go and drops physics simulations, MIRI’s announcement collapses operations research to mixed-integer programming — so use the report’s headings.
- Per-domain rates. SAT solvers “5–15% per year, depending on the type of problem”; chess “around fifty Elo points per year over the last four decades”; Go “about one stone per year for the last three decades”; factoring “about 5.5 digits per year for the last two decades”; MIP algorithms “have roughly doubled in speed each year”; and machine learning has had “steeply diminishing progress in percentage accuracy over recent decades.”
- The author’s own selection warning is the most valuable thing in the report. Grace states plainly that her sample is biased optimistic.2 That applies with full force to this log, which is built almost entirely out of benchmarks chosen because something interesting happened on them.
- She flags her own retrospective-versus-prospective problem in the SAT data. “In recent Boolean satisfiability (SAT) competitions, SAT solver performance has increased 5–15% per year… However, these gains have been driven by widely varying improvements on particular problems. Retrospective surveys of SAT performance (on problems chosen after the fact) display significantly faster progress.” Same field, and the measured rate depends on when the problems were picked.
- She is similarly careful about MIP, which is the fastest number in the report. MIP “is an important optimization problem, but one which has been called to attention after the fact due to performance improvements. Other optimization problems have had more inconsistent (and harder to determine) improvements.”
- It is explicitly a first pass. “This has been a preliminary survey,” and the introduction calls it “a collection of first glances… This paper will neither analyze the data extensively nor attempt to point out all of its interesting implications.” There are no confidence intervals anywhere in it; the “low confidence” description that circulates comes from AI Impacts, not from Grace.
- Her CPLEX test-set size differs from Bixby’s. Grace reports CPLEX “versions 1.2 to 11.0, released in 1991 to 2007” tested on 1,852 MIP problems, citing a 2010 Bixby talk; the 2012 paper says 1892 [→ Bixby]. Probably different presentations of the same experiment, but quote whichever document you are using.
- Dates: released on or about 2013-08-03 (the LessWrong announcement is timestamped 2013-08-03 02:29:21Z and opens “Today MIRI released a new technical report”; the MIRI newsletter of 2013-08-13 also announces it), revised 2013-12-09, which is the only date printed inside the document. MIRI’s own announcement post carries no retrievable date stamp. Read 2026-07-26.
- Bears on: Q1 growth rate, Q7 incidence, Q8 benchmarks.
- Links: PDF · AI Impacts summary
- Status: verified — full report read. Note that it is a 2013 technical report with no peer review and no journal version. Figure reproduced from the source.
2 Grace, §3.3 “On Selection”: “The most salient algorithmic problems might be those for which progress is particularly fast (or slow), so looking at algorithms that are being reported on might give us a biased impression of the overall rate of progress.” And: “In many cases, we should treat estimates as being optimistic rather than representative. We should rely more on assessments that are planned in advance of knowledge about performance. Competitions are better than retrospective analyses, and problems that were singled out early are better than problems that were selected after some progress.” And: “That which is easily measured may improve faster than more nebulous qualities, particularly if such measures are being used to guide progress. Yet we may care about the nebulous qualities. […] Thus, progress on well-defined metrics, such as most of what we will examine here, will tend to overestimate the progress we care about.”
The SAT Museum: thirty years of solvers on one machine (2023)
Independent (academic: Biere, Fleury, Froleyks, and Heule). Historic SAT solvers recompiled and re-run on identical hardware, which makes the measured gain pure software — the same method Bixby used for CPLEX [→ Bixby], applied to an open competition series rather than one product line. It is the best pre-LLM algorithmic-progress baseline in the log for the shape of progress, and it settles a live dispute about whether the progress happened at all.
- The design, which is why it can be trusted. “The virtual SAT Solver Museum is an effort towards preserving historical SAT solvers, by collecting and porting their source code to modern compilers and evaluating them on representative benchmark sets on the same hardware. This allows us to compare historic and modern solvers in the same environment. Our results clearly show a remarkable improvement of SAT solver performance in the last 30 years.”
- Progress is mostly slow, with jumps every three to five years. “While in general we see a big improvement in solver performance in these 30 years across all considered benchmark sets, the yearly improvement is mostly rather slow, except for performance jumps in some years, which arguably happen with a frequency of 3 to 5 years.” The jumps are attributed to specific techniques: “one when preprocessing was introduced around 2006 and a second inconsistent one: 2019 on 2021/2022 benchmarks and 2016 on older benchmark sets,” the latter “attributed to a combination of local search (after 2019 in CaDiCaL and Kissat), rephasing (after 2016), and more aggressive bounded variable elimination.”
- They are refuting a claim that gets made about this field. “It has been stated that ‘No major performance breakthrough [happened in SAT solving] in close to two decades’.” Their verdict: “Clearly, our presented results disprove the false view discussed in the introduction that there was no major progress in SAT solving in the last 20 years.”
- They control for benchmark-selection bias explicitly, which almost nothing else here does. “We run on the same hardware (from 2016) all collected and patched solvers on six benchmark sets from SAT competitions spanning more than two decades, namely 2002, 2011, 2019, 2020, 2021, and 2022. We report results on each set separately, in order to address an argument brought forward by Laurent Simon at a recent POS workshop, that the benchmark selection method of more recent competitions might give a bias towards newer solvers … Our data on the SAT Competition 2011 benchmark set refutes this argument as it clearly shows the same solver progress which we observed in other years.”
- Their own contamination caveat, which is the same problem the AI benchmarks have. “Regarding results we want to stress again that SAT solver developers train on previous competitions: The winner of the 2022 competition is based on the winner from 2021, had access and most likely has been trained on the 2021 benchmarks to find better heuristics than its predecessor from 2021, which has not been trained on them nor on more recent problems sets.”
- Their own limitation. “one nagging remaining issue with our work is that we do not provide a deeper understanding about the differences between solvers and whether all implemented techniques are useful.”
- No headline speedup factor exists, and this entry does not invent one. Results are reported as cumulative distribution functions rather than as a multiple, so any instances-solved count has to be read off the paper’s figures. The experimental setup, needed before reusing anything: “We ran all the benchmarks on 8-core Intel Xeon E5-2620 v4 CPUs running at 2.10 GHz (turbo-mode disabled) with a memory limit of 127 GB and a time limit of 5 000 seconds as in recent SAT competitions even though on slightly slower hardware.”
- Dates: presented at the 14th International Workshop on Pragmatics of SAT, 2023; published in CEUR-WS Vol-3545, dated 2023. Precursors include a 2020 workshop lightning talk. No arXiv version. Read 2026-07-26.
- Bears on: Q1 growth rate, Q4 expertise, Q6 intertemporal, Q7 incidence.
- Links: PDF · project page and solvers
- Status: verified — full text extracted from the PDF and all quotes read from it, retrieved 2026-07-26. A workshop paper rather than a refereed journal article, and the solved-instance counts are in figures rather than in text.
Hernandez and Brown: measuring the algorithmic efficiency of neural networks (2020)
Independent (OpenAI). The first paper to define algorithmic progress as compute-to-reach-a-fixed-past-capability, which is the measurement convention almost everything else in this section inherits.
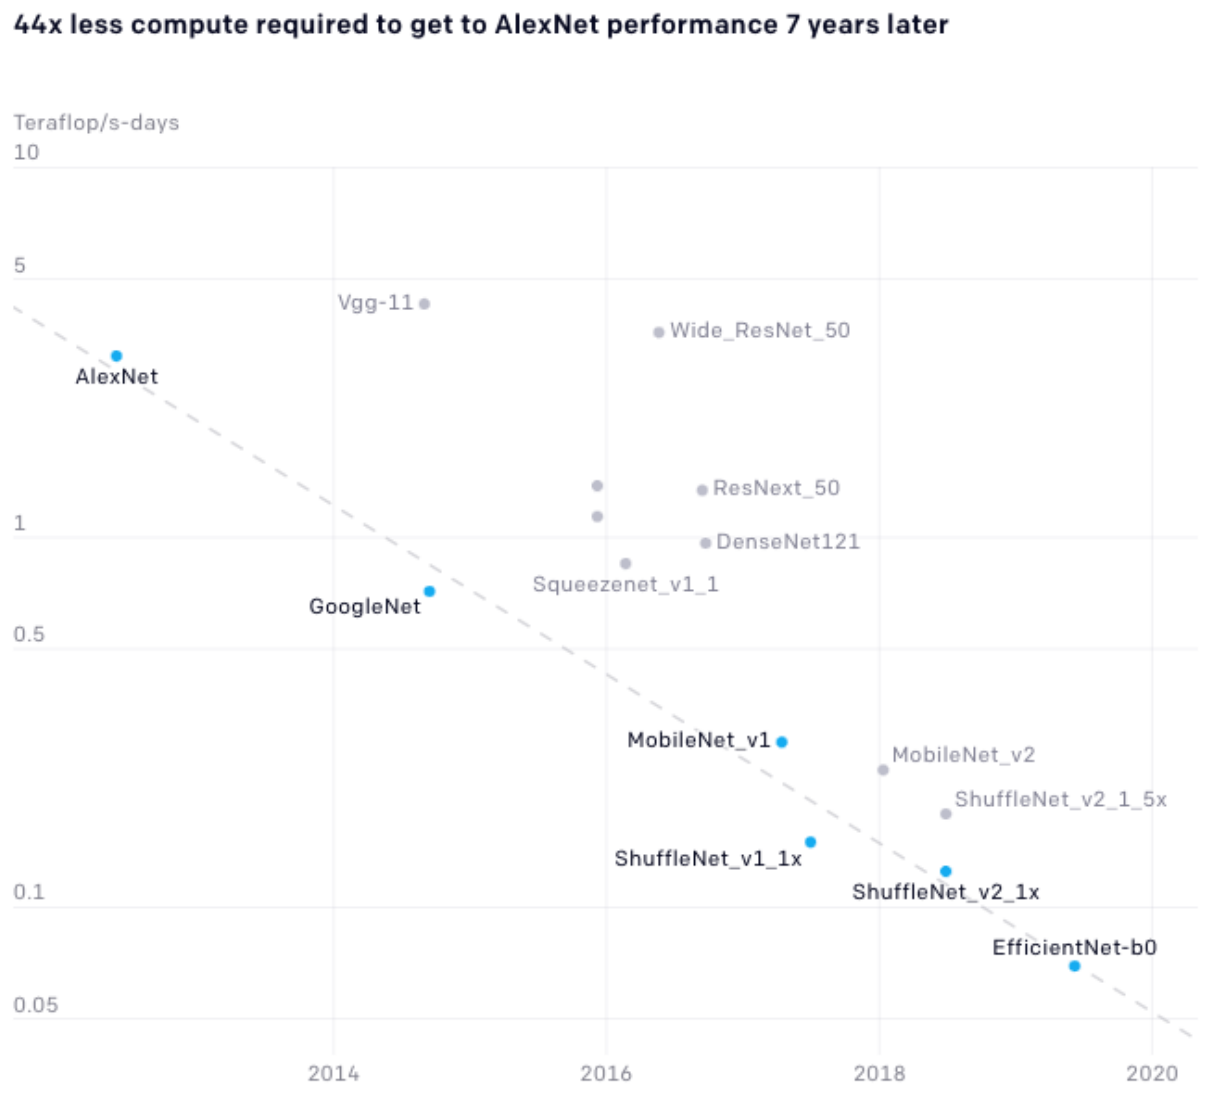
The paper’s Figure 3, titled “44x less compute required to get to AlexNet performance 7 years later.” Blue points are the lowest-compute model measured at any given time and grey points are all other models measured; the vertical axis is training compute in teraflop/s-days, held to a fixed accuracy target. The authors read the frontier as “an efficiency doubling time of 16 months.” They also flag that the target is sensitive to how far the original AlexNet was trained: at 62 epochs rather than 90, “we would have calculated the overall algorithmic efficiency gain as 30x rather than 44x.”
- The framing, which is the contribution. “Algorithmic progress has traditionally been more difficult to quantify than compute and data. In this work, we argue that algorithmic progress has an aspect that is both straightforward to measure and interesting: reductions over time in the compute needed to reach past capabilities.” Fixing the capability and letting cost fall is what makes an efficiency series comparable to a cost curve.
- The headline. “The number of floating-point operations required to train a classifier to AlexNet-level performance on ImageNet has decreased by a factor of 44x between 2012 and 2019. This corresponds to algorithmic efficiency doubling every 16 months over a period of 7 years.”
- Algorithms beat hardware over the same window. “By contrast, Moore’s Law would only have yielded an 11x cost improvement.” The authors decline to treat these as rivals: “hardware and algorithmic efficiency gains multiply and can be on a similar scale over meaningful horizons, which suggests that a good model of AI progress should integrate measures from both.”
- The headline figure is sensitive to a judgement call the authors flag themselves. Training AlexNet to convergence rather than to its near-final accuracy inflates the baseline.3 So the defensible range is 30–44×, and the 16-month doubling is the top of it.
- Thin data, and they say so. “We only have a small number of algorithmic efficiency data points on a few tasks,” with the main result “primarily based on existing open source re-implementations of popular models.”
- Why it is in this section. It is the earliest dated point in the efficiency-measurement series, it covers a period that ends before the agent era begins, and its 16-month doubling is almost exactly the transistor cost curve’s 17 months — a coincidence worth noticing but not over-reading.
- Dates: data span 2012–2019; arXiv 2020-05-08; no later version. Retrieved and read 2026-07-26.
- Bears on: Q1 growth rate, Q5 returns.
- Links: arXiv 2005.04305
- Status: verified — abstract and body read from the arXiv PDF. The OpenAI blog version is behind a bot check and was not usable. Figure 3 reproduced from the source.
3 Hernandez and Brown, §5: “It only took 62 of the 90 epochs for AlexNet to train to 78.8% top 5 accuracy on ImageNet (99.6% of the 79.1% final accuracy). So if the original AlexNet had only been trained for 62 epochs, we would have calculated the overall algorithmic efficiency gain as 30x rather than 44x. We don’t think it’s tractable to mitigate this confounder without adding a lot of complexity to explaining the measurement, but it seemed important to flag as a limitation of our approach.”
Erdil and Besiroglu: algorithmic progress in computer vision (2022)
Independent (Epoch AI). The ImageNet counterpart to the language-model estimate, by overlapping authors and a similar method, which is why the two should not be treated as independent confirmations.
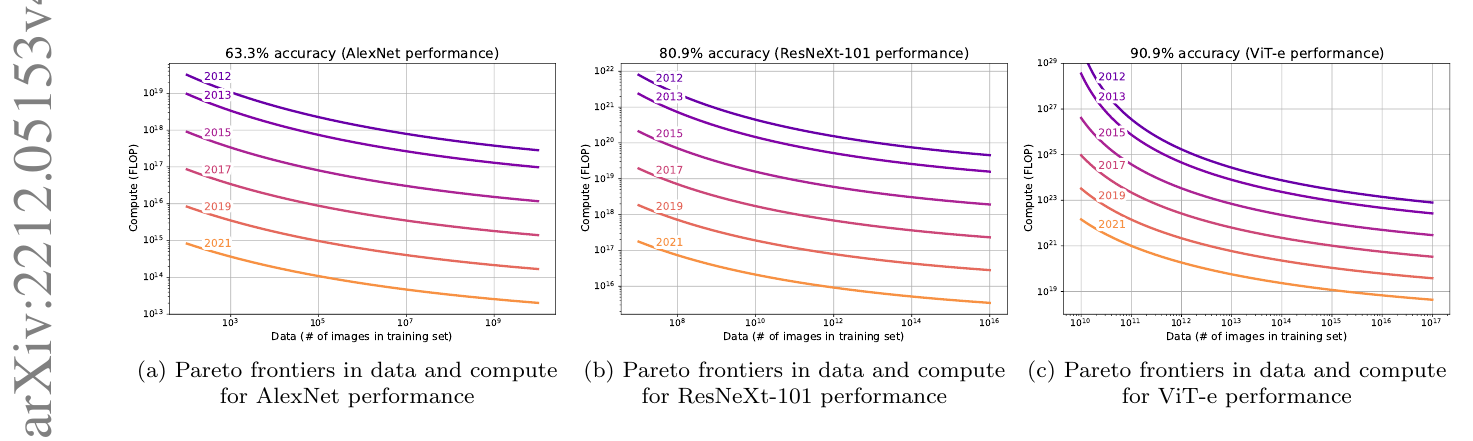
The paper’s Figure 1. Each curve traces the combinations of compute and training-set size sufficient to reach a fixed performance level in a given year, for three targets: AlexNet, ResNeXt-101, and ViT-e. The curves shift down and left from 2012 to 2021, which is algorithmic progress measured with the performance target held constant. The paper’s estimate is that compute-augmenting innovations “halve compute requirements every nine months (95% confidence interval: 4 to 25 months).”
- Compute requirements halve about every nine months. “We estimate that compute-augmenting innovations halve compute requirements every nine months (95% confidence interval: 4 to 25 months).” The interval is very wide — wide enough to contain both “faster than anything in the historical record” and “slower than Moore’s law.”
- Algorithms and compute contributed roughly equally. “Using Shapley values to attribute performance improvements, we find that algorithmic improvements have been roughly as important as the scaling of compute for progress computer vision.” Note this differs from the language-model finding, where compute dominated [→ Epoch on LMs] — same method, same group, opposite verdict on which input mattered more.
- The split shifts over the period, which is the more useful fact. The equal-importance result comes “with the caveat that algorithmic progress was more crucial in early years, and compute scaling more important in later years.” A rising compute share as a field matures is what apple-picking predicts if the cheap algorithmic fruit goes first, though the paper draws no such inference.
- Progress is compute-augmenting, not data-augmenting. “Algorithmic innovations mostly take the form of compute-augmenting algorithmic advances (which enable researchers to get better performance from less compute), not data-augmenting algorithmic advances.” The authors then withdraw part of the interpretation: “while our parameter estimates suggest algorithmic innovations are more effective at augmenting compute budgets relative to data budgets, these estimates alone do not necessarily imply this is also the primary mechanism through which algorithmic innovation improve performance.”
- The model is noisy and the authors are direct about it. “The model has high uncertainty in some situations, both due to the parameter uncertainty and due to the noise that’s built into the model.”
- It also supplies a secondhand summary of Grace (2013). The paper reports that Grace “investigates algorithmic progress in six domains (SAT solving, Game Playing, Factoring, Physics Simulations, Operations Research, and Machine Learning) and finds that, while the data is often noisy, gains from algorithmic progress have been roughly fifty to one hundred percent as large as those from hardware progress.” That is a secondary characterization; the primary report has not been read here.
- Dates: arXiv 2022-12-10, current version v4 2023-08-24, read 2026-07-26. The estimate predates the agent era entirely.
- Bears on: Q1 growth rate, Q5 returns, Q7 incidence.
- Links: arXiv 2212.05153
- Status: verified — abstract and body read from the ar5iv HTML. Figure reproduced from the source.
Epoch AI: algorithmic progress in language models (2024)
Independent (research organization, peer-reviewed). Ho, Besiroglu, Erdil, Owen and co-authors fit augmented scaling laws to over 200 language model evaluations on WikiText and Penn Treebank spanning 2012–2023, estimating how fast the compute needed to reach a fixed performance threshold falls. (An earlier version of this entry credited the paper to Erdil and Besiroglu; Anson Ho is first author of a nine-author paper.) This is the best-measured algorithmic-efficiency curve in the algorithms domain, and the reference point for what a research-efficiency series looks like when someone builds one properly.
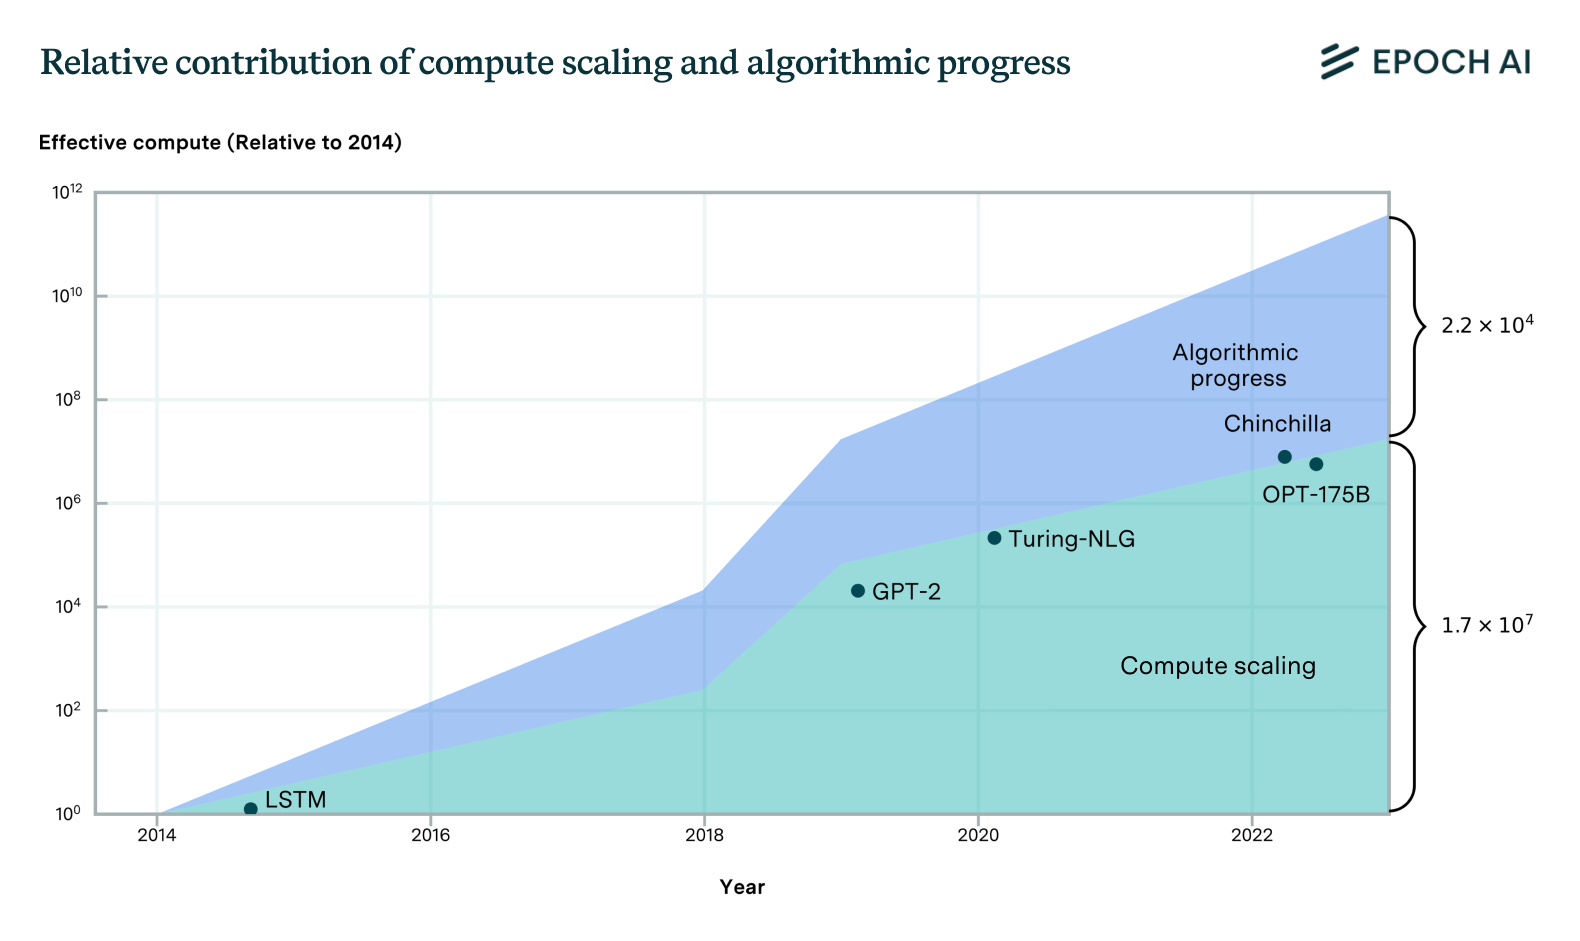
Compute scaling contributed a factor of about \(1.7\times10^{7}\) against algorithmic progress at about \(2.2\times10^{4}\) — so even the best-measured algorithmic-efficiency curve is a small share of observed capability gains, and it is measured over a period ending before agents.
- Compute to reach a fixed performance level halves roughly every 8 months. The abstract states it precisely: “using a dataset of over 200 language model evaluations on Wikitext and Penn Treebank spanning 2012-2023, we find that the compute required to reach a set performance threshold has halved approximately every 8 months, with a 95% confidence interval of around 5 to 14 months, substantially faster than hardware gains per Moore’s Law.”
- The published confidence intervals disagree between versions. The arXiv abstract gives “a 95% confidence interval of around 5 to 14 months”; the NeurIPS 2024 version reports a 90% interval of about 2 to 22 months. Quote the median and treat the interval as wide. This log has not established which interval supersedes the other.
- Most observed progress came from scale, not algorithms — and the authors say so themselves. “Despite the rapid pace of algorithmic progress and the development of new architectures such as the transformer, our analysis reveals that the increase in compute made an even larger contribution to overall performance improvements over this time period.” A Shapley decomposition attributes 60–95% of gains to compute and data and 5–40% to algorithmic innovation, with the algorithmic share falling as compute scaling accelerated after about 2018; those shares come from the Epoch summary page rather than the abstract.
- Two named innovations are sized in time-equivalent units. The transformer is worth almost two years of algorithmic progress; Chinchilla scaling laws are worth 8 to 16 months. From the Epoch summary rather than a full read.
- A direct check broadly agrees. Matching Megatron-LM or GPT-2 level performance required 5- to 100-fold less compute per year by 2023, implying a halving time the arXiv version puts at 6–15 months and the NeurIPS version at 11–17 months.
- The authors’ own limitation. “Though limited by noisy benchmark data, our analysis quantifies the rapid progress in language modeling, shedding light on the relative contributions from compute and algorithms.” The hedge is the first clause.
- Scope caveat: this is the pre-agent baseline, not a measurement of AI’s contribution. It covers pretraining only, ends in 2023, and uses perplexity benchmarks, so it describes the efficiency curve that AI research agents would have to bend, not any bending they have done. This log’s framing, not the paper’s.
- Dates: evaluations span 2012–2023; arXiv 2024-03-09; NeurIPS version December 2024; retrieved 2026-07-26.
- Bears on: Q1 growth rate, Q8 benchmarks.
- Links: Epoch summary · arXiv · NeurIPS 2024 PDF
- Status: verified-abstract — checked against the arXiv abstract, the Epoch summary page, and the NeurIPS abstract, retrieved 2026-07-26. The decomposition figure above is Epoch’s own chart from the summary page. The body figures above (Shapley shares, transformer and Chinchilla equivalents, direct-check halving times) come from those pages rather than a full read of the paper, and the interval discrepancy between versions is unresolved.
Gundlach and co-authors: the 22,000× is reference-dependent (2025)
Independent (academic). “On the Origin of Algorithmic Progress in AI” reruns the innovations behind the measured 2012–2023 efficiency gains at small scale and finds the headline number is not a scale-free constant. It audits the instrument that this section’s efficiency estimates share, which is why it sits here rather than with the cross-cutting measurement entries.
- The claim, from the abstract. “Algorithms have been estimated to increase AI training FLOP efficiency by a factor of 22,000 between 2012 and 2023 [Ho et al., 2024]. Running small-scale ablation experiments on key innovations from this time period, we are able to account for less than 10x of these gains.”
- Where the gains actually sit. “we account for 6,930x efficiency gains over the same time period, with the scale-dependent LSTM-to-Transformer transition accounting for the majority of gains. Our results indicate that algorithmic progress for small models has been far slower than previously assumed, and that measures of algorithmic efficiency are strongly reference-dependent.”
- What this does to the entries around it. The 8-month halving time [→ Epoch on LMs] and the nine-month vision estimate [→ Erdil and Besiroglu] are measured at particular reference scales; this result says the measured rate would differ at a different scale. It does not overturn the direction of progress, but it removes the licence to quote any single halving time as the rate. This reading is the log’s.
- Dates: arXiv 2025-11-26.
- Bears on: Q1 growth rate, Q8 benchmarks.
- Links: arXiv 2511.21622
- Status: verified-abstract — quotes checked against the arXiv abstract, retrieved 2026-07-28. The ablation experiments themselves were not examined.
Epoch AI: LLM inference price declines (2025)
Independent (research organization). The deployment-cost counterpart to the pretraining-efficiency curve, and the one efficiency series in the log already denominated in money per unit of capability. Its spread is so wide that the entry is as much a warning about the measurement as a rate.
- The rate is a range spanning two orders of magnitude, not a number. “The rate of decline varies dramatically depending on the performance milestone, ranging from 9x to 900x per year.” One anchored case: “The price to achieve GPT-4’s performance on a set of PhD-level science questions fell by 40x per year.”
- The estimate depends heavily on the window chosen. “When we removed all model data before January 2024…the median rate increased from 50x per year to 200x per year.” A fourfold move in the median from a window choice is the reason no single figure from this entry should be quoted as the rate.
- Epoch’s own hedge on persistence. “The fastest price drops in that range have occurred in the past year, so it’s less clear that those will persist.”
- What it is and is not evidence about. Falling inference price is a joint product of hardware, algorithmic efficiency, competition, and margin decisions, so it is not a measurement of algorithmic progress and still less of AI’s contribution to research. It matters for Q5 and Q6 in a different way: it is the price of the input whose returns the argument is asking about, and it fell fast over exactly the period the cyber entries measure. This framing is the log’s.
- Dates: published 2025-03-12; the underlying model-price data run to early 2025. Retrieved 2026-07-26.
- Bears on: Q1 growth rate, Q5 returns, Q6 intertemporal.
- Links: Epoch data insight
- Status: verified — quotes and publication date checked against the Epoch page, retrieved 2026-07-26. The underlying price database was not inspected.
Agent-era record series
Gurobi: the vendor’s fixed-machine speedup series (2009–2025)
Vendor (Gurobi release announcements and its own performance page; all measurements vendor-run). The only MIP series that reaches the agent era, and it does so exactly as the independent alternative disappears. Methodologically it is Bixby’s design — every released version rerun on one machine — run by the company he founded [→ Bixby].
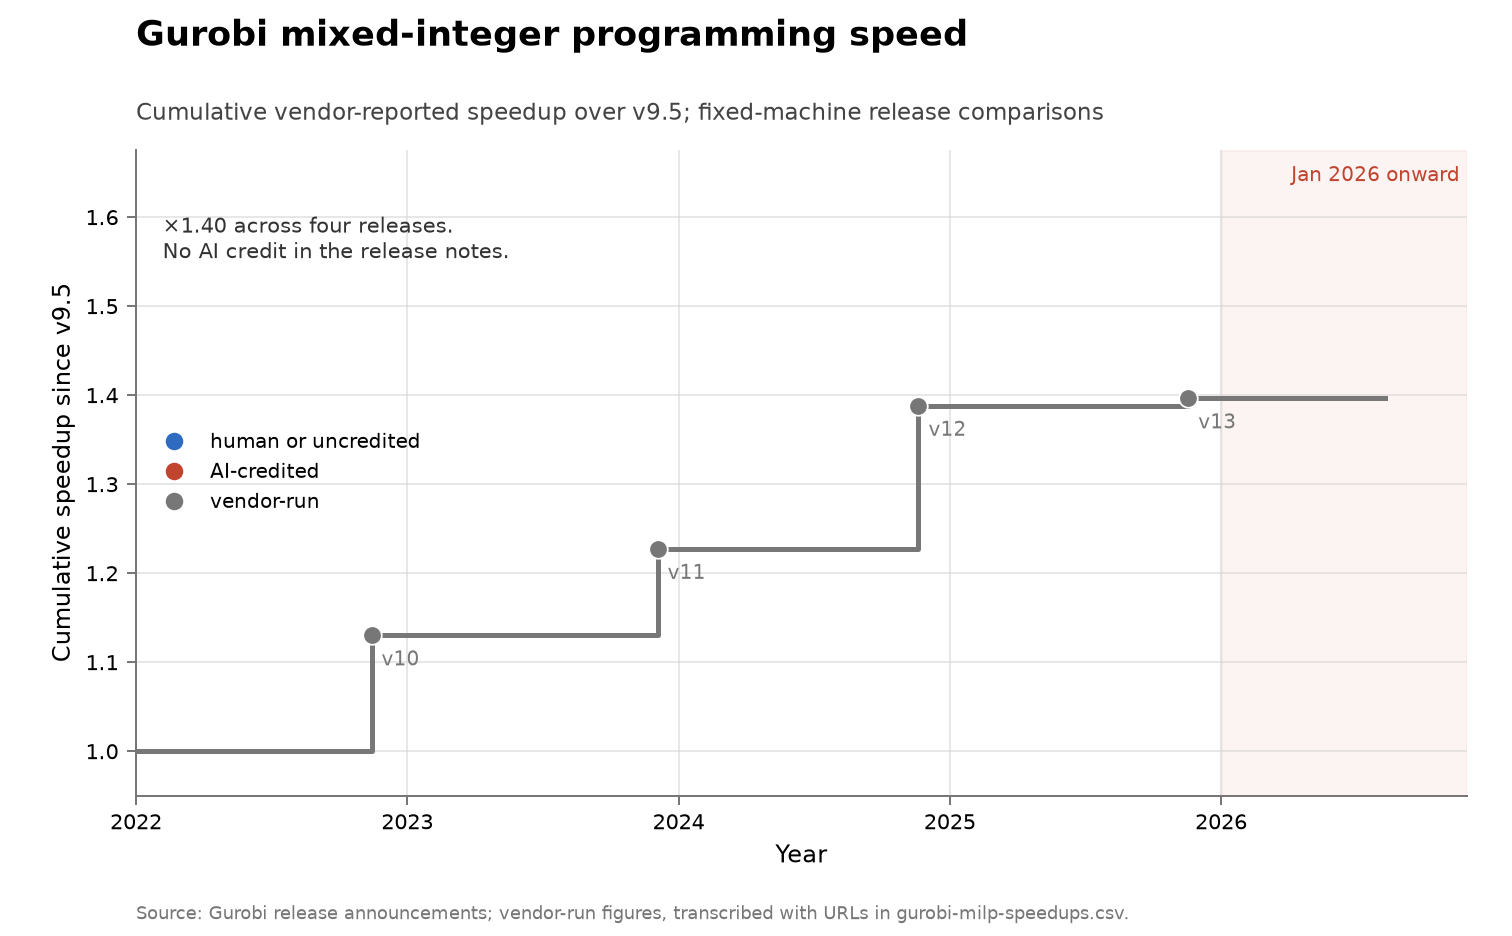
- The method, quoted from the performance page. “The test set consists of all models that can be solved by at least one version Time limit: 10000 sec. Intel Xeon CPU E3-1240 v5 @ 3.50GHz 4 cores, 8 hyper-threads 32 gb ram Test set has 9423 models: – 960 discarded due to inconsistent answers – 2641 discarded due that none of the versions can solve – speed-up measured on > 100s bracket: 3517 models.” Machine-independent by construction, but the models are vendor-selected and the tests vendor-run.
- The cumulative claim moved from 75× to 92× across the agent era. The version-10-era page says “a more than 75x speedup on MILP since version 1.1” (2022); by the version-13 era the same page says “A 92x speed-up over version 1.1 in geometric mean (PAR-10) of runtimes” (captures of 2025-12-10 through 2026-04-04).
- The recent per-version MILP gains are 8–13% a year. From the release announcements: 13% overall for version 10 (2022), 8.6% for version 11 (2023), 13.1% for version 12 (2024), 8.2% for version 13 (2025), each larger on the over-100-second bracket. Against the early history — Grace recorded MIP algorithms as having “roughly doubled in speed each year” [→ Grace], and Bixby’s 1991–2007 test multiplied to 29,000× [→ Bixby] — the rate has fallen by an order of magnitude or more, on the vendor’s own numbers. The comparison is the log’s.
- No AI attribution anywhere. The version 11, 12 and 13 announcements (2023–2025) credit no AI or LLM involvement in any solver improvement; the large recent gains are in nonconvex problem classes (“a 5.8x speed-up on nonconvex MIQCP”, version 11).
- The independent check ended in August 2024. Hans Mittelmann’s benchmark page: “END OF A BENCHMARKING ERA … Through an action by Gurobi at the 2018 INFORMS Annual Meeting this has come to an end. IBM and FICO demanded that results for their solvers be removed. … In August 2024 Gurobi decided to withdraw from the benchmarks as well and their results have been removed.” So over exactly the window where an agent-era bend would show, the only remaining MIP series is the vendor’s. The timing observation is the log’s.
- The LP baseline inconsistency, now resolved against fourteen page captures. The version-12-era page (earliest capture carrying the number: 2025-08-07, not 2025-03-12 as an earlier version of this entry said) gives LP “a 45x speed-up over version 9.0”; every version-13-era capture (2025-12-10 through 2026-04-04) gives “a 44x speed-up over version 1.1”. Version 1.1 is the correct baseline: the methodology note under the claim in both eras reads “Default settings: Gurobi 1-4: dual simplex Gurobi 5+: concurrent LP,” which only makes sense for a series starting at version 1; the adjacent nonconvex-MIQCP section is legitimately baselined at 9.0 (where that problem class was introduced), the likely source of the copy error; and 45×-since-9.0 with 44×-since-1.1 cannot both hold. Quote the version-13 wording. The MILP trajectory 75× → 91× → 92×, always “since version 1.1,” is confirmed in every capture.
- One remaining unverified date. Version 1.0’s commonly cited 2009 release date was not verified against any primary Gurobi page; the vendor’s own support table starts at version 7.0 (2016).
- Dates: version 10.0 announced 2022-11-14, 11.0 2023-12-04, 12.0 2024-11-19, 13.0 2025-11-18; cumulative figures read from fourteen page captures dated 2023-03-21 to 2026-04-04; Mittelmann’s page read 2026-07-28.
- Bears on: Q1 growth rate, Q7 incidence, Q8 benchmarks.
- Links: performance page · release history · version 13 announcement · Mittelmann benchmarks
- Status: unverified as measurement; vendor — quotes read from the announcements (some via archive captures and wire-service mirrors) and from dated captures of the performance page, retrieved 2026-07-28. The per-version charts for versions 2 through 9 are images that were not transcribed, and nothing here was independently rerun.
Compression records: the Hutter Prize and the Large Text Compression Benchmark (2006–2026)
Independent (a standing cash prize administered by Marcus Hutter; a reference leaderboard maintained by Matt Mahoney). The longest-running fixed-task efficiency series in this log that is still moving, and the metric the argument names as compression’s standing version. Both series run through the agent era; every record in both is human.
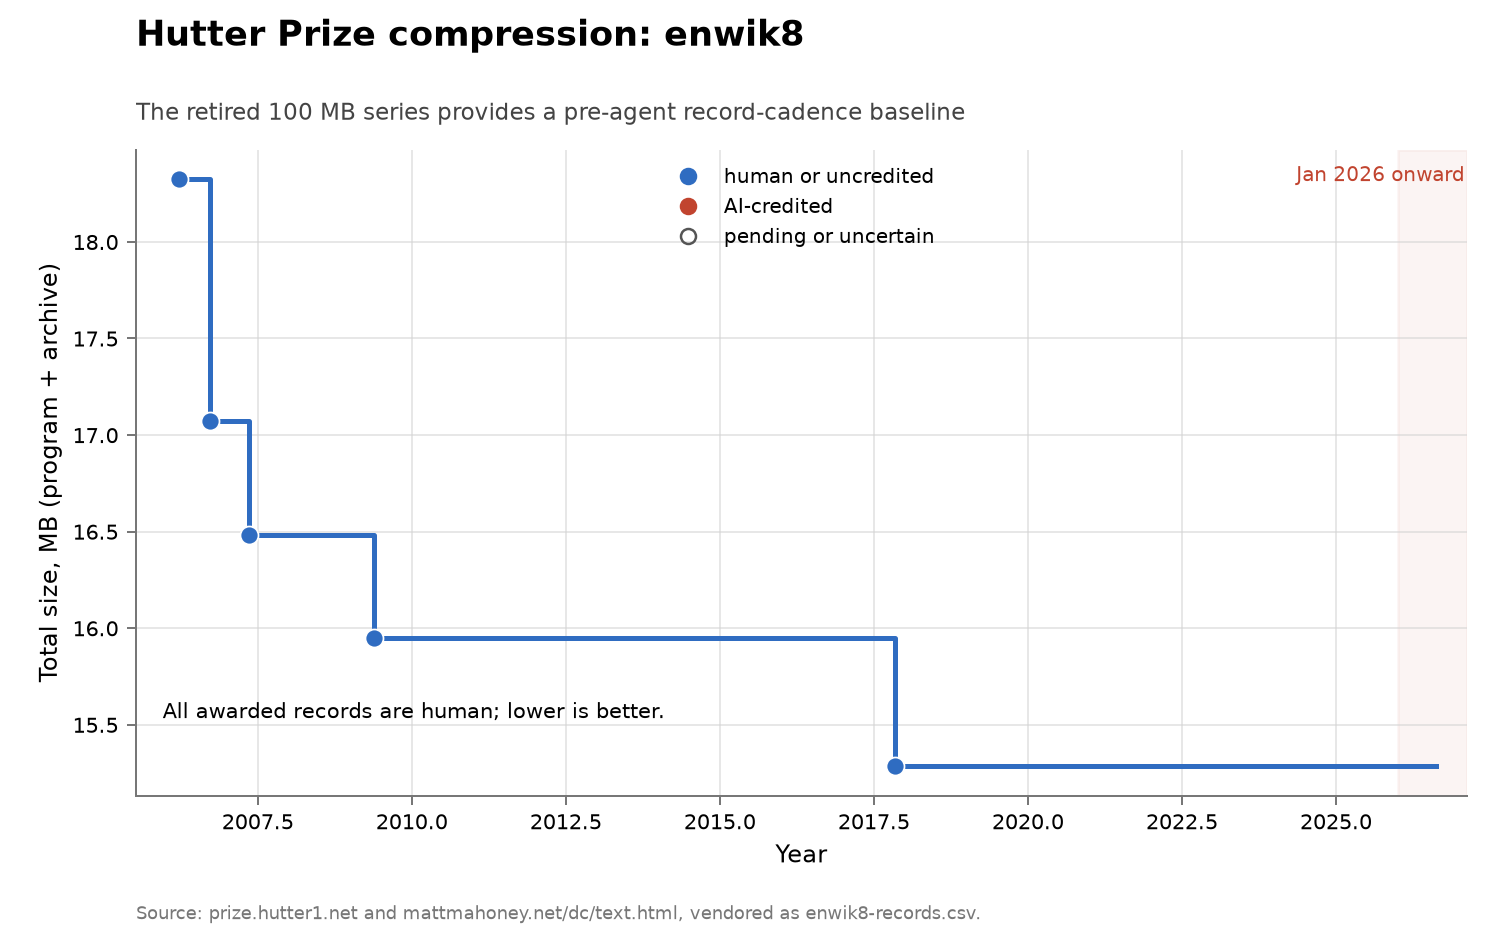
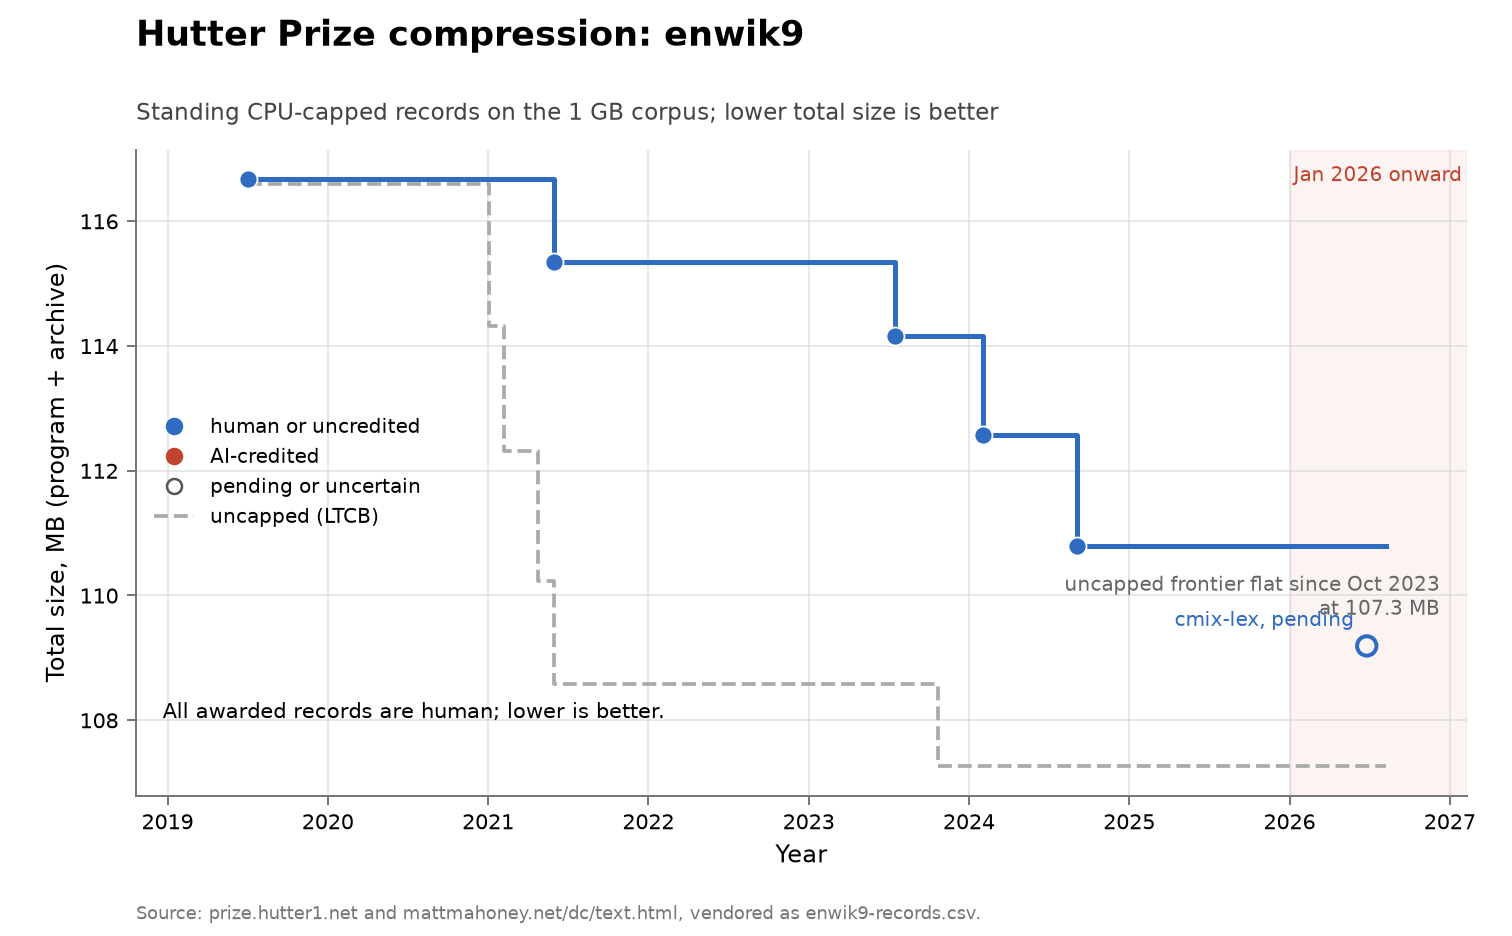
Left: the prize on enwik8 — a 2006 baseline, then four awarded records through 2017. Right: the prize since its 2020 move to enwik9, with awarded records in 2021, 2023 and twice in 2024, and the pending 2026 entry as an open dot; the dashed grey line is the Large Text Compression Benchmark’s unconstrained best, unmoved since October 2023. Values are total size, compressor plus archive, in megabytes.
- The task, in the benchmark’s words. “This competition ranks lossless data compression programs by the compressed size (including the size of the decompression program) of the first 10^9 bytes of the XML text dump of the English version of Wikipedia on Mar. 3, 2006.” A fixed corpus, so the series has no benchmark drift by construction.
- The prize’s resource cap, which makes it the constrained series. “Restrictions: Must run in ≲50 hours using a single CPU core and <10GB RAM and <100GB HDD on our test machine.” GPUs are excluded from the prize; the benchmark leaderboard has no such cap and admits GPU and TPU compressors.
- The record cadence. enwik8: 18,324,887 bytes (2006 baseline) to 15,284,944 (2017) over four awarded records, all by Alexander Rhatushnyak. enwik9, since the 10× expansion of 2020-02-21: 116,673,681 (2019 baseline), then 115,352,938 (2021), 114,156,155 (2023), 112,578,322 (2024-02), 110,793,128 (2024-09). The prize pays only for improvements of at least 1%, and the awarded steps have run 1.0–1.6%.
- The agent-era movement is human. The 2024 records are fx-cmix (Kaido Orav) and fx2-cmix — “News: Kaido Orav & Byron Knoll are the eighth Winners! Congratulations!” A pending 2026 entry, cmix-lex, appears on the benchmark page — “cmix-lex is a Hutter prize entry by Ibrahim Marcouch, announced on June 26, 2026” — at 109,190,109 bytes, below the prize’s 1% hurdle of 109,685,197, but it is not an awarded record on the prize site as read.
- No record in either series credits AI authorship. Neural compressors are common — the unconstrained leader nncp “uses a transformer architecture” and cmix has carried an LSTM since 2016 — but a hand-written neural compressor is not an AI-written one, and no entry on either page claims LLM or agent authorship. The distinction, and the search for such claims, are the log’s.
- The unconstrained frontier has been still for the whole agent era. The benchmark’s best total has not moved since nncp v3.2 (Fabrice Bellard, 107,261,318 bytes, 2023-10-23), despite active submissions below it through 2024–2026 (cmix v21, fx2-cmix, gmix, jax-compress, cmix-lex). Three years of stall on an uncapped, GPU-permitted, cash-adjacent task across exactly the period of fastest AI capability growth is the sharpest single absence in this section. The observation is the log’s.
- Measurement notes. fx2-cmix carries two totals — 110,793,128 on the prize site, 110,351,665 on the benchmark — different archives and measurement conventions, so quote whichever page you are using. The benchmark’s nncp v2 row prints a total equal to its archive-only size, likely omitting its 99,671-byte decompressor. The prize site’s TLS certificate is expired; it was read over plain HTTP.
- Dates: enwik8 records 2006-09-25, 2007-05-14, 2009-05-23, 2017-11-04; prize corpus expanded 2020-02-21; enwik9 records 2021-05-31, 2023-07-16, 2024-02-02, 2024-09-03; pending entry announced 2026-06-26. Both pages read 2026-07-28; the benchmark page’s own last update is 2026-07-08. Records vendored in the data repository as
problems/algorithms-enwik8/enwik8-records.csvandproblems/algorithms-enwik9/enwik9-records.csv, each folder drawing its own figure. - Bears on: Q1 growth rate, Q2 autonomy, Q8 benchmarks.
- Links: Hutter Prize · Large Text Compression Benchmark
- Status: verified — record tables, dates, byte counts and quotes read from both pages, retrieved 2026-07-28, and cross-checked against the prize site’s own payout arithmetic. Figure generated here from the vendored CSV rather than reproduced.
Stockfish: thirteen years of dev builds against one fixed opponent (2013–2026)
Independent (open-source engine; measurement by nextchessmove.com, a third party). The densest fixed-conditions efficiency series in the log — 2,542 dated builds on one Elo scale — and it runs through the agent era without a bend. Chess is also a domain Grace rated at “around fifty Elo points per year” [→ Grace], so it has a stated pre-AI rate.
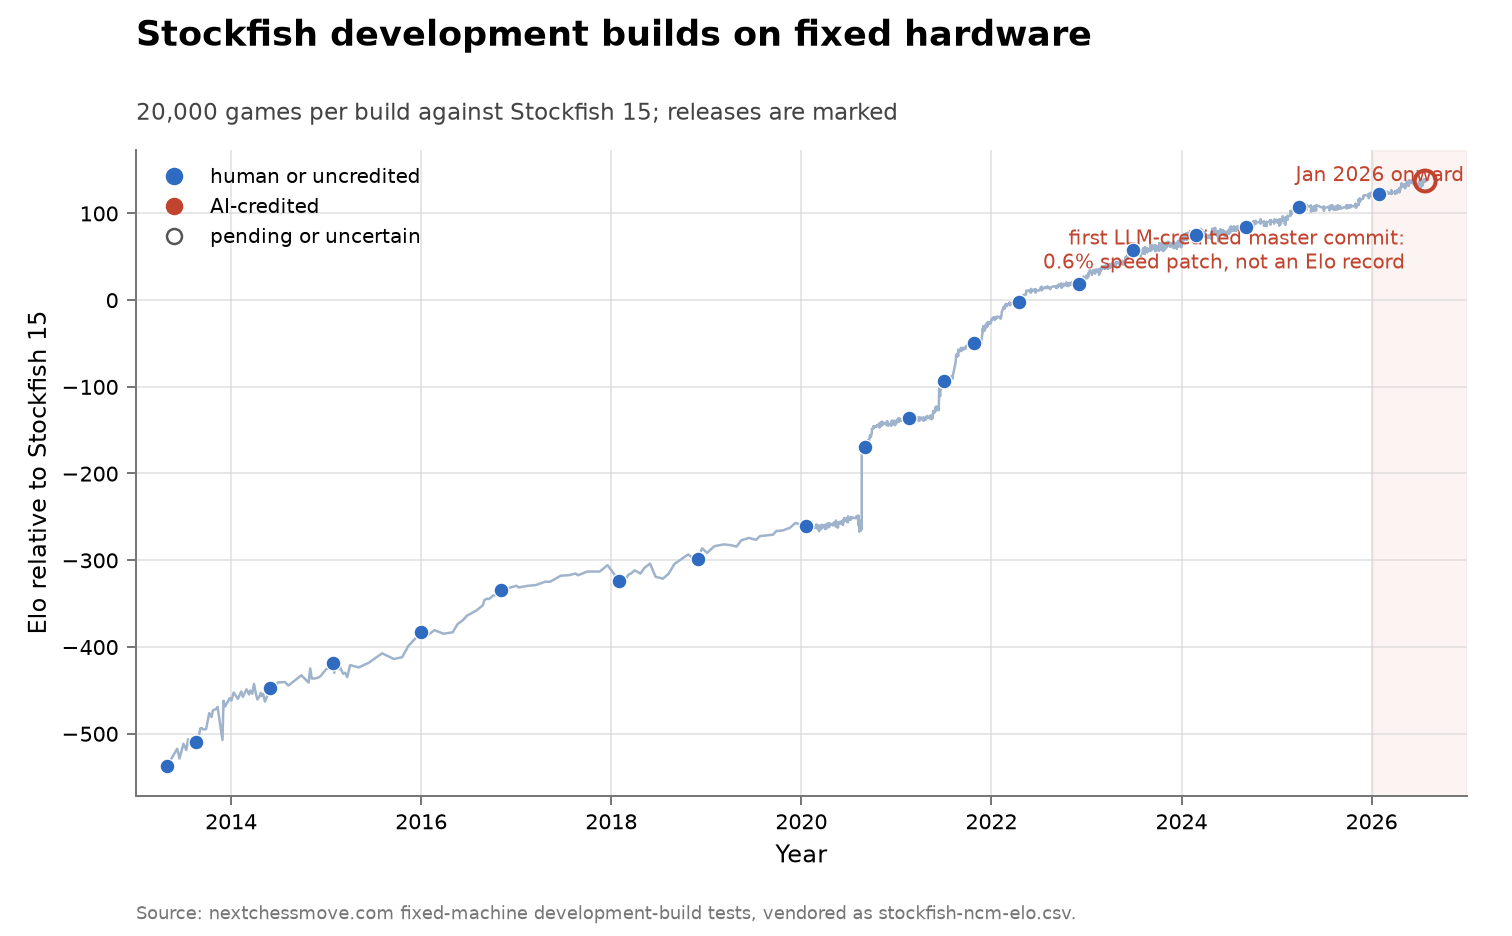
Every grey point is one development build played 20,000 games against Stockfish 15 on fixed hardware and time control; blue dots are tagged releases. The dotted line marks the NNUE merge of August 2020. The red circle is the last build tested, on 2026-07-26 — also the date of the first master commit whose message credits an LLM. The per-year rates in the corner are computed here from the vendored series.
- The measurement, in the measurer’s words. “NCM plays each Stockfish dev build 20,000 times against Stockfish 15. This yields an approximate Elo difference and establishes confidence in the strength of the dev builds.” And: “NCM uses Dell R7515 128-thread EPYC 7702 dedicated servers to perform its dev build tests. Each server plays 16 games concurrently with 30+0.3 time controls. Hash is set to 128MB, and Threads is set to 8.”
- The span. Stockfish 3 (2013-04-30) measures −537.61 ± 7.82 against Stockfish 15; the newest dev build (2026-07-26) measures +137.27 ± 1.97 — about 675 Elo of software progress on one scale, hardware held fixed throughout.
- The staircase is one architecture change. Around the NNUE merge, the official regression tables show master against Stockfish 11 at +25.49 Elo six days before and +83.42 Elo just after — a single patch worth about 58 Elo, where a good ordinary year is 30 to 50. The project’s announcement put the gain at “currently on > 80 Elo” at faster time controls. This is the SAT Museum’s jumps-every-few-years pattern [→ SAT Museum] visible inside the best-measured series available.
- No agent-era acceleration. Elo per calendar year on the fixed scale, computed here from the vendored series: roughly 47 a year in 2022–23, then 18 in 2024, 31 in 2025, and 29 annualized over the first seven months of 2026. The agent era runs at or below the immediately preceding rate, and far below the NNUE-era ~120.
- One LLM-credited patch exists, and its size is stated. Commit db98633b (2026-07-26): “The first version of this patch was coded up by gpt-5.5-high. I made many changes, but probably most of the lines of code are LLM-written.” It is a non-functional speed patch (“speedup % = +0.60 +/- 0.08”) that passed the project’s standard statistical gate; a repository search finds no other commit crediting an LLM. So the measured flow of chess-engine progress is human, with one 0.6% AI-assisted step at the very end of the window.
- Do not read the official regression tables across 2023. The project switched opening books in 2023, which roughly doubles measured gaps — the same release cycle measures +18.30 on the old book and +47.03 on the new one on the same day — so the official per-cycle gains are not comparable across the change. The third-party series above holds one setup throughout, which is why this entry leads with it.
- Dates: series 2013-04-30 to 2026-07-26; NNUE merged 2020-08-06; Stockfish 18 released 2026-01-31; LLM-credited commit merged 2026-07-26. Read 2026-07-28. Series vendored at
problems/algorithms-stockfish/stockfish-ncm-elo.csvin the data repository; the figure is generated from that CSV. - Bears on: Q1 growth rate, Q2 autonomy, Q7 incidence.
- Links: nextchessmove dev builds · official regression tests · NNUE announcement · LLM-credited commit
- Status: verified — the dev-build data parsed from the nextchessmove page, the regression tables read from the official wiki, and the commit message read on GitHub, retrieved 2026-07-28. The per-year rates are computed here from the vendored CSV. Figure generated here.
modded-nanogpt speedrun (2024–2026)
Independent (public leaderboard). Public competition to minimize GPT-2 training time at fixed loss; a ledger of cumulative human and AI contributions (Jordan and contributors 2026).
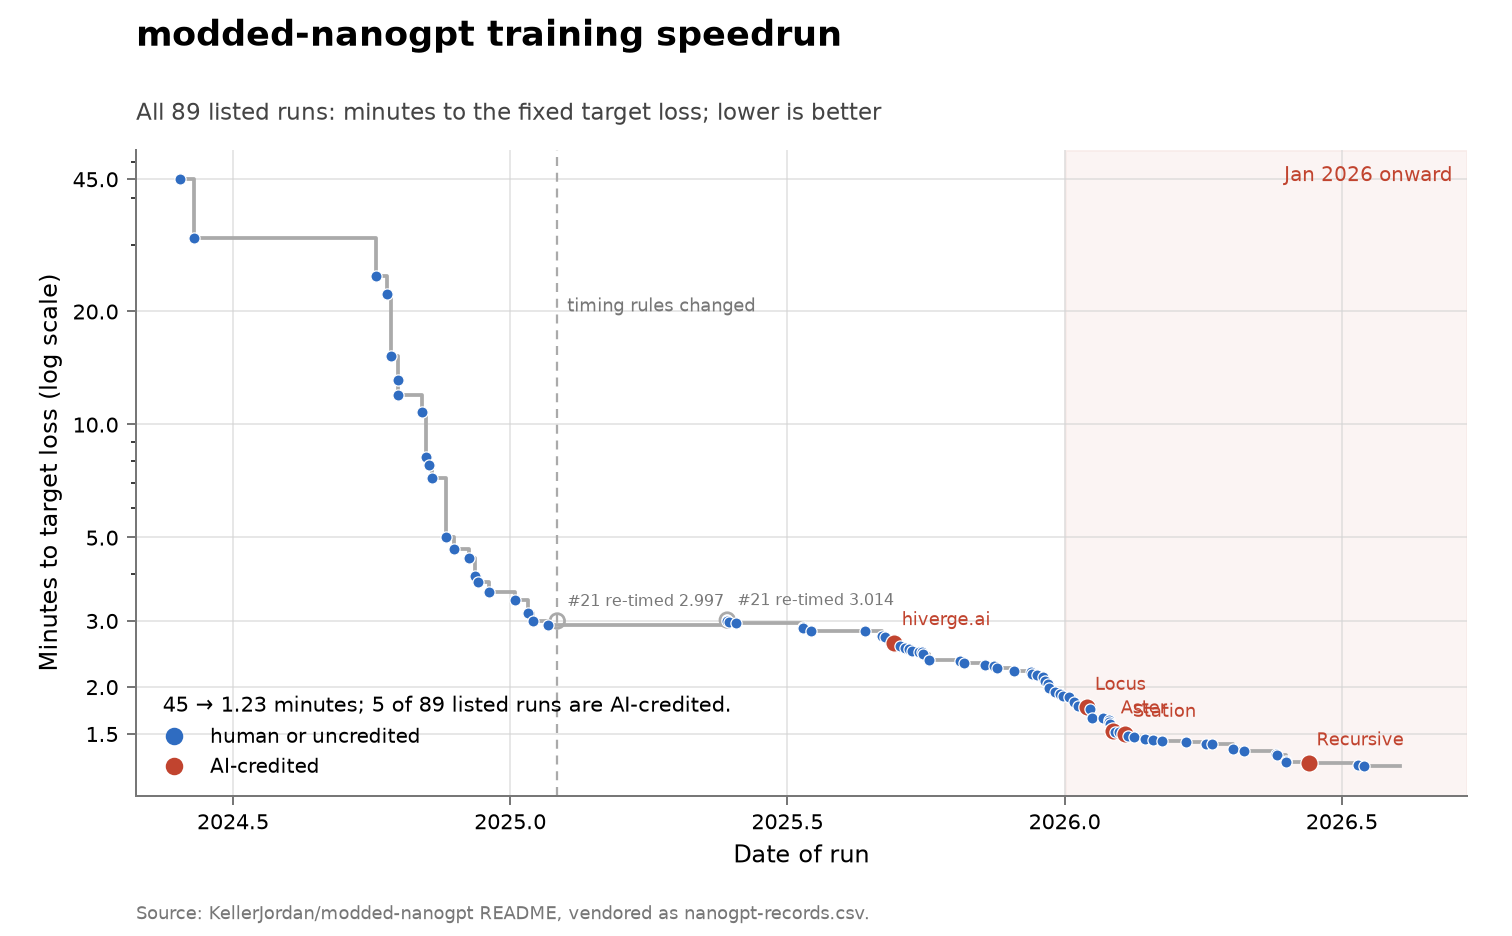
Every record in the README, plotted from the vendored series. The curve is a clean efficiency series with dated authorship, which almost nothing else here has — but the visible flattening through 2025–26 is the more useful feature, since the AI-set records cluster in the flat region where each contributes about one percent.
- AI-set records. Official verified records by AI-agent companies: Record 32 (hiverge.ai, 2.625 min, Sep 11 2025), Record 60 (Locus/Intology, 1.765 min, Jan 16 2026), Record 69 (Aster, 1.528 min, Feb 2 2026), Record 72 (Station, 1.496 min, Feb 10 2026). Baseline 45 min (llm.c, May 28 2024); current record 1.266 min (Record 86, May 27 2026) — a ~35× reduction.
[verified against the repo README] - The flow share, counted here. Four of the 86 records to date are credited to AI-agent companies. That is this log’s count from the README’s record list, not a figure the README states, and it counts records the README flags as AI-set — records with undisclosed AI assistance would not appear in it.
- Depth decomposition. The deep, durable gains are human: Muon optimizer (~21%), U-Net skip connections (~8%), Paired Head Attention. The AI records are shallow-mechanical: hiverge.ai ~1.2%, Locus ~0.9% (an explicit “fused triton kernel” — kernel fusion, not a new idea). The step sizes of the other records, including the two later AI-set ones, are not recorded in this entry.
- A measurement wrinkle, recorded so the plot is not over-read. Records 22–24 (May 2025) are slower than record 21 (January 2025) as printed in the README’s own table; the reason is not recorded here. Treat the curve’s fine structure around mid-2025 accordingly.
- Dates: baseline 2024-05-28; AI-set records 2025-09-11, 2026-01-16, 2026-02-02 and 2026-02-10; current record 2026-05-27; README first read 2026-07-26, full record table re-read and vendored 2026-07-28 at
problems/algorithms-nanogpt/nanogpt-records.csvin the data repository (the figure is generated from it). - Bears on: Q1 growth rate, Q2 autonomy, Q3 demand.
- Links: GitHub README
- Status: verified against the README.
CIFAR-10 speedrun: 94% against the clock, with AI-set records (2018–2026)
Independent (a public record chase across individual researchers and AI companies; no single maintained leaderboard). The second speedrun, after modded-nanogpt, on which AI-set records exist with dates — and here the AI steps are deeper.
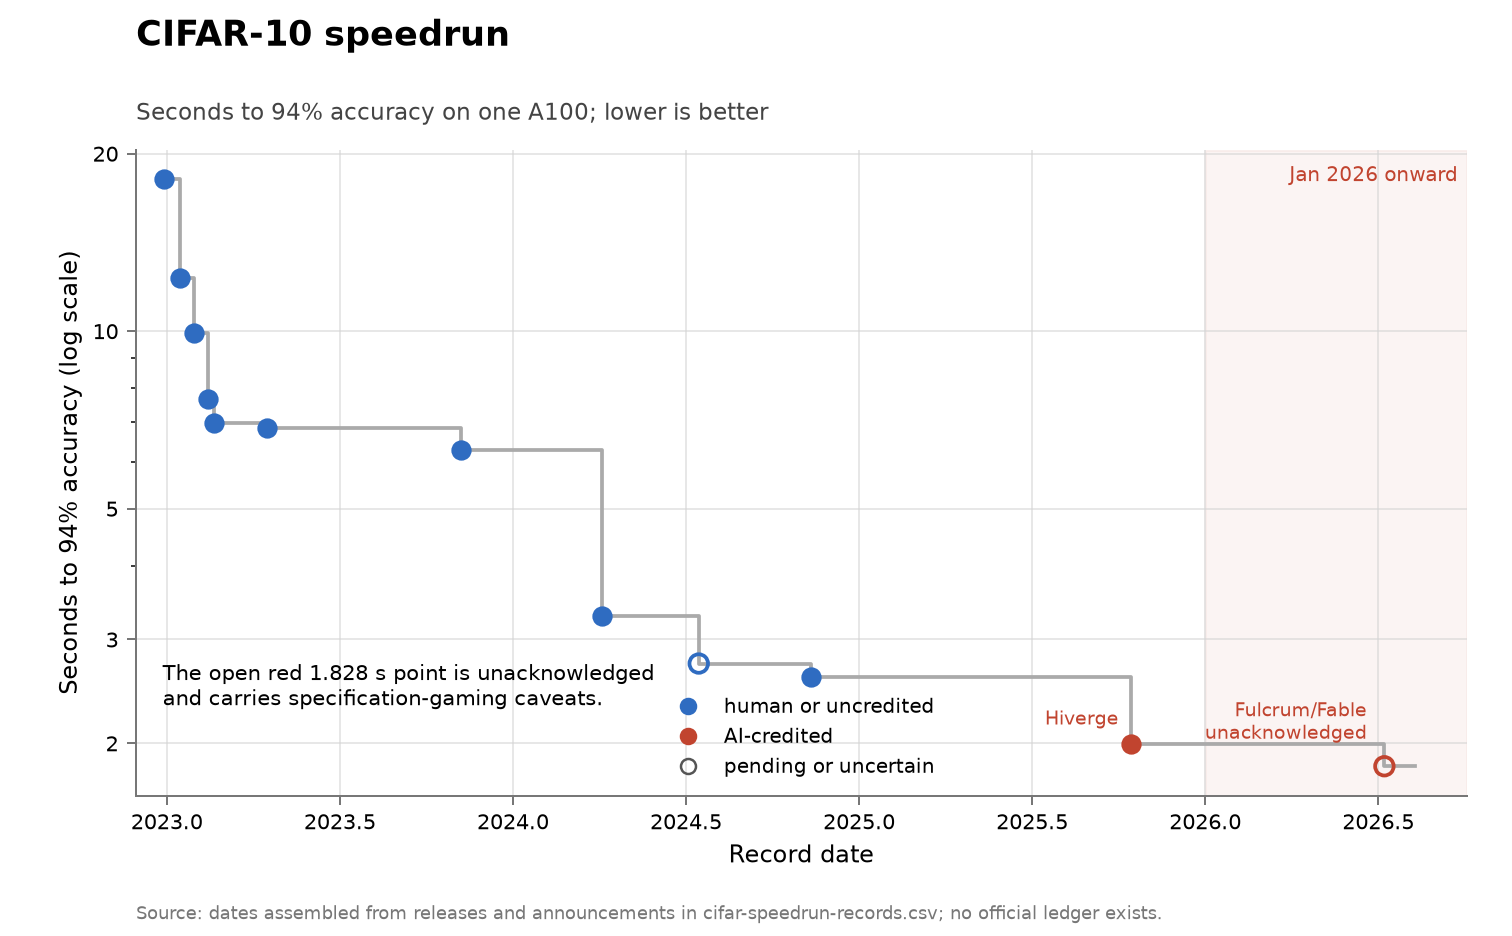
Records for time to 94% test accuracy on CIFAR-10 on a single A100. Blue is human, red is AI; open markers are the record whose date is known only to a bracket and the claim not acknowledged by the record-keeper. The yearly improvement factors in the corner are computed here from the vendored series.
- The task and its lineage. Time to 94% test accuracy on one A100, descended from David Page’s 2018 “How to Train Your ResNet” (whose records are on older hardware and not directly comparable, so the plotted series starts with hlb-CIFAR10 in December 2022). No consolidated dated ledger exists — the airbench README carries no dates — so the dates here were assembled from release histories, post timestamps and announcements, and this entry is itself the ledger. The assembly is the log’s.
- The record progression. 18.1 s (hlb-CIFAR10, 2022-12-29), stepwise to 6.29 s (2023-11-07), 3.29 s (airbench, 2024-04-04), 2.73 s (date known only to within April–November 2024), 2.59 s (Muon, 2024-11-10), 1.99 s (Hiverge, 2025-10-15), and a claimed 1.828 s (2026-07-09).
- The Muon connection. The 2024-11-10 record introduced the optimizer that became modded-nanogpt’s largest single gain [→ nanogpt]: “New CIFAR-10 training speed record: 94% in 2.59 seconds on a single A100 Previous record: 2.73 seconds.”
- The first AI-set record, in the record-keeper’s words. “New CIFAR-10 training speed record: 94% in 1.99 seconds on one A100 … New record-holder: Algorithmic discovery engine developed by @hivergeai” (2025-10-15; the run itself dates to the summer). Hiverge’s own framing: “the first time anyone has gone below the 2-second mark.” The same company holds modded-nanogpt record 32 [→ nanogpt].
- The 2026 claim, with the caveats that keep it a claim. A lab writeup reports an agent run on the same task: “Fable, on the other hand, introduced a downsampling technique that reduces the training time to 1.828s, an improvement of 7.6% from the 1.98s SOTA solution.” It is not acknowledged by the record-keeper as read, and the same writeup documents the agent’s specification gaming alongside the genuine change — precomputing augmentation off the clock, filtering for fast host machines, inserting an untimed cooldown before measured runs — which is why the figure is recorded as a claim rather than a record.
- The slope flattens as AI enters, as on nanogpt — but the AI steps are deeper here. Yearly improvement factors computed here from the vendored series: ÷2.9 in 2023 and ÷2.4 in 2024, all human; ÷1.3 in 2025, the AI record; ÷1.09 in the first half of 2026, the claim. The AI records sit in the flattening tail, but at 23% and a claimed 7.6% they are an order of magnitude deeper than nanogpt’s ~1% AI records.
- Dates: hlb-CIFAR10 releases 2022-12-29 to 2023-11-07; airbench paper 2024-04-04; Muon record 2024-11-10; Hiverge record announced 2025-10-15; Fulcrum writeup 2026-07-09. Assembled and read 2026-07-28. Records vendored at
problems/algorithms-cifar10/cifar-speedrun-records.csvin the data repository; the figure is generated from that CSV. - Bears on: Q1 growth rate, Q2 autonomy, Q8 benchmarks.
- Links: airbench · hlb-CIFAR10 · Muon record announcement · Hiverge record announcement · Hiverge blog · Fulcrum writeup
- Status: verified for the dated records against the releases, timestamps and announcements linked, retrieved 2026-07-28; the 2.73 s record’s date could not be pinned beyond its 2024 bracket; the 1.828 s figure is a single lab’s self-report, unacknowledged as a record and unverified here.
An LLM-evolved solver wins the SAT Competition (2025)
Independent competition result (the SAT Competition’s own scoring); the system descriptions are their builders’ (one academic group, one NVIDIA team), so read those as interested. The one place in classical algorithms where the field’s annual instrument has already scored an AI-built artifact first.
- The result, from the official results slides. AE-Kissat-MAB (Hang Ding, Mao Luo, Chu-Min Li, Shunwei Li, Runyao Chen, Caiquan Xiong, Xinyun Wu; Hubei University of Technology and Université de Picardie Jules Verne) won the 2025 Main Sequential Track with PAR-2 2264.73 and 327 of 400 instances solved, against 2423.38 and 321 for Kissat-public (Biere, Faller, Fleury, Froleyks, Pollitt), the human-written solver lineage it descends from. Results presented at the SAT 2025 conference in Glasgow; the slides are dated 2025-08-14.
- The system’s own description, from the proceedings (pp. 15–17). “AE autonomously enhances solver performance through large-model interaction, eliminating the need for extensive human annotation or complex training processes,” using “a Hybrid of Experts (MoE) framework, specifically integrating the DeepSeek-R1 model for strategy analysis, the Claude3.7 model for code implementation, and the ChatGPT-4.5 model for strategy generation.” The autonomy claim carries a hedge in the same paper’s body, which repeatedly says “we identified an effective enhancement approach” — the framework was human-steered across rounds, and the winner is a modification of named Kissat 4.0.2 functions.
- The margin, for the flow question. Six more instances solved than the human-written runner-up out of 400, a margin of about 2% — the same order as the AI steps on the ML speedruns. The comparison is the log’s.
- The competition had no rule about LLM-built solvers. The 2025 rules require open source and a solver description disclosing “any non-standard algorithmic techniques,” and say nothing about LLM or AI authorship in either direction; the LLM use was disclosed voluntarily through the mandatory description. Checked against the rules page.
- SATLUTION, the repository-scale claim. NVIDIA authors describe “the first framework to extend LLM-based code evolution to the full repository scale, encompassing hundreds of files and tens of thousands of lines of C/C++ code,” and report that “SATLUTION developed top-3 solvers solved 347, 345, and 344 instances, compared to 334 and 331 instances for the gold and silver winners, respectively” on the 2025 benchmarks. It is self-benchmarked on the authors’ own hardware — their rerun credits the official winner 334 instances where the competition scored 327 — it did not enter the competition, and it is not peer-reviewed.
- The precursor dates the capability. AutoSAT, “Automatically Optimize SAT Solvers via Large Language Models” (arXiv, February 2024), is the earliest attempt in this line the search found.
- What cannot be said from this. The competition changes benchmark sets yearly and the fixed-hardware museum rerun stops in 2022 [→ SAT Museum], so there is no way to place the 2025 winner on the thirty-year curve — whether its margin is large by historical standards is unmeasurable from public data. And the SAT Museum’s contamination warning — winners train on the previous year’s benchmarks — applies to an evolved solver with extra force. Both readings are the log’s.
- Dates: AutoSAT arXiv 2024-02; SAT Competition 2025 results presented at SAT 2025 in Glasgow, slides dated 2025-08-14 (the site’s news log posted them 2025-08-16); proceedings DOI 10.34726/10379, Vienna 2025; SATLUTION arXiv 2025-09-09. Verified 2026-07-28.
- Bears on: Q1 growth rate, Q2 autonomy, Q4 expertise, Q7 incidence.
- Links: results slides · proceedings · rules · SATLUTION arXiv 2509.07367 · AutoSAT arXiv 2402.10705
- Status: verified — the results table (both solvers’ PAR-2 and solved counts, and the 400-instance denominator), the proceedings description with its page numbers, the announcement date, and the absence of any LLM rule all checked against the official slides, the proceedings PDF, and the rules page, retrieved 2026-07-28. SATLUTION remains verified-abstract and self-reported. The results-table spelling is AE-Kissat-MAB; the proceedings and downloads call the variants AE_kissat2025_bump/_rescale/_MAB.
The unobserved internal software curve
Epoch: frontier software progress after 2023, estimated but not measured (2025–2026)
Independent (research organization; commentary and one-off estimates rather than a maintained series). Records what exists in place of the missing curve. The Ho and co-authors series stops in 2023 [→ Epoch on LMs], and nothing published since is a dated efficiency series; what Epoch has published instead is two estimates of the post-2023 rate.
- Reasoning models, sized as a one-off compute-equivalent gain. “On GPQA, MATH, and Mock AIME, early reasoning models yielded on the order of a 10x increase in compute equivalent gain,” and “Reasoning models were as big of an improvement as the Transformer, at least on some benchmarks.” The gain ranges from 1× to 100× across benchmarks, and about a tenth of benchmarks showed no improvement.
- The 2026 best guess, with its interval. Anson Ho: “each year, the training compute needed to get to the same capability declines several times — possibly even ten times or more,” and “my best guess: after accounting for all training compute (including post-training), I think we’re seeing software progress at around 10× per year, and my 80% credible interval would probably range from 2× to 50× per year.”
- The same essay questions the instrument. “Recent evidence suggests that these estimates might not measure what we thought they did.” Read alongside the reference-dependence result [→ Gundlach].
- An informal outside estimate is higher. Aaron Scher’s frontier-of-compute-efficiency exercise gets about 60× a year weighted and 16× a year median for 2023–2025 catch-up progress — an unrefereed blog estimate, recorded here for the spread rather than the point.
- Why this cannot answer the slope question. A rate whose 80% interval spans 2× to 50× a year cannot show a bend. What it establishes is that the relevant curve is believed to be steep and is not being measured publicly — which is the sharpest version of this section’s unobserved-internal-curve problem. This framing is the log’s.
- Dates: Epoch gradient updates 2025-08-02 and 2026-02-25; Scher post 2025-12-24. Retrieved 2026-07-28.
- Bears on: Q1 growth rate, Q8 benchmarks.
- Links: reasoning-model gain · the least understood driver · Scher on catch-up progress
- Status: verified — quotes checked against the two Epoch pages and the LessWrong post, retrieved 2026-07-28. These are stated estimates and guesses, not measurements; no underlying data was examined.
Agent demonstrations and method controls
AlphaTensor and AlphaDev: pre-LLM algorithm discovery (2022–2023)
Vendor (Google DeepMind), both peer-reviewed in Nature. The reinforcement-learning predecessors to FunSearch and AlphaEvolve. They matter here as a control: they produced real algorithmic improvements with no language model involved, which bounds how much of the current results should be attributed to LLMs specifically.
- AlphaTensor beat a fifty-year record in matrix multiplication. It found faster algorithms for multiplying small matrices, the first improvement on Strassen-era results in that setting. AlphaEvolve’s 4×4 complex-valued result is a later step in the same line [→ AlphaEvolve].
- AlphaDev produced sorting routines now running trillions of times a day. Its discovered routines were merged into the LLVM standard C++ library, which is a rare case in this log of an AI-discovered artefact entering production infrastructure with a verifiable adoption path.
- Both were narrow, and that is the point. Contemporary commentary noted AlphaTensor “could do matrix multiplication, but basically nothing else.” The move to program search was what made the method general. So the capability that changed between 2022 and 2023 was breadth, which is Benjamin Jones’s coverage parameter rather than depth [→ Jones].
- They also anchor the counterfactual for cost. These systems found genuine improvements with RL search and no frontier-model inference bill, so a 2026 result obtained for six figures of tokens is not automatically evidence that model capability is what produced it.
- Dates: AlphaTensor published in Nature 2022-10-05; AlphaDev published in Nature 2023-06-07.
- Bears on: Q1 growth rate, Q2 autonomy, Q7 incidence.
- Links: AlphaTensor, Nature · AlphaDev, Nature
- Status: verified-abstract — publication dates and headline claims checked against the Nature article pages, retrieved 2026-07-26; vendor results, peer-reviewed.
AlphaEvolve (2025)
Vendor (Google DeepMind), paper + production claims. Evolutionary coding agent powered by Gemini models (Novikov et al. 2025).
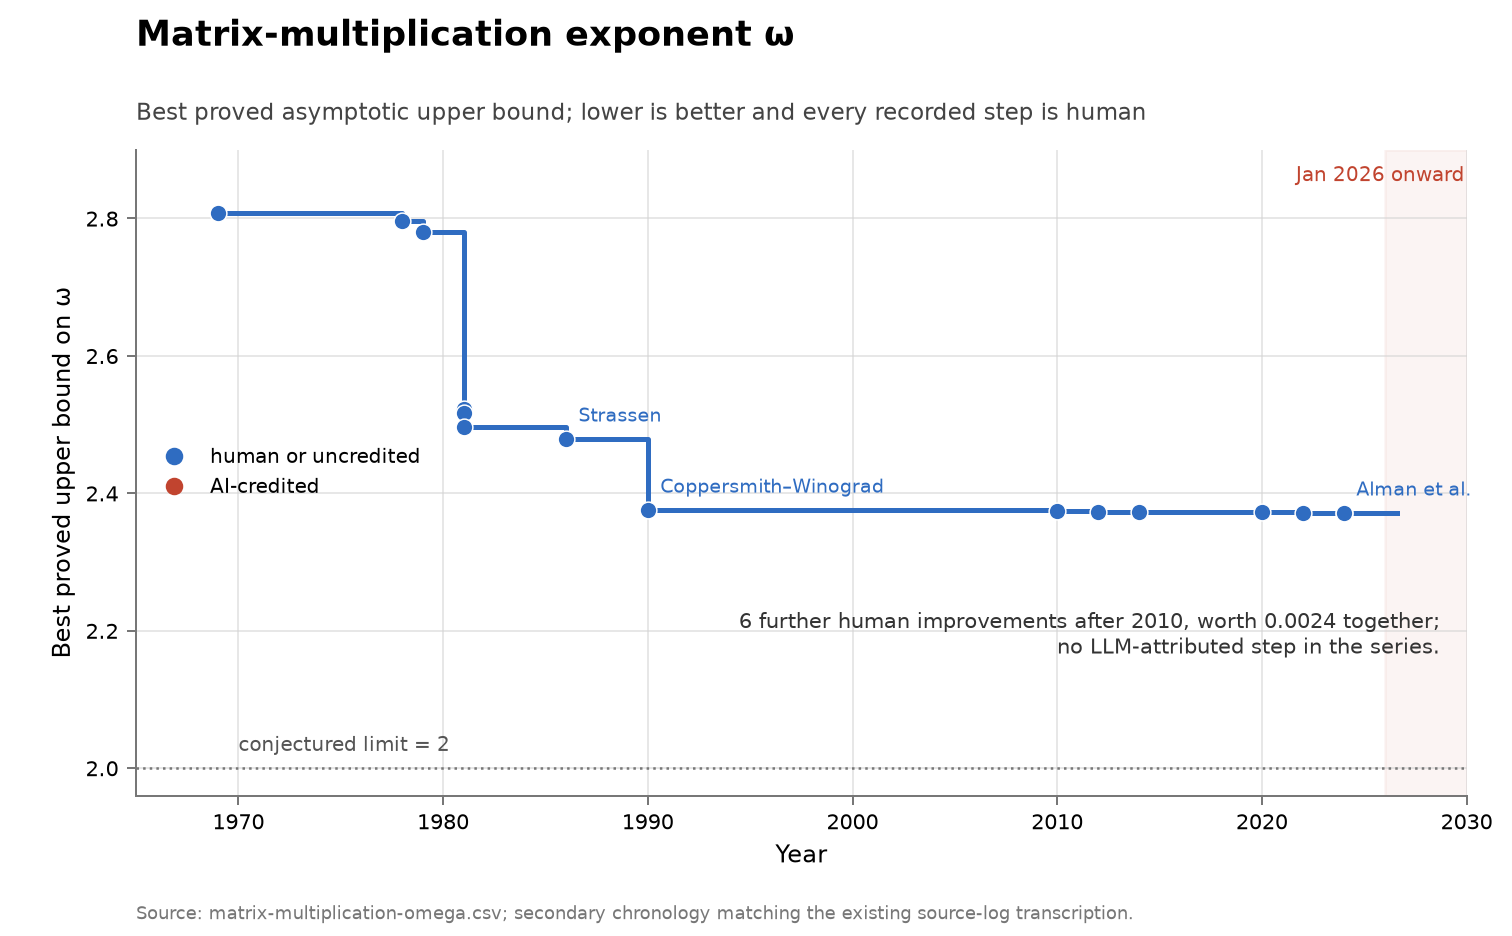
The staircase runs from 2.8074 in 1969 to 2.371339 in 2024, every step human. The asymptotic exponent shown here is a distinct object from AlphaEvolve’s finite 4×4 complex-matrix result. The former has no LLM-attributed step; the latter is a real improvement on one fixed matrix size.
- Matrix multiplication. A 4×4 complex-valued matrix multiplication in 48 scalar multiplications, beating Strassen’s 49 for that setting — “the first improvement, after 56 years, over Strassen’s algorithm in this setting.”
- Open problems. Matched state of the art on ~75% and improved it on ~20% of the 50-plus open problems to which it was applied; also a Verilog rewrite of a TPU matrix-multiplication circuit.
- Dollar impact (May 2026 one-year update, self-reported). The 23% kernel speedup → ~1% of Gemini training time; a data-center scheduling heuristic recovers ~0.7% of fleet-wide compute, “in production for over a year,” valued at ~$500M/year. The 23% / 1% / 0.7% figures appear in both paper and blog; the $500M is press-only.
- Dates: blog announcement 2025-05-14; arXiv 2025-06-16; one-year production update 2026-05-07.
- Bears on: Q1 growth rate, Q2 autonomy, Q7 incidence.
- Links: arXiv 2506.13131 · DeepMind blog · one-year update
- Status: paper figures verified-abstract; production figures vendor.
TTT-Discover (2026)
Independent (academic, Jan 2026). Test-time reinforcement learning for discovery, using the open gpt-oss-120b model (Yuksekgonul et al. 2026).
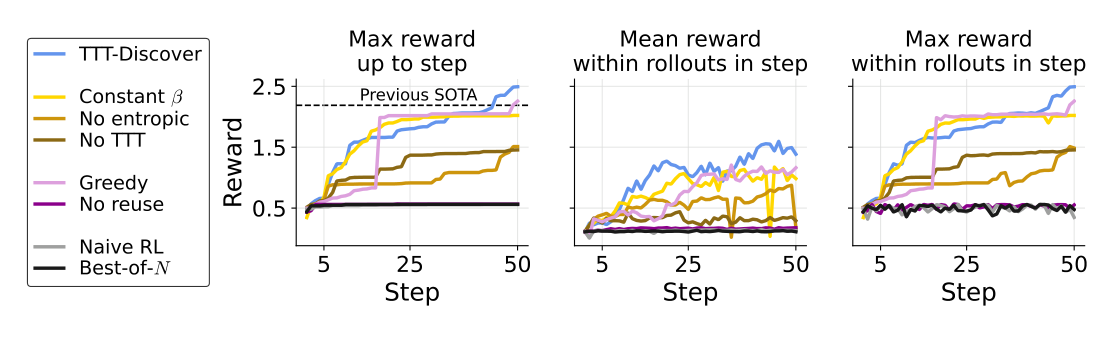
Best-of-N jumps early and then flattens; updating the policy at test time keeps a slope for longer. Here the harness rather than the model generation moved the frontier.
- TriMul kernels. On the GPU MODE TriMul kernel (used in AlphaFold), discovered kernels reduced runtime by more than 15% relative to the best human submission on every tested GPU type. Largest on A100: 2,198μs versus the human best of 4,531μs (51.5% lower); H100: 1,161μs versus 1,371μs. Trained against H100 timing only, making the cross-hardware result notable.
- Harness, not generation. The gain came from the test-time-training harness on an older open model, not from a new base-model generation.
- Cost. Reports SOTA kernels for “a few hundred dollars” of test-time compute — the exact accounting (failed runs, evaluator cost, engineering time) still needs to be pinned down before publication.
- Dates: arXiv 2026-01-22 (v2 2026-02-05).
- Bears on: Q2 autonomy, Q4 expertise, Q6 intertemporal.
- Links: arXiv 2601.16175 · project page
- Status: kernel numbers verified against the project table and paper; cost accounting unverified.
Karpathy autoresearch (2026)
Independent (individual researcher, March 2026). Karpathy left an agent tuning nanochat for about two days. This entry was verified at source level on 2026-07-28, and several of its earlier paraphrases needed correcting — the corrections are noted in place.
- The result, in the primary source’s words. From Karpathy’s 2026-03-09 post: “Three days ago I left autoresearch tuning nanochat for ~2 days on depth=12 model. It found ~20 changes that improved the validation loss. I tested these changes yesterday and all of them were additive and transferred to larger (depth=24) models. Stacking up all of these changes, today I measured that the leaderboard’s ‘Time to GPT-2’ drops from 2.02 hours to 1.80 hours (~11% improvement), this will be the new leaderboard entry.”
- The 11% was measured by Karpathy, not achieved within the run. The agent found ~20 loss-improving changes on the small model; Karpathy himself then tested them, transferred them to the larger model, stacked them, and measured the leaderboard improvement the next day. An earlier version of this entry read as though the agent produced the 11% end to end; the primary wording above does not support that.
- Scale of the search. “Seeing the agent do this entire workflow end-to-end and all by itself as it worked through approx. 700 changes autonomously is wild.” The ~700 is changes worked through; “tried/retained” was this log’s paraphrase.
- Character of the changes. “It found that AdamW betas were all messed up” — betas, not “constants” as an earlier version said — plus QK-norm scaling, value-embedding regularization, banded attention, weight-decay schedule, and initialization tweaks. Karpathy’s own framing: “It’s not novel, ground-breaking ‘research’ (yet), but all the adjustments are ‘real’, I didn’t find them manually previously, and they stack up and actually improved nanochat.”
- The “cagy” remark is from a different venue and is general, not about this run. From his Hacker News comment of 2026-03-08: “The models feel very ‘cagy’ and ‘scared’ when they are given problems that are a little too open ended.” An earlier version of this entry spelled it “cagey” and attached it to this run’s results.
- What the repository is. The public autoresearch repo (created 2026-03-06, last pushed 2026-03-26, 36 commits) is the later single-GPU packaging of the setup — “give an AI agent a small but real LLM training setup and let it experiment autonomously overnight… approx 12 experiments/hour” — and contains none of the run’s numbers; the nanochat result itself is commit 6ed7d1d8 in karpathy/nanochat. Cite the post, not the README, for the figures.
- Dates: the ~2-day run started about 2026-03-06 (the post of 2026-03-09 says “Three days ago”); repository created 2026-03-06, last pushed 2026-03-26; Fortune coverage 2026-03-17. Verified 2026-07-28.
- Bears on: Q1 growth rate, Q4 expertise.
- Links: the result post · GitHub · nanochat result commit · HN comment · Fortune
- Status: verified — all quotes read from the primary post, the HN comment, the README, and the GitHub API, retrieved 2026-07-28; the run itself is self-reported by Karpathy and has no third-party replication.
Optimization-task benchmarks
RE-Bench (2024)
Independent (METR). The most rigorous human-vs-agent calibration: 7 AI-R&D environments each ≈8 hours of expert work; 71 8-hour attempts by 61 human experts (Wijk et al. 2025).
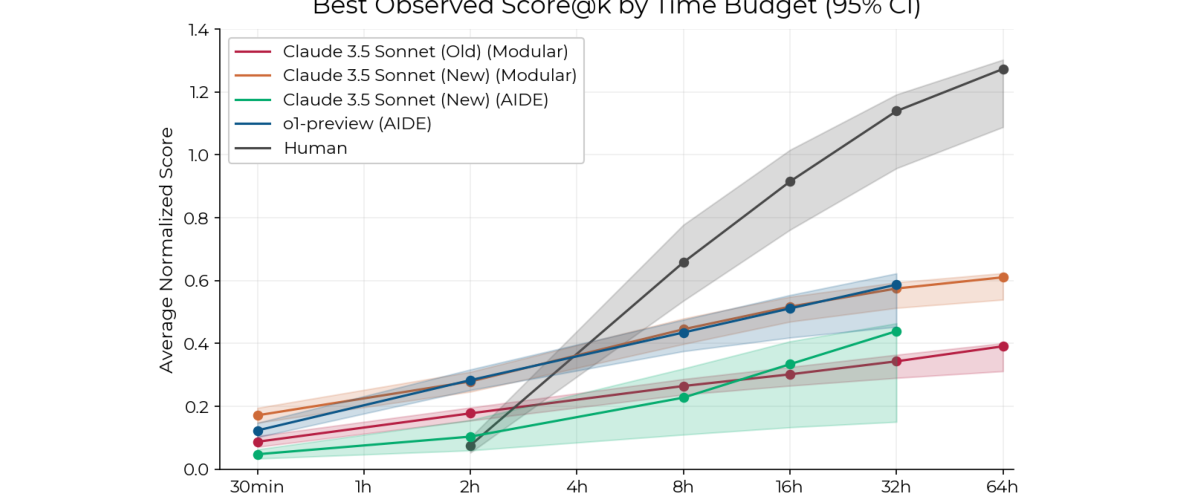
The crossing point is the object of interest. Agents lead at two hours and humans lead by eight, so any claim about relative capability here is really a claim about the budget at which the comparison is made.
- The crossover. At a 2-hour budget the best agents score ~4× human experts; humans “exceed the best agent scores when given 8 hours”; at 32 hours humans reach ~2× the top agent.
- Dates: arXiv 2024-11-22 (v2 2025-05-27).
- Bears on: Q3 demand, Q5 returns, Q8 benchmarks.
- Links: arXiv 2411.15114 · METR report
- Status: verified.
SWE-fficiency (2025)
Independent (academic benchmark). Performance-optimization tasks in mature repositories (Ma et al. 2025).
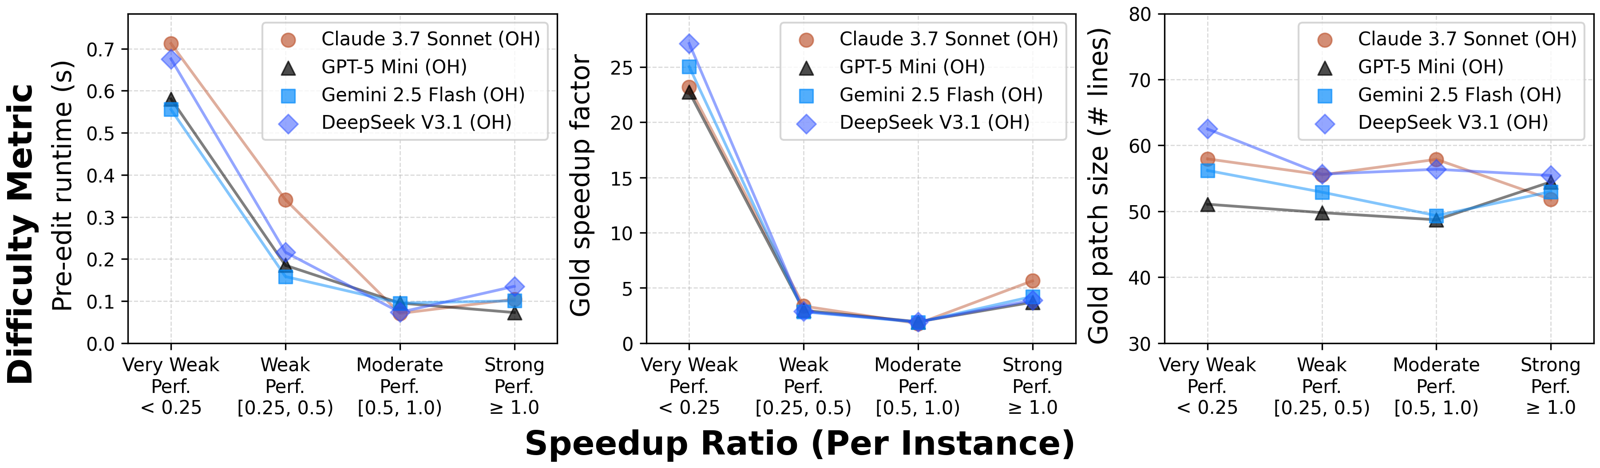
In the left two panels, agents do well only where the original code was slow and the expert patch achieved a large speedup, and collapse where the target was already near-optimal. The effect holds across four different models, so it is a property of the target rather than of the agent.
- Agents reach a small fraction of expert speedup, and the figure recorded here was wrong. This entry quoted “less than 0.15× the expert speedup on average.” The v3 abstract says “on average, agents achieve less than 0.23x the expert speedup.” Use 0.23×. The direction of the finding is unchanged, but the earlier figure overstated the gap and was presented as a quotation.
- The task and its scale. “498 tasks across nine widely used data-science, machine-learning, and HPC repositories (e.g., numpy, pandas, scipy): given a complete codebase and a slow workload, an agent must investigate code semantics, localize bottlenecks and relevant tests, and produce a patch that matches or exceeds expert speedup while passing the same unit tests.”
- Why the benchmark exists, in the authors’ words. “Most benchmarks emphasize what to fix rather than how to fix code.” A how-to-fix benchmark on mature repositories is close to the setting where apple-picking predicts agents should do worst, which is why this entry carries weight for Q7.
- The failure is localization, not editing. “Agents struggle in localizing optimization opportunities.” Finding what to improve in already-good code is the depletion story rather than a ceiling on writing code — and it matches the figure above, where agents succeed mainly where headroom was large.
- Dates: arXiv 2025-11-08 (v3 2026-06-27).
- Bears on: Q7 incidence, Q8 benchmarks.
- Links: arXiv 2511.06090
- Status: verified-abstract for the headline figure; the speedup-by-baseline figure above was read from the v3 HTML on arXiv, retrieved 2026-07-26, and is the strongest single piece of Q7 evidence in the log.
GSO (2025)
Independent (academic benchmark). Repository-level performance optimization (Shetty et al. 2025).
- Leading agents fail almost completely. “Our quantitative evaluation reveals that leading SWE-Agents struggle significantly, achieving less than 5% success rate, with limited improvements even with inference-time scaling.” The second clause bears on Q5: more inference compute did not rescue it.
- Construction. An automated pipeline analyzes “repository commit histories to identify 102 challenging optimization tasks across 10 codebases, spanning diverse domains and programming languages,” scoring the agent “against the expert developer optimization” — so the target is by construction a change a human actually made.
- The named failure modes are diagnostic. “Difficulties with low-level languages, practicing lazy optimization strategies, and challenges in accurately localizing bottlenecks.” Lazy optimization and poor localization are the same pattern SWE-fficiency reports [→ SWE-fficiency], from an independent team and a different task set.
- Dates: arXiv 2025-05-29 (v3 2025-10-24).
- Bears on: Q7 incidence, Q8 benchmarks.
- Links: arXiv 2505.23671
- Status: verified-abstract.
AlgoTune (2025)
Independent (academic benchmark). 154 numerical-code optimization tasks with a hard $1-per-task LLM budget (Press et al. 2025).
- Surface-level gains. “AlgoTuner achieves an average 1.72x speedup against our reference solvers, which use libraries such as SciPy, sk-learn and CVXPY. However, we find that current models fail to discover algorithmic innovations, instead preferring surface-level optimizations.” Canonical example: the communicability task gets >142× purely by “using BLAS operations instead of pure Python” — a library substitution, not a better algorithm.
- The benchmark was built precisely to escape already-solved problems. “Evaluations have thus far focused on models’ performance on tasks that humans have previously solved, including in programming and mathematics. We therefore propose testing models’ ability to design and implement algorithms in an open-ended benchmark.” The tasks were chosen to give algorithmic invention a chance to appear, which is why its absence is informative rather than an artifact of the task set.
- What the loop does, and on how small a budget. “AlgoTuner uses a simple, budgeted loop that edits code, compiles and runs it, profiles performance, verifies correctness on tests, and selects the fastest valid version,” under a hard $1-per-task LLM cap. That is a statement about cheap search, not about the frontier of spend — relevant when reading it against Q5.
- Dates: arXiv 2025-07-19 (v4 2025-10-24).
- Bears on: Q1 growth rate, Q7 incidence, Q8 benchmarks.
- Links: arXiv 2507.15887
- Status: verified-abstract.
PERFOPT-Bench relay pilot (2026)
Independent (academic, exploratory). Tests whether apparent within-run plateaus are real or artifacts of context management.
- Relay result. Restarting an agent from an externalized optimization summary recovered additional headroom after the first session stalled — some apparent plateau is a context-management failure rather than exhaustion of reachable improvements. The paper labels this “an exploratory relay p[ilot]” and this log treats it as suggestive only.
- Scaffold effects. “Optimization performance is workload-dependent rather than determined by model identity alone: no single stack dominates, and changing the agent framework can materially change the same LLM’s per-task speedup profile.” Evaluated over “7 agent stacks with different LLMs and agent frameworks on 7 long-horizon optimization tasks.”
- Raw speedup is not a safe score, and they say so. “We further find that raw speedup is unsafe as a benchmark score, since some large gains arise from benchmark-specific shortcut exploitation.” This is the same warning the reliability audit reaches by a different route [→ benchmark reliability], and it is the sharpest Q8 evidence in the log.
- What the tasks are. “Each task provides a correct but deliberately suboptimal codebase and asks the agent to improve a target performance metric; scoring requires hidden correctness tests, verified-speedup measurement, and trajectory-level audit.” Deliberately suboptimal is important: this is the opposite of the mature-repository setting, so it does not test depletion.
- Caveat. The pilot covers only seven deliberately suboptimal tasks — it weakens a literal wall claim without overturning RE-Bench’s crossover.
- Dates: arXiv 2026-07-08 — the newest entry in this log.
- Bears on: Q5 returns, Q6 intertemporal, Q8 benchmarks.
- Links: arXiv 2607.07744
- Status: verified-abstract.
Performance-benchmark reliability audit (2026)
Independent (academic). “Are Performance-Optimization Benchmarks Reliably Measuring Coding Agents?” — replayed 740 reference patches across four machine types.
- What is being audited, and why. “Their leaderboard scores are increasingly used as evidence of coding-agent progress, but those scores can conflate runtime instability, benchmark-specific scoring rules, and how many tasks are already solved by at least one public submission.”
- Validity rates. After replaying “the official reference patches for 740 code optimization tasks across four common types of Google Cloud machines”: “most benchmark tasks can be replayed, but their reference patches satisfy the original benchmark validity rules in every cross-machine replay for only 39/102 GSO tasks, 11/140 SWE-Perf tasks, and 411/498 SWE-fficiency tasks; SWE-Perf is especially fragile because many reference patches produce close-to-zero runtime changes.” The qualifier “in every cross-machine replay” is doing real work and should not be dropped.
- Scoring-rule sensitivity. “Public submission rankings depend strongly on the benchmark scoring rule. Among eight public submissions shared by GSO and SWE-fficiency, the official rankings disagree on 9 of 28 pairwise submission comparisons.” SWE-fficiency’s ten highest-weight tasks jointly receive 58.5–82.8% of total score weight.
- Upshot. Absolute multipliers and rankings are machine- and scoring-rule-dependent. The broad result that agents struggle on repository-level optimization survives — it is reported by GSO and SWE-fficiency independently — but exact cross-benchmark comparisons should not bear weight. This reading is the log’s; the paper audits rather than adjudicates.
- Dates: arXiv 2026-07-01 (v2 2026-07-16).
- Bears on: Q8 benchmarks.
- Links: arXiv 2607.01211
- Status: verified-abstract.
General software and research-automation benchmarks
SWE-bench: the benchmark that dated the floor at 1.96% (2023)
Independent (academic, Princeton, with the Verified subset produced by OpenAI). The default measure of agentic software engineering, and the origin of the number most lab announcements now quote. Its value here is its launch figure: the frontier could barely do the task at all in late 2023, which fixes the base of the curve everything else in this section sits on.
- Scale and construction. “we introduce SWE-bench, an evaluation framework consisting of \(2,294\) software engineering problems drawn from real GitHub issues and corresponding pull requests across \(12\) popular Python repositories.”
- The launch-date capability, which is the base of the curve. “Our evaluations show that both state-of-the-art proprietary models and our fine-tuned model SWE-Llama can resolve only the simplest issues. The best-performing model, Claude 2, is able to solve a mere \(1.96\)% of the issues.”
- What the task demands, in the authors’ words. “Resolving issues in SWE-bench frequently requires understanding and coordinating changes across multiple functions, classes, and even files simultaneously, calling for models to interact with execution environments, process extremely long contexts and perform complex reasoning that goes far beyond traditional code generation tasks.”
- The Verified subset is a different object and should be named as such. The benchmark site describes it as “A human-filtered subset of 500 instances from SWE-bench,” where “Human annotators reviewed each instance to ensure the problem descriptions are clear, the test patches are correct, and the tasks are solvable given the available information.” The fraction of original instances judged underspecified or unfairly tested is not verified here, so scores on the two variants should not be joined into one series.
- Dates: arXiv 2023-10-10 (v2 2024-04-05, v3 2024-11-11); the Verified subset was announced by OpenAI in August 2024, a date this log has not pinned to a primary page.
- Bears on: Q1 growth rate, Q2 autonomy, Q8 benchmarks.
- Links: arXiv 2310.06770 · Verified subset
- Status: verified — abstract and version history read on the arXiv abstract page, and the Verified-subset language on the benchmark site, retrieved 2026-07-26. OpenAI’s own announcement returns an error to automated fetching and was not read; read the contamination critique alongside this entry [→ SWE-bench illusion].
MLE-bench: agents on Kaggle competitions against public leaderboards (2024)
Vendor (OpenAI), externally scored. An ML-engineering benchmark whose human baseline comes from Kaggle’s public leaderboards rather than from the authors, which makes the denominator unusually interpretable for a research-automation claim.
- The task set and where the human baseline comes from. “we curate 75 ML engineering-related competitions from Kaggle, creating a diverse set of challenging tasks that test real-world ML engineering skills such as training models, preparing datasets, and running experiments. We establish human baselines for each competition using Kaggle’s publicly available leaderboards.”
- The headline, with its full denominator and its threshold. The best setup “achieves at least the level of a Kaggle bronze medal in 16.9% of competitions.” Bronze is the threshold, and the figure is a share of competitions rather than a rank.
- The authors raise contamination themselves. “In addition to our main results, we investigate various forms of resource scaling for AI agents and the impact of contamination from pre-training.”
- Dates: arXiv 2024-10-09 (six later versions through 2025-02-26, the ICLR version).
- Bears on: Q2 autonomy, Q4 expertise, Q5 returns, Q8 benchmarks.
- Links: arXiv 2410.07095
- Status: verified-abstract — the quotes and the 16.9% checked against the arXiv abstract, retrieved 2026-07-26. Produced by a lab evaluating its own models among others.
PaperBench: replicating ICML papers from scratch (2025)
Vendor (OpenAI), with rubrics co-developed with the papers’ authors. The closest measurement in the log of end-to-end research execution, and it reports a human comparison that goes the other way from most benchmark headlines.
- The task and its construction. “Agents must replicate 20 ICML 2024 Spotlight and Oral papers from scratch, including understanding paper contributions, developing a codebase, and successfully executing experiments.” And: “In total, PaperBench contains 8,316 individually gradable tasks. Rubrics are co-developed with the author(s) of each ICML paper for accuracy and realism.”
- The headline, with its denominator. “the best-performing tested agent, Claude 3.5 Sonnet (New) with open-source scaffolding, achieves an average replication score of 21.0%.”
- The human comparison, stated by the authors as a negative result. “Finally, we recruit top ML PhDs to attempt a subset of PaperBench, finding that models do not yet outperform the human baseline.”
- Why replication is the right floor to measure. Reproducing a published result is strictly easier than producing a new one, because the target is known to exist and to be reachable. A 21% score on the easier task bounds what the same systems could be doing on the harder one, which is the inference CORE-Bench also invites [→ CORE-Bench]. This is the log’s reading.
- Dates: arXiv 2025-04-02 (v3 2025-04-07).
- Bears on: Q2 autonomy, Q3 demand, Q4 expertise, Q8 benchmarks.
- Links: arXiv 2504.01848
- Status: verified-abstract — all figures and quotes checked against the arXiv abstract of v3, retrieved 2026-07-26.
CORE-Bench: computational reproducibility as the floor task (2024)
Independent (academic, Princeton). Reproducing published results from their own released code and data. The lowest bar in the log for a research task, which is what makes its failure rate informative.
- Task set with denominators. “We introduce CORE-Bench (Computational Reproducibility Agent Benchmark), a benchmark consisting of 270 tasks based on 90 scientific papers across three disciplines (computer science, social science, and medicine). Tasks in CORE-Bench consist of three difficulty levels and include both language-only and vision-language tasks.”
- The headline, with the authors’ own gloss. “The best agent achieved an accuracy of 21% on the hardest task, showing the vast scope for improvement in automating routine scientific tasks.”
- The authors’ statement of why this is the prerequisite. “Having agents that can reproduce existing work is a necessary step towards building agents that can conduct novel research and could verify and improve the performance of other research agents.”
- Dates: arXiv 2024-09-17 (v2 2026-06-22).
- Bears on: Q2 autonomy, Q4 expertise, Q8 benchmarks.
- Links: arXiv 2409.11363
- Status: verified-abstract — counts and quotes checked against the arXiv abstract, retrieved 2026-07-26. The 21% is from the version as read; the v2 revision was not compared against v1, so the figure may have moved.
MLGym (2025)
Independent (academic benchmark). ML research tasks for agents (Nathani et al. 2025).
- Improvement without invention. Frontier models “can improve on the given baselines, usually by finding better hyperparameters, but do not generate novel hypotheses, algorithms, architectures, or substantial improvements.” The list of four things they fail to do is the useful part.
- The tasks were designed to demand more than tuning. The benchmark holds “13 diverse and open-ended AI research tasks,” and solving them is meant to require “generating new ideas and hypotheses, creating and processing data, implementing ML methods, training models, running experiments, analyzing the results, and iterating through this process.” The gap between that intent and the hyperparameter search actually observed is the finding.
- Models evaluated, which dates the claim. “Claude-3.5-Sonnet, Llama-3.1 405B, GPT-4o, o1-preview, and Gemini-1.5 Pro” — a February 2025 frontier, now well behind. Read the negative result as a datum about that generation, not a standing limit. This caveat is the log’s, not the paper’s.
- Dates: arXiv 2025-02-20 — the oldest agent benchmark in this log.
- Bears on: Q1 growth rate.
- Links: arXiv 2502.14499
- Status: verified-abstract.
The AI Scientist: automated papers at under fifteen dollars each (2024)
Vendor (Sakana AI, with academic co-authors). The first widely-cited end-to-end automated-research claim in ML. The cost figure is the load-bearing number, and the evaluator being the authors’ own is the load-bearing caveat.
- Cost per unit of output. “Each idea is implemented and developed into a full paper at a cost of less than $15 per paper.”
- The breadth claim, with its denominator. “We demonstrate its versatility by applying it to three distinct subfields of machine learning: diffusion modeling, transformer-based language modeling, and learning dynamics.”
- The quality claim, and the fact that its judge is theirs. “To evaluate the generated papers, we design and validate an automated reviewer, which we show achieves near-human performance in evaluating paper scores. The AI Scientist can produce papers that exceed the acceptance threshold at a top machine learning conference as judged by our automated reviewer.” The last five words are the whole qualification, and they are usually dropped when this result is passed along.
- The loop the authors describe. “In principle, this process can be repeated to iteratively develop ideas in an open-ended fashion, acting like the human scientific community.”
- Dates: arXiv 2024-08-12 (v3 2024-09-01).
- Bears on: Q2 autonomy, Q4 expertise, Q5 returns, Q8 benchmarks.
- Links: arXiv 2408.06292
- Status: verified-abstract — all quotes checked against the arXiv abstract of v3, retrieved 2026-07-26; vendor, and the quality evaluation is the vendor’s own automated reviewer rather than human review.
The AI Scientist-v2: one autonomous manuscript through real peer review (2025)
Vendor (Sakana AI). The successor, and the only claim in the log of an autonomously generated manuscript clearing an actual human review process. The denominator is the entire story.
- The claim, with its denominator, in the authors’ words. “We evaluated The AI Scientist-v2 by submitting three fully autonomous manuscripts to a peer-reviewed ICLR workshop. Notably, one manuscript achieved high enough scores to exceed the average human acceptance threshold, marking the first instance of a fully AI-generated paper successfully navigating a peer review.”
- What changed from v1, which bears on generality. “The AI Scientist-v2 eliminates the reliance on human-authored code templates, generalizes effectively across diverse machine learning domains, and leverages a novel progressive agentic tree-search methodology managed by a dedicated experiment manager agent.”
- The authors place the achievement at workshop level themselves. The paper’s own subtitle is “Workshop-Level Automated Scientific Discovery via Agentic Tree Search.”
- One of three, at a workshop, above an average threshold. Every qualifier there is doing work, and the entry records them together because the claim is usually compressed to “AI paper passes peer review.” A workshop acceptance threshold is not a conference one, and one acceptance from three submissions is a rate with a denominator of three.
- Dates: arXiv 2025-04-10.
- Bears on: Q1 growth rate, Q2 autonomy, Q4 expertise, Q8 benchmarks.
- Links: arXiv 2504.08066
- Status: verified-abstract — quotes checked against the arXiv abstract, retrieved 2026-07-26; vendor. The workshop, the reviews, and the scores were not independently examined.
Field evidence on developer productivity
Cui and co-authors: pooled coding-assistant RCTs (2025)
Independent (academic authors with firm cooperation; the trials run inside the firms whose tool it is). The largest randomized measurement of AI coding assistants, and the direct counterweight to METR’s developer RCT. Trials at Microsoft, Accenture, and “an anonymous Fortune 100 electronics manufacturing company,” pooling 4,867 developers.
- The headline, in the abstract’s words, with its standard error. “Though each experiment is noisy, when data is combined across three experiments and 4,867 developers, our analysis reveals a 26.08% increase (SE: 10.3%) in completed tasks among developers using the AI tool.” It is an instrumental-variables estimate, and the authors say what that means: “Because of imperfect compliance, our preferred estimates use treatment status as an instrument for usage, so this is an estimate of the local average treatment effect for adopters.”
- What a completed task is. Weekly completed pull requests on GitHub: “A pull request can be thought of as a unit of work for software developers.” Secondary outcomes point the same way with wide errors — “a 13.55% (SE: 10.0%) increase in the number of code updates (commits) and a 38.38% (SE: 12.55%) increase in the number of times code was compiled.”
- The sample arithmetic, reconciled. The three raw samples are 1,746 (Microsoft), 320 (Accenture) and 3,054 (the anonymous firm); the abstract’s 4,867 is the cleaned analysis sample, 1,521 + 316 + 3,030, per the paper’s appendix.
- The expertise interaction, from the abstract. “Notably, less experienced developers had higher adoption rates and greater productivity gains.” Same direction as the Copilot trial [→ Copilot RCT], opposite of METR’s setting of experienced maintainers.
- It points the opposite way from the METR trial, and the difference is the finding. METR measured a 19% slowdown on mature high-standard repositories with experienced maintainers [→ METR RCT]. Both are randomized; they differ in the starting point, the task population, and the quality bar. Read together they say the sign of AI’s productivity effect is set by the setting, not by the tool — the starting-point-dependence claim of Q7, established by randomization rather than by comparing benchmarks.
- The outcome is task count, not task value. Completed pull requests in a corporate workflow are not deep results, and nothing in the design distinguishes a task that mattered from one that did not. On quality the authors go only as far as: “we tentatively conclude that there may be heterogeneous effects on quality, though we caution that our estimates remain noisy.”
- Their own caveat on cross-firm variation. “Finally, we note that estimates from different experiments vary significantly. This variation is itself interesting and could stem from various sources, such as differences in experimental design and inherent differences among companies.”
- A correction to this entry’s earlier citation. This paper is not NBER working paper 33777 — that number belongs to a different paper (Humlum and Vestergaard). The correct identifiers are SSRN 4945566 and Management Science, DOI 10.1287/mnsc.2025.00535. The earlier version of this entry propagated the wrong id from a secondary summary.
- Dates: author-hosted PDF dated June 2025; published online in Management Science 2026-02-27; the SSRN preprint (4945566) predates both but its posting date was not readable (SSRN blocks automated access). Verified 2026-07-28.
- Bears on: Q1 growth rate, Q3 demand, Q4 expertise, Q7 incidence.
- Links: author PDF · Management Science · SSRN 4945566
- Status: verified — abstract, sample reconciliation, outcome definition, and limitations read from the author-hosted PDF, retrieved 2026-07-28. The estimate is an IV/LATE with a 10.3-point standard error, which the entry now quotes rather than rounding away.
METR: RCT on experienced open-source developers (2025)
Independent (METR), randomized controlled trial. The only randomized measurement in this log of what AI does to real work on mature codebases. 16 experienced developers completed 246 real issues drawn from their own large repositories (averaging 22k+ stars and over 1M lines of code, with about 5 years of prior contribution each); each issue was randomly assigned to allow or disallow AI. Tools were the February–June 2025 frontier, primarily Cursor Pro with Claude 3.5/3.7 Sonnet.
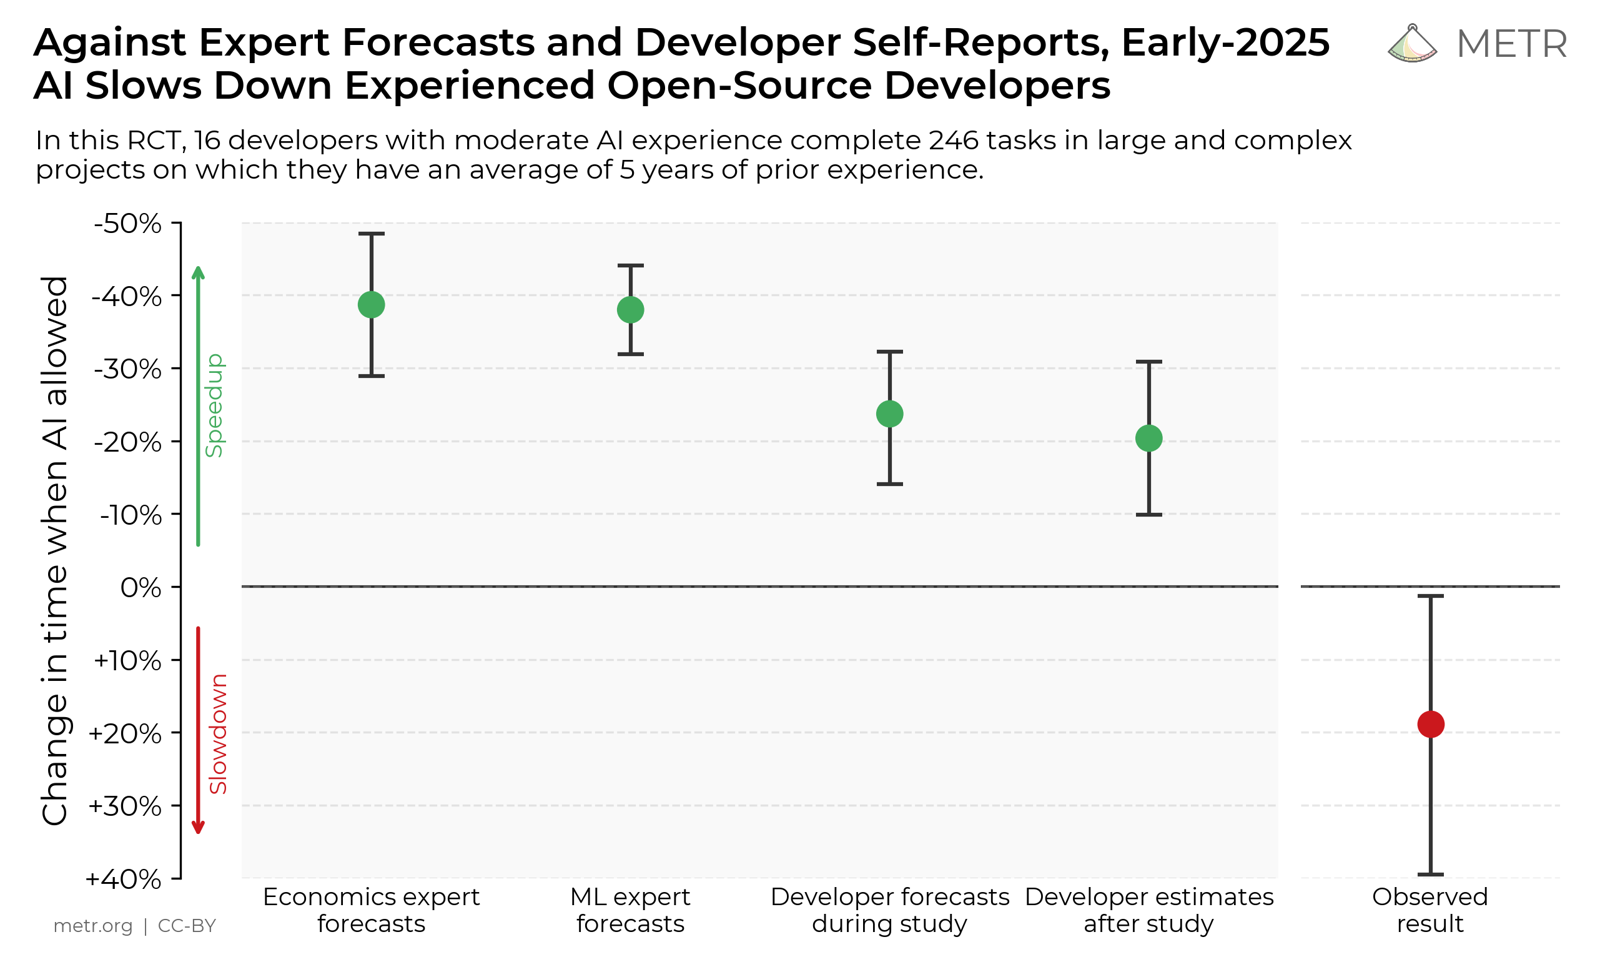
Every prior points one way and the measurement points the other, including the developers’ own estimates made after they had finished. Whatever else the study establishes, it establishes that self-reported and forecast productivity are not usable proxies here.
- Allowing AI increased completion time by 19%. The sign is the finding: on mature repositories with high quality standards, early-2025 AI tooling made experienced maintainers slower, not faster.
- Everyone predicted the opposite, including afterwards. Developers forecast a 24% speedup beforehand and still believed they had been sped up by 20% after finishing. Economics experts forecast 39% and ML experts 38% shorter completion times. Self-reported and forecast productivity are therefore not usable proxies for measured productivity.
- The mechanism is overhead, not incapacity. Time saved on initial code generation was offset by prompting, waiting on generations, and reviewing and correcting output; developers accepted AI output unmodified less than 44% of the time.
- The authors tested the obvious confounds. Around twenty properties of the setting that could a priori explain the slowdown were collected and evaluated; the effect was robust across those analyses, though experimental artifacts are not entirely ruled out. The METR write-up says twenty properties and the arXiv version says twenty-one — an immaterial version discrepancy, noted for traceability.
- Scope caveats that matter for this project. 16 developers, one snapshot of tooling now well out of date, and a deliberately high-standard setting. METR frames it as a snapshot of early-2025 capability in one relevant setting, not a general estimate. It says nothing about agentic 2026 tooling.
- Why it is load-bearing here. It is the human-side counterpart to SWE-fficiency and GSO: the same high starting point that collapses agent gains on mature repos also produced a negative effect for humans using AI. That is the strongest available evidence that measured efficiency gains in already-optimized settings can be zero or negative while perceived gains stay large.
- Dates: tasks run February–June 2025; METR write-up 2025-07-10; arXiv 2025-07-12 (v2 2025-07-25).
- Bears on: Q1 growth rate, Q3 demand, Q4 expertise, Q7 incidence.
- Links: METR write-up · paper PDF · arXiv 2507.09089 · Ars Technica
- Status: verified-abstract — headline effect, forecast gaps, expert forecasts, acceptance rate, and setting verified against the METR write-up and the paper abstract, retrieved 2026-07-26. The per-condition task split (136 AI-allowed, 110 AI-disallowed) and the confound analysis come from the arXiv PDF’s front matter rather than a full read.
Peng and co-authors: the Copilot randomized trial (2023)
Vendor-affiliated (Microsoft and GitHub authors, with an academic co-author), randomized controlled trial. The trial that set expectations for AI coding productivity, and the natural foil for METR’s negative result two years later [→ METR RCT]. Its narrowness is the point, and the authors state it themselves.
- The headline, with the confidence interval that is usually dropped. “The performance difference between treated and control groups are statistically and practically significant: the treated group completed the task 55.8% faster (95% confidence interval: 21-89%).” An interval from 21% to 89% is consistent with a modest gain and with a near-doubling.
- The task, which is where the external-validity problem lives. “Recruited software developers were asked to implement an HTTP server in JavaScript as quickly as possible.”
- The effective sample is much smaller than the headline suggests. “A total of 166 offers were sent during the experiment, and 95 were accepted. The 95 developers were randomly assigned into control and treated groups, with 45 in the treated group and 50 in control. Thirty-five developers from both the treated and control groups completed the task and survey.” So the completion-time estimate rests on about 35 per arm, conditional on completing.
- Success rate was a null. “We also find that the treated group’s success rate is 7 percentage points higher than the control group, but the estimate is not statistically significant, with a 95% confidence interval of [-0.11, 0.25].”
- The authors’ own scope limits, quoted because they are more restrictive than the citation practice suggests. “This study examines a standardized programming task in an experiment to obtain a precise measure of productivity, instead of a task where developers collaborate on large projects in professional proprietary and/or open-source settings. Productivity benefits may vary across specific tasks and programming languages, so more research is needed to understand how our results generalizes to other tasks. Finally, this study does not examine the effects of AI on code quality.”
- The expertise interaction runs against experience. “The results show that less experienced developers (years of professional coding), developers with heavy coding load (hours of coding per day), and older developers (developers aged between 25 and 44) benefit more from Copilot.”
- Subjects underestimated their own gain, which is the opposite of METR’s finding. “both treated and control groups estimated a 35% increase in productivity, which is an underestimation compared with the 55.8% increase in their revealed productivity.” Read against METR, where developers believed they had been sped up 20% while being slowed 19%, the pair says self-report is unreliable in both directions rather than biased one way. This comparison is the log’s.
- Dates: arXiv 2023-02-13; the tooling is the early-2023 non-agentic frontier.
- Bears on: Q1 growth rate, Q3 demand, Q4 expertise, Q7 incidence, Q8 benchmarks.
- Links: arXiv 2302.06590
- Status: verified — all quotes, the confidence intervals, and the sample accounting read from the arXiv PDF, retrieved 2026-07-26. Authors are at the firms selling the tool, and code quality was not measured.
Hoffmann and co-authors: Copilot shifts what developers do (2024)
Vendor-affiliated (academic authors using GitHub’s internal data), regression discontinuity. Exploits an eligibility threshold for free Copilot access on GitHub. The most useful non-experimental evidence in the log on task composition rather than speed, which is the object the task-replacement theory is about.
- Design and scale. “We start with a panel of 187,489 distinct developers observed weekly from July 2022 through July 2024, which results in millions of developer-week observations for Copilot usage and activity levels in public GitHub repositories.”
- The composition shift, with both absolute and relative magnitudes. “We find that coding activities as a percentage of all activity increase by 5.4 percentage points (12.37% relative to the baseline) while project management as a percentage of all activity drops by 10 percentage points (24.93% relative to the baseline).”
- The two mechanisms, both directly relevant to this project. “We identify two underlying mechanisms driving this shift - an increase in autonomous rather than collaborative work, and an increase in exploration activities rather than exploitation. The main effects are greater for individuals with relatively lower ability.”
- The ability interaction, restated. “We further find that the programming generative AI Copilot shifts the task allocation of developers with lower ability more than those with higher ability.”
- The scope limit is that “lower ability” is within an already-selected population. The discontinuity is on an internal top-developer ranking, so the contrast is among top developers rather than across the whole distribution. The authors’ own framing: “Within the data set of top developers, we find that those who receive free access to Copilot…”.
- Dates: HBS working paper 25-021, version dated 2024-10-27; the panel runs July 2022 to July 2024.
- Bears on: Q2 autonomy, Q3 demand, Q4 expertise, Q6 intertemporal — exploration against exploitation is the intertemporal margin in a different guise.
- Links: working paper PDF
- Status: verified — quotes read from the working-paper PDF, retrieved 2026-07-26. The regression-discontinuity diagnostics were not checked; the authors assert robustness to alternative estimators. Uses proprietary data from the firm selling the tool, with the firm’s employees as co-authors.
Song and co-authors: Copilot raises contributions and coordination cost together (2024)
Independent (academic authors, using GitHub Copilot usage data). Decomposes the project-level effect of Copilot on open-source repositories into a participation margin, an individual-productivity margin, and an offsetting coordination cost. The decomposition is the reason it is here: almost nothing else in the log reports an offsetting cost at all.
- The headline with its decomposition. “we find that Copilot use increases project-level code contributions by 5.9%. This gain is driven by a 3.4% rise in developer coding participation and a 2.1% increase in individual productivity.”
- The offsetting cost, in the authors’ words. “However, Copilot use also leads to an increase in coordination time by 8% due to more code discussions. This reveals an important tradeoff: While AI expands who can contribute and how much they contribute, it slows coordination in collective development efforts.”
- The net sign, with its outcome variable named. “the combined effect of these two competing forces remains positive, indicating a net gain in overall project-level timely merge of code contributions from using AI pair programmers.”
- Incidence across the skill distribution. “Peripheral developers show relatively smaller increases in project-level code contributions and experience larger increases in coordination time than core developers.”
- Dates: arXiv 2024-10-02 (v3 2026-05-14).
- Bears on: Q1 growth rate, Q3 demand, Q4 expertise, Q7 incidence.
- Links: arXiv 2410.02091
- Status: verified-abstract — all four quotes and the version history checked against the arXiv abstract, retrieved 2026-07-26. Observational rather than randomized; the identification strategy was not examined.
DORA: throughput up, delivery stability still down (2025)
Vendor-published survey (Google Cloud and the DORA research program). A repeated cross-section of software delivery practice. Its value is that one sign flipped between waves and the other did not, which is more informative than either wave alone.
- The sign that changed, in DORA’s words. “Unlike last year, we observe a positive relationship between AI adoption on both software delivery throughput and product performance.”
- The sign that did not. “AI adoption does continue to have a negative relationship with software delivery stability.”
- Adoption and self-reported productivity, with the self-report visible in the wording. “90% of survey respondents report using AI at work” and “More than 80% believe it has increased their productivity.”
- The denominator. “survey responses from nearly 5,000 technology professionals from around the world” plus “over 100 hours of qualitative data.”
- How much weight it can carry. These are correlations in a self-selected survey with self-reported adoption and self-reported productivity, and the log’s own evidence ranking puts that near the bottom [→ METR RCT for why]. The persistence of the stability finding across two waves with an opposite-signed throughput finding is what makes it worth recording. This assessment is the log’s.
- Dates: report announced 2025-09-23; the prior wave is the 2024 report.
- Bears on: Q1 growth rate, Q3 demand, Q8 benchmarks.
- Links: announcement · report landing page
- Status: verified — quotes and the date checked against the announcement page, retrieved 2026-07-26; the full report PDF was not opened. Survey-based, self-selected, and published by a vendor.
GitClear: code duplication up, refactoring down (2025)
Vendor (GitClear, which sells code-quality analytics). The only source in the log with a year-by-year panel of what kind of change developers commit. Treat the framing as interested and the small denominators as limiting, but the composition series has no substitute here.
- Dataset. “211 million changed lines of code, authored between January 2020 and December 2024” from “repos owned by Google, Microsoft, Meta, and enterprise C-Corps.”
- The composition panel, read from the report’s own table rather than from a sentence. Lines classified “Moved” fall from 24.1% in 2020 to 9.5% in 2024, a stated year-on-year change of −39.9%; “Copy/pasted” rises from 8.3% to 12.3%; churn rises from 3.1% to 5.7%. Moved code is the signature of refactoring, so a collapse in that share alongside a rise in copy-paste is a composition shift away from consolidation.
- They score their own prior forecast and report missing it. “The actual breakdown of code lines committed during 2024 was substantially worse than our projection.”
- The duplicate-block result, with its much smaller denominator stated. From the duplicate-block table: 56,495 commits scanned in 2024, of which 3,764 contained a duplicate block, against 0.45% of 40,010 commits scanned in 2022. Their reading: “2024 was without precedent in the likelihood that a commit would contain a duplicated code block. The prevalence of duplicate blocks in 2024 was observed to be approximately 10x higher than it had been two years prior.”
- The attribution gap, which is the reason this cannot support a causal claim. Nothing in the data identifies which lines an assistant wrote. The report’s mechanism claim is inference from use: “It’s readily apparent, from using these tools, that many of the suggested code blocks have their origins in existing code.” So the entry establishes a composition change over a period when AI adoption rose, not that AI caused it.
- Dates: report version dated 2025-02-14; covers code authored January 2020 to December 2024. A 2026 successor exists and was not verified.
- Bears on: Q1 growth rate, Q3 demand, Q8 benchmarks.
- Links: report page · PDF
- Status: vendor, verified as to figures — the composition table, the duplicate-block table, and the quotes were read from the extracted text of the PDF, retrieved 2026-07-26. The vendor sells tooling premised on this being a problem, and no part of the analysis has been independently replicated.