This is one of four source documents for AI’s Contribution to Discovery. The four source documents are cyber, math, algorithms and optimization, and cross-cutting evidence, models, and method.
The conventions this document follows — what an entry must contain, the status vocabulary, the standing rules, and the eight questions entries are tagged against — are set out in the method and cross-cutting document.
Overview
Each series is plotted under its own entry below, using the same charts and visual language as LLMs’ Contribution to Discovery. Each is generated by its own folder in the ai-discovery-data repository, which is canonical for the data and carries a document, the fetching script and the drawing script beside each series.
Six series, one format throughout: annual counts, a linear y-axis, January 1, 2026 onward shaded, an outlined bar where a year is incomplete, and one colour vocabulary — blue for uncredited or human finders, amber for a fuzzer, red for AI. Each chart names its own source and how to read it. Nothing is normalized and no axis is logarithmic, so a bar twice as tall is twice as many vulnerabilities.
Three fixed codebases that credit their finders. These are the only sources in the log where AI’s contribution can be separated from everything else, because each project records who found each issue. curl is small and heavily audited: about ten disclosures a year from 2017 to 2025, then 36 in the first half of 2026 with 15 AI-credited [→ curl vulnerabilities]. OpenSSL shows the same shape and the highest AI share anywhere here — 6 disclosures in 2025, then 38 in part-2026 of which 26 are AI-credited [→ OpenSSL vulnerabilities]. Firefox is a codebase two orders of magnitude larger and adds the distinction the other two cannot: reports credited to a fuzzer are counted apart from reports credited to AI, and the fuzzer band plateaus around 105 a year while the AI band goes from 1 in 2025 to 137 in part-2026 [→ Firefox advisories].
Two cautions those three make visible. The rise is not purely an AI effect: Firefox roughly doubled between 2021 and 2025 with essentially no AI credit anywhere, and OpenSSL’s tallest bars are in 2015 and 2016, the post-Heartbleed audit years. And the AI-credited work is extremely concentrated in a few people. One team accounts for 121 of Firefox’s 137 AI-credited CVEs, and Alex Gaynor of Anthropic appears in both that team’s credit line and OpenSSL’s. This is not a diffuse capability arriving everywhere at once; it is a small number of well-resourced efforts pointed at high-value targets.
The two controls. OSS-Fuzz is a decade of continuous automated search over hundreds of projects and it runs the other way — 1,041 findings in 2020 down to 244 in 2025 [→ OSS-Fuzz]. So the three fixed codebases cannot be explained by “automation finds more bugs”, because the largest automated programme in open source finds fewer every year. Then all software, split into two charts rather than overlaid, because they differ by two orders of magnitude and sharing an axis previously required a logarithmic scale that obscured the point [→ NVD and KEV]. Disclosures rise steeply — but were already rising at +32% and +23% in 2024 and 2025, before any of this. Additions to the exploited catalogue stay roughly flat: 0.49% of 2025’s disclosures reached that list, and 0.37% of 2026’s.
What the six say together. Discovery on fixed codebases accelerated sharply and recently; AI is credited on a large and rising share of it; that share traces to a handful of teams; the older automation invited as a comparison is declining; the aggregate was already climbing before AI; and the extra finds are markedly less likely than their predecessors to be exploited by anyone. Severity points the same way where it can be measured, in the curl entry. This reading is the log’s.
Capability on cyber tasks is rising fast and on more than one measure: the offensive-cyber time horizon goes from about 30 seconds to about 3 hours over seven years, the AISI corporate range goes from 1.7 to 9.8 of 32 steps in eighteen months, and AIxCC — the only fixed task set in the domain measured twice — roughly doubled both its find rate and its patch rate in twelve months [→ Lyptus, AISI cyber, AIxCC].
Those three series cannot answer the slope question, because all of them begin inside the agent era. Two series added on 2026-07-28 can: curl’s own vulnerability record, one codebase tracked since 2000 with every finder credited [→ curl vulnerabilities], and the aggregate disclosure and exploitation counts [→ NVD and KEV]. This is the one domain in the log where a collective-progress curve does bend. curl ran at 13.7 disclosures a year over 2014–2023 and about 72 a year in 2026, with AI-credited finders going from none before 2025 to 42% of 2026; NVD disclosures annualize to about 1.6 times the 2025 record. Two things hold the reading down. The extra finds are shallower — within 2026, AI-credited curl issues are 80% rated Low against 48% for other finders, and nobody found anything rated High or Critical — though that severity shift began well before AI. And exploitation did not keep pace: the share of disclosures reaching CISA’s exploited catalog fell from 0.49% to 0.37%. An earlier version of this overview said no such series existed, which was true of the log rather than of the world. Two further complications sit in the entries: a fixed codebase holds a depleting stock, so yield falls over time even for a searcher of constant ability, and the binding constraint has visibly moved to triage rather than discovery — curl closed its bug bounty after AI-assisted submissions reached about 20% of entries while genuine yield fell [→ curl].
Cyber
The entries are grouped for quarry use: first the discovery series that can show a change in collective output, then evidence on triage and demand, vendor demonstrations, fixed capability series, and finally benchmarks and measurement confounds. The group headings are navigation; every entry retains its stable anchor and its own evidentiary status.
Discovery and disclosure series
curl’s own vulnerability record, one codebase since 2000 (2000–2026)
Independent (the curl project’s own machine-readable security record), counted here. The best instrument in this log for the cyber domain, because it is the thing the log kept saying was missing: a fixed codebase, tracked for twenty-six years, with every finder credited and every issue severity-rated by the maintainers. That makes it possible to ask whether discovery accelerated, who did the finding, and whether what they found got shallower — on one target, without the population-growth confound that makes the aggregate series hard to read [→ NVD and KEV]. Every figure is this log’s count from curl.se/docs/vuln.json, vendored as problems/cyber-curl/curl-vulnerabilities.csv in the data repository.
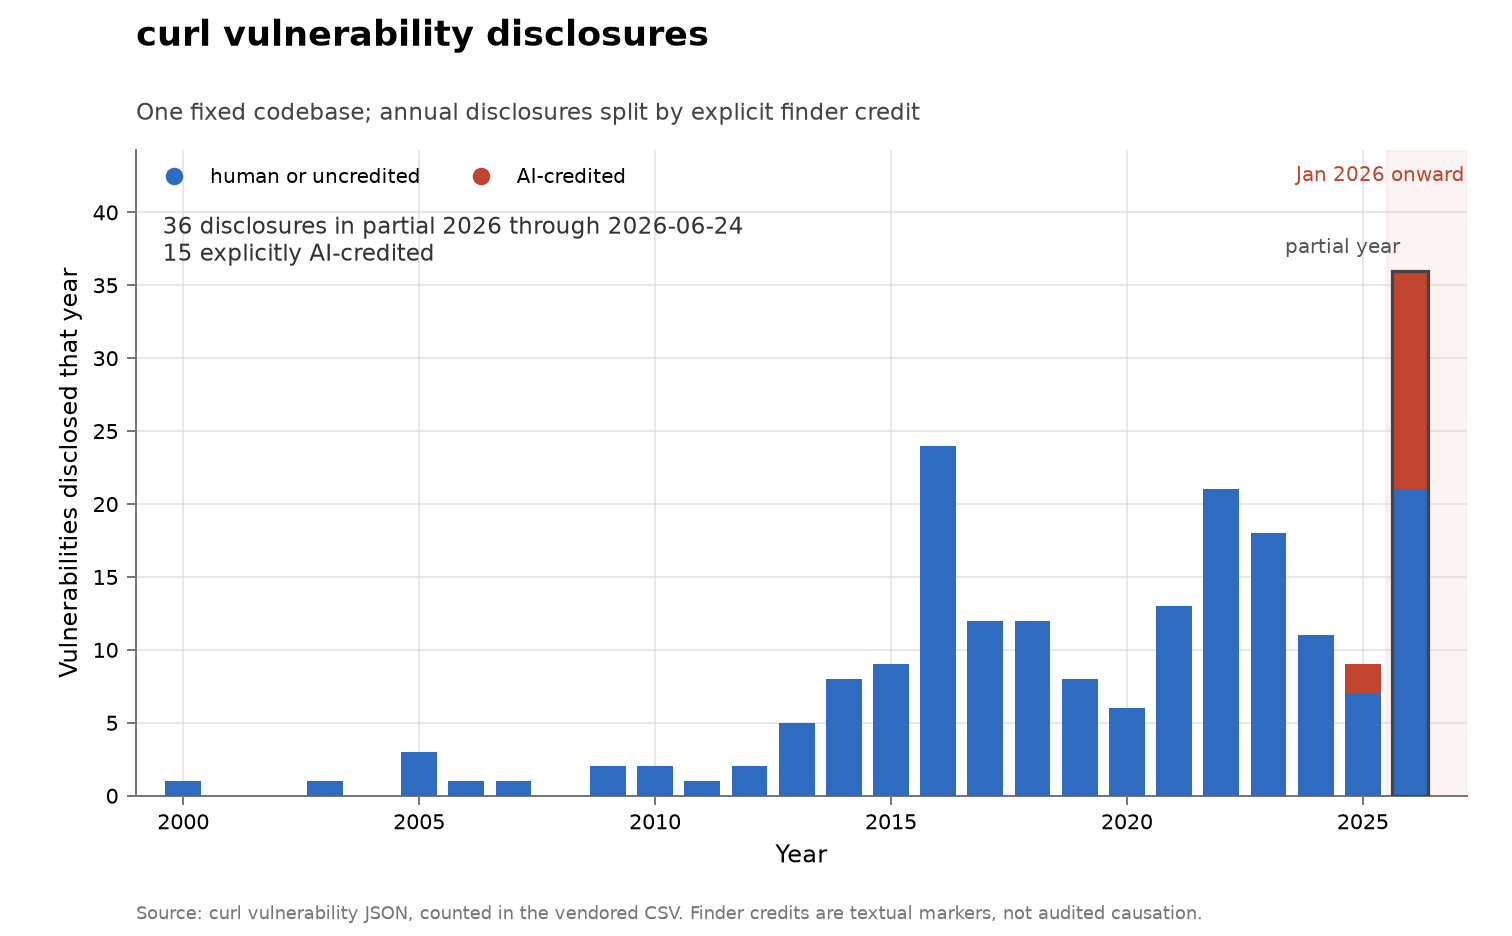
- Disclosures per year, counted here, 206 in total. The recent run: 2016: 24. 2017: 12. 2018: 12. 2019: 8. 2020: 6. 2021: 13. 2022: 21. 2023: 18. 2024: 11. 2025: 9. 2026: 36 through 2026-06-24. Nine years of a flat-to-declining count on a maturing codebase, then a fourfold jump in a part-year.
- The rate quadrupled. 13.7 disclosures a year across 2014–2023, against 22.6 a year annualized across 2024 to mid-2026 — and 2026 alone is running at about 72 a year. On a codebase whose bug stock should be depleting, not growing.
- AI-credited finders go from none to nearly half. No finder credit carries an AI marker before 2025. Then 2 of 9 in 2025 (Google Big Sleep, and Aisle Research) and 15 of 36 in 2026 — 42%. The 2026 names include “Andrew Nesbitt (powered by Mythos)”, “Filipe Casal of Trail of Bits in collaboration with OpenAI”, “Eunsoo Kim (Autonomous Code Security team at Microsoft)”, three separate HackerOne handles crediting AntAISecurityLab, and six from Aisle Research [→ Mythos, Big Sleep, AISLE].
- That share is a floor, not an estimate. The classification is by explicit textual marker in a finder credit — a named AI system, a lab whose stated business is AI code security, or the word “agent”. A researcher who used a model and did not say so counts as human here. The true AI-assisted share is therefore higher than 42% by an unknown margin.
- What AI finds is shallower than what humans found in the same year. Within 2026, on the same codebase and the same maintainer triage: AI-credited issues are 80% rated Low with none rated High or Critical, against 48% Low for the other finders. That is the apple-picking prediction — real fruit, disproportionately low — measured within a single year rather than inferred across sources.
- But the shift toward shallow findings began well before AI, and this cuts the finding down. Across 2010–2022, when no credit carries an AI marker, curl’s disclosures were 18% Low and 28% High or Critical. Across 2023–2025 the non-AI finds were already 67% Low and 3% High or Critical. So the severity collapse is a pre-existing trend on a hardening codebase, and AI continues and intensifies it rather than starting it. Reading the 2026 severity mix as an AI effect without this baseline would be wrong.
- Nothing rated High or Critical was found by anyone in 2026. Neither AI nor human finders produced a High or Critical issue in the part-year, which is consistent with a well-audited codebase whose serious flaws are largely gone, and which limits how much the fourfold rise in count is worth.
- The bug bounty closed in the middle of this. curl ended its programme in January 2026 after AI-assisted submissions reached about 20% of entries while genuine yield fell [→ curl]. So the 2026 surge in confirmed disclosures happened in the same year the project stopped paying for reports — the flood of low-quality submissions and the rise in real findings are the same phenomenon seen from two ends, and the maintainers’ own conclusion was that triage had become the binding constraint.
- Three limits. 2026 is a part-year through 2026-06-24, and disclosures arrive in batches at releases, so the within-year path is lumpy. Severity is the maintainers’ own rating, applied by a small team over twenty-six years, and may not be consistent across that span. And a finder credit records who reported, not how much effort any of them spent, so there is still no denominator of search effort.
- Dates: disclosures span 2000 to 2026, partial through 2026-06-24; fetched and counted 2026-07-28.
- Bears on: Q1 growth rate, Q2 autonomy, Q4 expertise, Q5 returns, Q7 incidence.
- Links: curl’s vulnerability record · human-readable list
- Status: verified — every count is this log’s own aggregation of the project’s published record, fetched 2026-07-28 and reproducible by re-running
collective_progress.pyin the data repository. Nothing is quoted as a source’s words: curl publishes the per-issue records and this log does the counting, the AI classification, and the severity comparison. The AI-marker list is in the script and should be read before the 42% figure is used.
OpenSSL’s vulnerability index, the highest AI-credited share here (2002–2026)
Independent (the OpenSSL project’s own vulnerability index), counted here. A third fixed codebase that credits a finder per CVE, and the one where the AI-credited share is largest. Alongside curl and Firefox it makes the fixed-codebase evidence a set of three rather than a single case. Every figure is this log’s count from the project’s published index, vendored as problems/cyber-openssl/openssl-vulnerabilities.csv in the data repository.
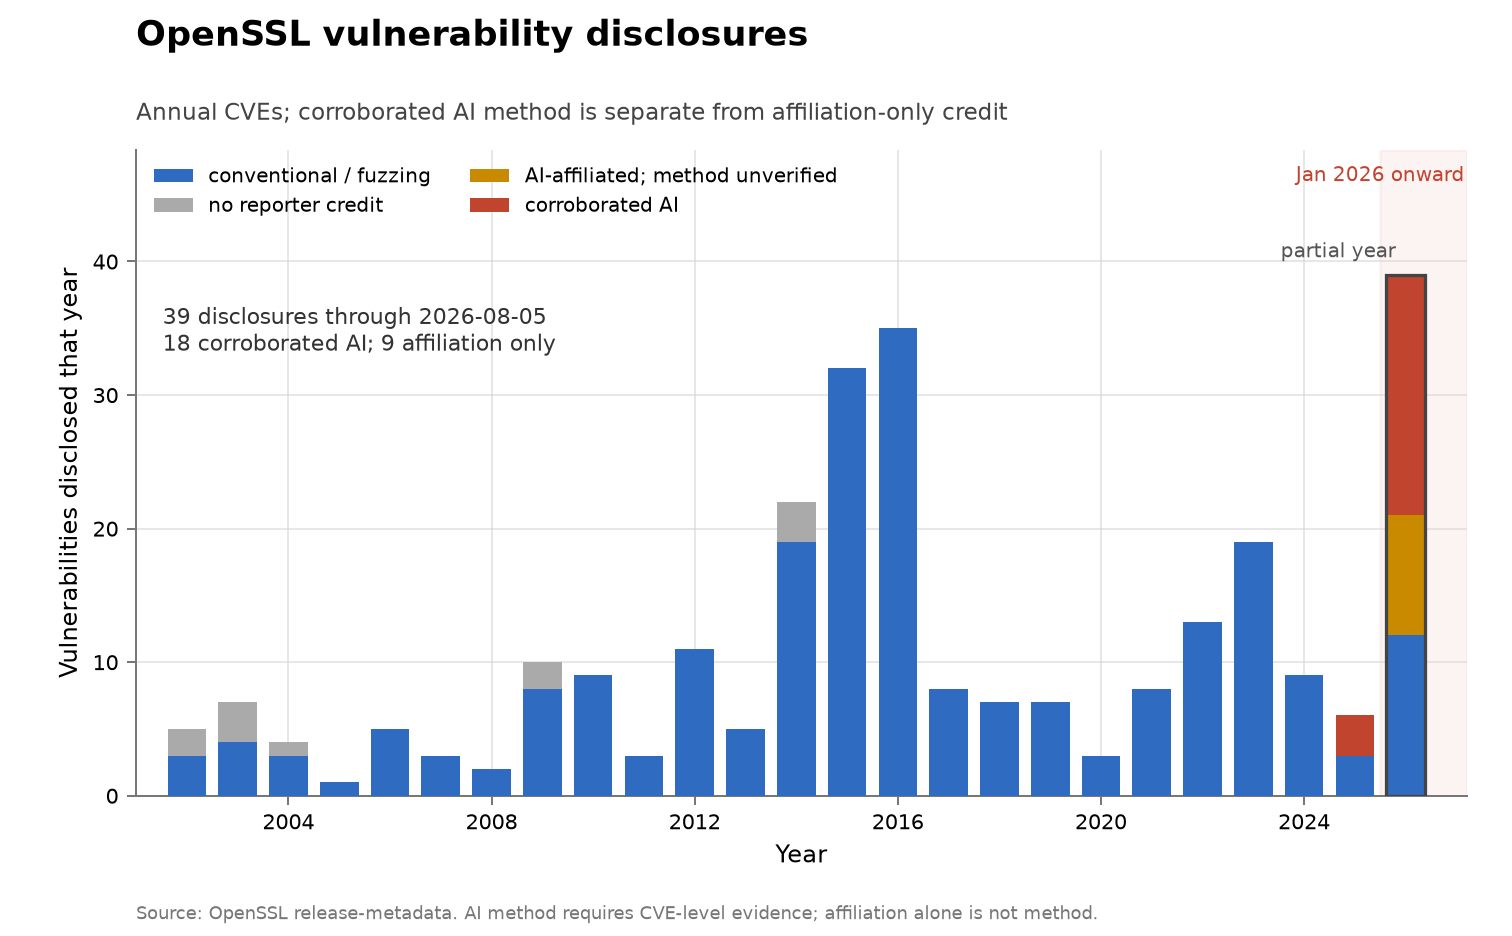
- CVEs per year, counted here, 272 of the 275 on the page parsed with a date. The recent run: 2020: 3. 2021: 8. 2022: 13. 2023: 19. 2024: 9. 2025: 6. 2026: 38 through 9 June. The tallest bars in the whole series are not recent, though — 2015 at 32 and 2016 at 35, the post-Heartbleed audit years.
- Two thirds of the 2026 disclosures are AI-credited, the highest share of any source here. 26 of 38, against 3 of 6 in 2025 and none before. The credits name Anthropic and Aisle Research repeatedly: 8 to Stanislav Fort of Aisle Research, 5 to Alex Gaynor of Anthropic, 4 to Luigino Camastra of Aisle Research, 2 to Igor Morgenstern of Aisle Research, and one to “Thai Duong (Calif.io in collaboration with Claude…)”.
- The same individual appears across codebases, which bounds how broad this is. Alex Gaynor of Anthropic is credited on OpenSSL issues and is also named in the seven-person team credited with 121 of Firefox’s 137 AI-credited CVEs [→ Firefox advisories]. So the AI-credited discovery visible across these three projects is not an independent sample of the world’s security researchers; it is substantially a few people with early access to strong tools, working on high-value targets. This observation is the log’s.
- Fuzzing is separated as in the Firefox entry, and it is small here. Three fuzzer-credited CVEs in 2023 and three in 2024, credited to “OSS-Fuzz” and “Google OSS-Fuzz-Gen”, none in 2025 or 2026. Note that “OSS-Fuzz-Gen” is an LLM-assisted harness generator, so the boundary between the fuzzing and AI categories is genuinely blurred in that one case; it is counted as fuzzing here because the credit names the fuzzer.
- The pre-AI history is what makes this useful. Twenty-four years of a small, security-critical library with a spiky record: a 2015–2016 peak from a deliberate post-Heartbleed audit push, then single digits for most of a decade. The AI-era jump is large but the series shows a comparable jump from a purely human cause a decade earlier, which is exactly the baseline a claim about AI needs.
- What it cannot support. There is no machine-readable feed: the JSON and XML endpoints OpenSSL once published both return 404, so this is parsed from HTML and 3 of 275 CVEs on the page could not be given a date. Severity is recorded on the page and is not analysed here. And as with the other two, a credit line is what the finder chose to say, so the AI share is a floor.
- Dates: CVEs span 2002 to 2026, partial through 9 June 2026; fetched and counted 2026-07-28.
- Bears on: Q1 growth rate, Q2 autonomy, Q4 expertise, Q7 incidence.
- Links: OpenSSL vulnerability index
- Status: verified — counts are this log’s own parse of the project’s published index, fetched 2026-07-28 and reproducible by re-running
collective_progress.pyin the data repository. The finder names are quoted verbatim from that index; everything else is this log’s arithmetic. Coverage is 272 of 275 CVEs, and the shortfall is recorded rather than hidden.
Mozilla’s Firefox advisories, a second fixed codebase with named reporters (2016–2026)
Independent (Mozilla’s own advisory repository), counted here. The only other fixed codebase in this log that credits a finder against every vulnerability, and far larger than curl. Mozilla publishes one YAML file per advisory with a reporter string per CVE, which makes the same attribution possible — and lets fuzzing be separated from AI, which curl’s record does not support. Every figure is this log’s count from the repository, vendored as problems/cyber-firefox/firefox-advisories.csv in the data repository.
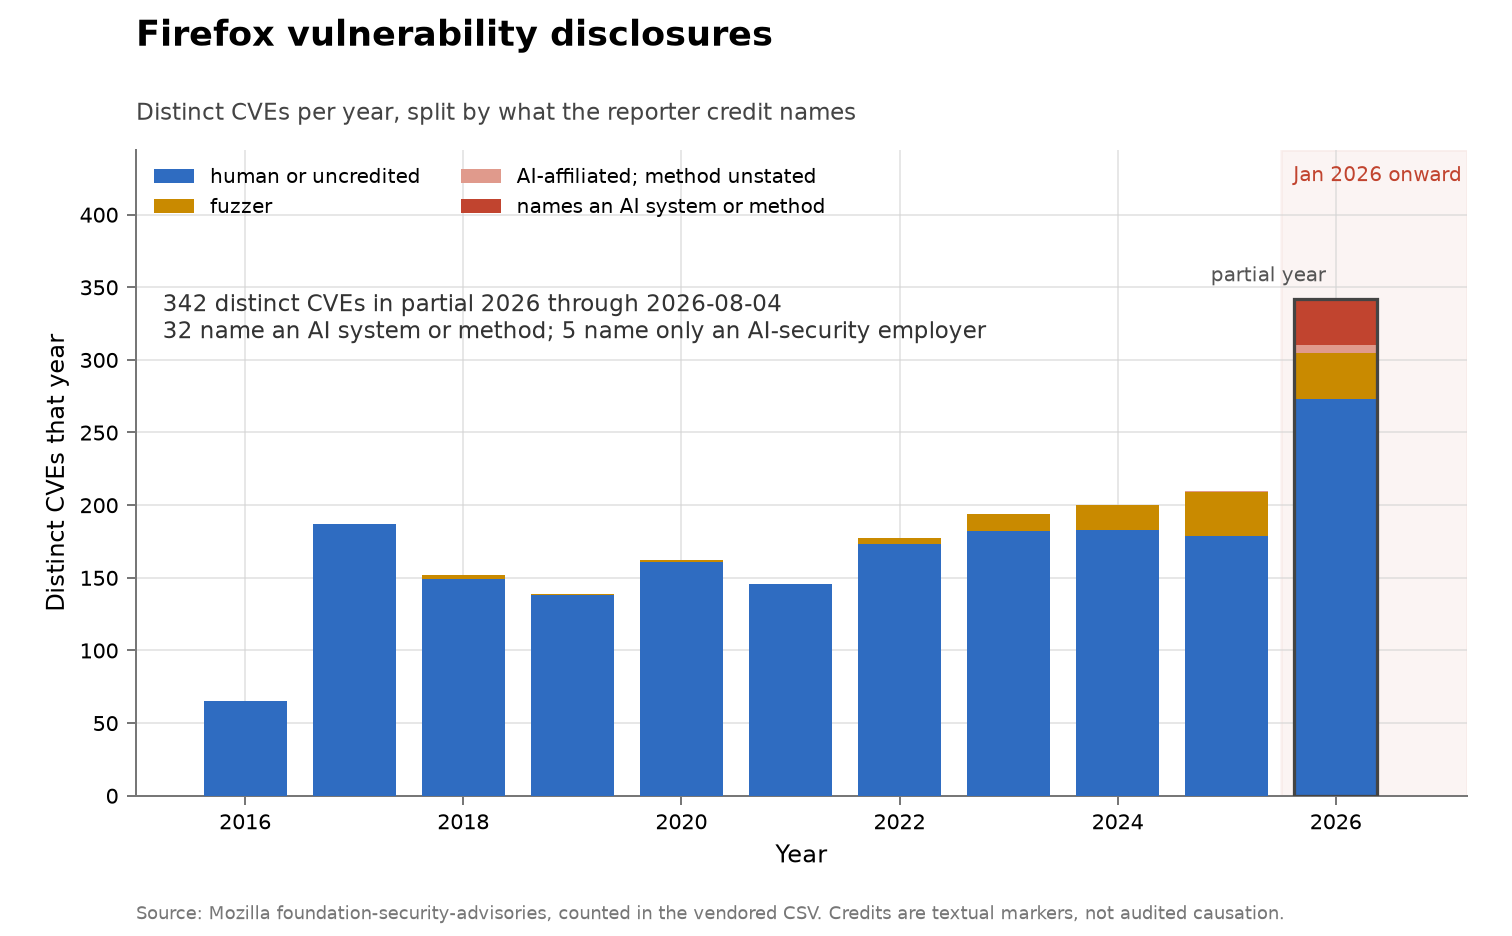
- CVEs per advisory year, counted here, 4,882 in total. 2016: 119. 2017: 429. 2018: 288. 2019: 317. 2020: 347. 2021: 284. 2022: 383. 2023: 440. 2024: 496. 2025: 640. 2026: 1,139 through late July. The part-year 2026 count is already 1.8 times the 2025 full-year total.
- AI-credited reports go from one to 137 in a year. No reporter string carries an AI marker until 2025, which has exactly one. In 2026 there are 137, or 12% of the year’s CVEs. The markers are explicit: Claude, Anthropic, OpenAI, GPT, Gemini, Big Sleep, Mythos, and the AI-security firms already in this log.
- The concentration is the finding, and it is extreme. Of those 137, 121 are credited to a single team — “Evyatar Ben Asher, Keane Lucas, Nicholas Carlini, Newton Cheng, Daniel Freeman, Alex Gaynor, and Joel Weinberger using Claude from Anthropic”. So roughly 11% of everything Firefox disclosed in 2026 traces to one coordinated effort with one tool. The remainder is 11 CVEs credited to Amy Burnett of OpenAI, two to Trail of Bits “in partnership with OpenAI”, two to “Claude, Kai Engert”, and one each to Aisle Research and OpenAI Preparedness. An aggregate framed as “AI is finding record numbers of flaws” is, on this codebase, mostly a handful of teams.
- Fuzzing is counted separately, and it plateaued. Reports whose credit names a fuzzer but no model: 7 in 2018, 8 in 2022, then 32, 41, 104 and 107 across 2023 to 2026. So fuzzer-credited discovery grew through 2025 and then flattened, while AI-credited discovery went from 1 to 137 in the same step. Keeping the two apart is deliberate: a fuzzer is automated without being a model, and merging them would attribute a decade of fuzzing to AI.
- The rise predates AI and is partly a process artifact. Counts roughly doubled from 2021 to 2025 with essentially no AI credit anywhere, so the trend was already upward. The 2017 spike to 429 and the low 2016 figure reflect Mozilla changing how advisories bundle CVEs rather than a discovery swing, so the series should not be read across 2016–2017. Nothing here isolates AI’s contribution from Firefox’s own growing security investment.
- What it cannot support. A reporter string is free text: Mozilla records what the reporter chose to say, so a researcher using a model without mentioning it counts as human and the 12% is a floor. There is no severity comparison here of the kind the curl record allows, because advisory
impactis set per advisory as well as per CVE and this log has not untangled the two. And an advisory count is a disclosure count, not a discovery count. - Dates: advisories span 2016 to 2026, partial through late July 2026; fetched and counted 2026-07-28.
- Bears on: Q1 growth rate, Q2 autonomy, Q4 expertise, Q7 incidence.
- Links: Mozilla advisory repository · rendered advisories
- Status: verified — every count is this log’s own aggregation of Mozilla’s published YAML, fetched 2026-07-28 and reproducible by re-running
collective_progress.pyin the data repository. Nothing is quoted as a source’s words except the reporter string above, which is quoted verbatim from the advisory data. The AI and fuzzing marker lists are in the script and should be read before either share is used.
OSS-Fuzz: a decade of automated discovery, declining (2020–2026)
Independent (Google’s OSS-Fuzz service, via the OSV archive), counted here. The automated-but-not-AI baseline the cyber domain otherwise lacks: continuous fuzzing of hundreds of open-source projects, with every finding published as a dated record. It is here because it answers the obvious alternative explanation for panels 1 and 2 — that automation in general finds more bugs — and it answers it in the negative.
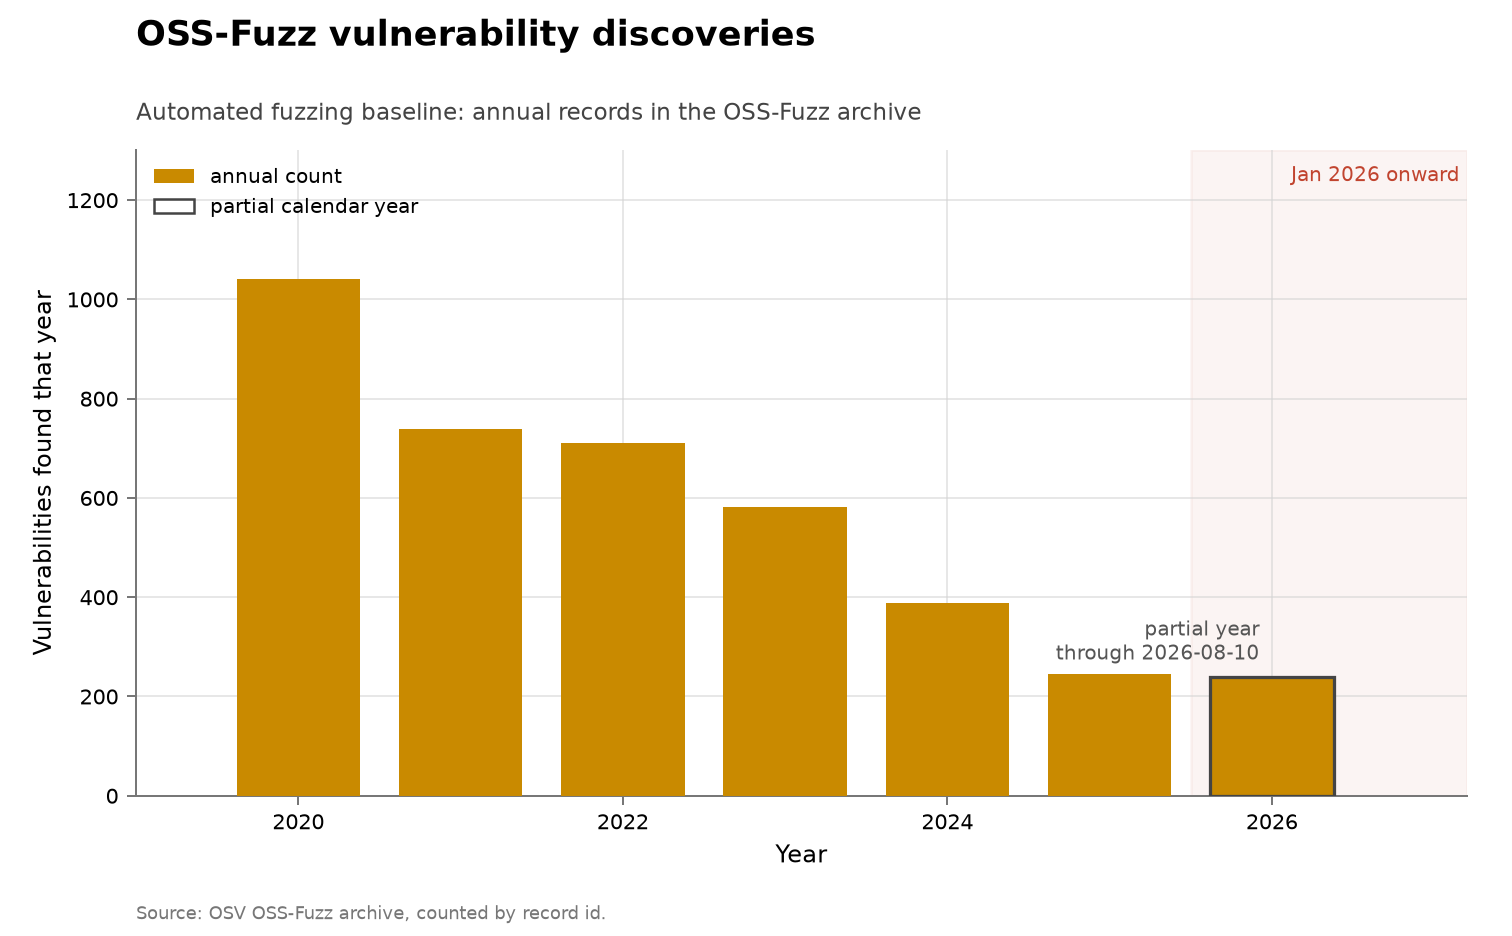
- Discoveries per year, counted here, 3,934 records from 2020 on. 2020: 1,041. 2021: 739. 2022: 710. 2023: 581. 2024: 388. 2025: 244. 2026: 231 through late July, which annualizes to about 396. A fourfold decline from 2020 to 2025, then a partial-year uptick that remains far below the start.
- The year is taken from the record identifier, not the publication date, and this matters. OSV identifiers carry the year (
OSV-YYYY-N). Records predating 2020 were backfilled into OSV during 2021, so theirpublisheddates all land in 2021 and would inflate that year by 259 while emptying 2016 to 2019. The two fields agree closely from 2020 onward — 1,041 against 1,031 for 2020, 710 against 716 for 2022 — so the series is reported from 2020 and the 267 earlier records are dropped. Usingpublishednaively would have produced a spurious 2021 peak. - Falling yield on a growing target set is the depletion pattern. OSS-Fuzz has onboarded projects continuously over the period, so the search space grew while the findings fell. That is what a fixed technique exhausting the reachable bugs in a codebase looks like, and it is the clearest example in this log of automated search depleting its own frontier without any AI involved.
- Why it constrains the AI story. Whatever produced the 2026 rises in the curl and Firefox records, it is not automation as such: the largest and longest-running automated discovery programme in open source was finding a quarter as many bugs in 2025 as in 2020. This comparison is the log’s.
- What it cannot support. These are the findings OSS-Fuzz chose to publish through OSV, so a change in disclosure practice would move the series and this log cannot rule that out. The project set is not fixed, so this is not a clean per-codebase depletion curve. And the records carry no severity, so nothing here speaks to how serious the declining finds were.
- Dates: records span 2020 to 2026, partial through late July 2026; fetched and counted 2026-07-28.
- Bears on: Q1 growth rate, Q5 returns, Q7 incidence.
- Links: OSV OSS-Fuzz archive · OSV · OSS-Fuzz
- Status: verified — counts are this log’s own aggregation of record identifiers in the OSV archive, fetched 2026-07-28 and reproducible by re-running
collective_progress.pyin the data repository. Nothing is quoted as a source’s words. The decision to use the identifier year rather than the publication date, and the reason for it, are recorded above and in the script.
NVD disclosures against CISA’s exploited-vulnerability catalog (2016–2026)
Government (US NIST National Vulnerability Database and CISA Known Exploited Vulnerabilities catalog), counted here. The two aggregate series behind the claim that AI has bent the cyber discovery curve, fetched from the primary sources so the reporting’s arithmetic can be checked rather than trusted [→ Bloomberg]. NVD counts what gets disclosed; KEV counts what gets used against someone. Neither is quotable prose — every figure below is this log’s count from the APIs, vendored in the data repository as problems/cyber-nvd-disclosed/nvd-by-year.csv and problems/cyber-kev-exploited/kev-by-year.csv, each beside the fetcher that built it.
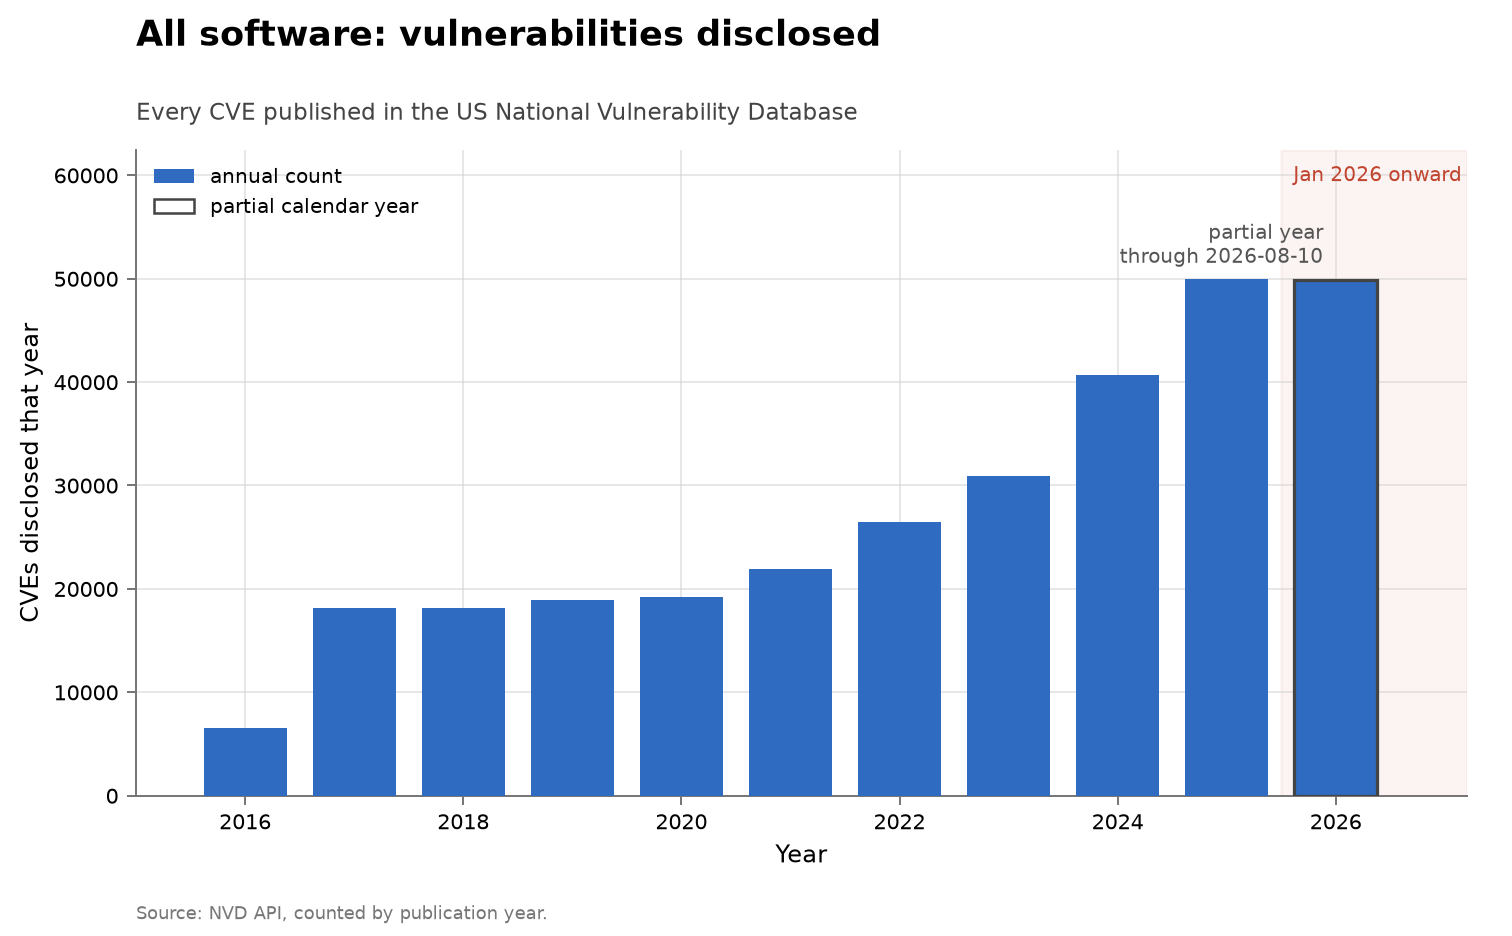
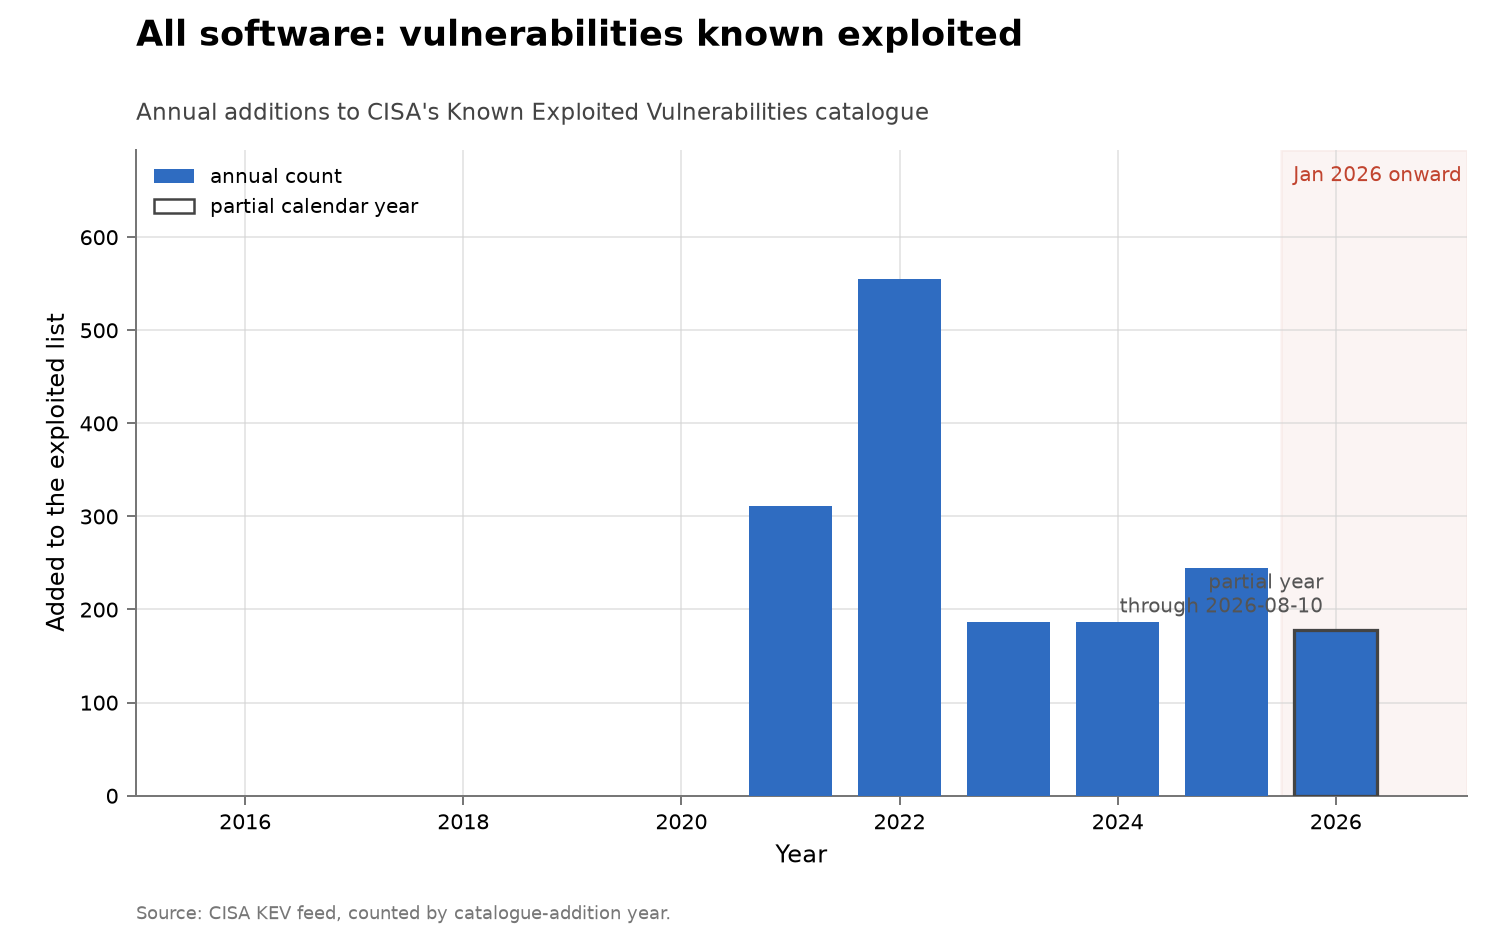
- Disclosures per year, counted here. 2016: 6,517. 2017: 18,113. 2018: 18,154. 2019: 18,938. 2020: 19,222. 2021: 21,950. 2022: 26,431. 2023: 30,949. 2024: 40,704. 2025: 49,972. 2026: 45,601 through 2026-07-28.
- The reported figure checks out. Bloomberg gives 45,207 for 2026 to date against the 45,601 counted here a day later; NVD is continuously amended, so the small gap is expected. Its two supporting statements also hold: 2026 to date is indeed “approaching” the 2025 total, and 2025 at 49,972 was indeed a record.
- The headline claim does not check out. “On pace to roughly double” 2025 would require about 99,900 disclosures in 2026. The 45,601 recorded through day 209 of the year annualizes to about 79,600, which is 1.6 times 2025 rather than twice it. Doubling would need the rate to rise sharply over the remaining five months. This log’s arithmetic; the article may also be conflating scopes, since its headline claim is about “popular technology products” while the figure it cites is all of NVD.
- The rise is an acceleration of a long pre-AI trend, not a departure from a flat one. Year-on-year growth was +32% into 2024 and +23% into 2025, both before any of this, against about +59% annualized for 2026. So the curve was already steepening for years without AI, and 2026 continues it faster. Reading 2026 against a flat baseline would overstate the effect by a wide margin, and no source in this log makes the comparison against the pre-AI slope. This is the same shape as curl, where the shift toward shallow findings also predates AI [→ curl vulnerabilities].
- A process break makes the early years unusable. Disclosures nearly tripled from 2016 to 2017, which reflects the expansion of CVE numbering authorities rather than a discovery surge. Treat the series as comparable from about 2018 and be wary of any claim resting on a multi-year ratio across that break.
- Exploitation rose far less than proportionally, which is the important part. CISA added 245 entries to the exploited catalog in 2025 and 171 through day 209 of 2026, annualizing to about 299 — roughly +22% against +59% for disclosures. The share of a year’s disclosures that appear in the catalog fell from 0.49% to 0.37%. The article’s “no rise in the number of exploited issues” is therefore slightly generous: there is a modest rise, but the proportion of found flaws that become known-exploited fell, which supports the same conclusion more precisely than the article states it.
- Three limits on the KEV comparison, all this log’s. The catalog only began in November 2021, so there is no pre-2021 baseline. An entry’s date is when CISA added it, not when the flaw was found, so the two series are not aligned by cohort. And the catalog records exploitation that was observed and published by a US agency, which is a floor on real exploitation and a policy artifact besides.
- What these series cannot establish. A disclosure count measures publication, not discovery: it rises when vendors process more reports, and one vendor’s internal pipeline can move the aggregate, as the reported Chrome figure shows. There is no denominator of search effort anywhere in either series, no attribution of any disclosure to AI, and no fixed codebase — so the population being searched grows along with the count. For a fixed target with named finders, the curl series is the better instrument and the two should be read together [→ curl vulnerabilities].
- Dates: disclosure counts cover 2016 to 2026, with 2026 partial through 2026-07-28; the exploited catalog begins November 2021 and was read complete at 1,655 entries; both fetched 2026-07-28.
- Bears on: Q1 growth rate, Q7 incidence, Q8 benchmarks.
- Links: NVD API · NVD · CISA Known Exploited Vulnerabilities catalog · KEV JSON feed
- Status: verified — every count is this log’s own query against the two government APIs on 2026-07-28, reproducible by re-running
collective_progress.pyin the data repository, and nothing is quoted as a source’s words. The annualization, the growth rates, and the KEV-to-NVD ratios are this log’s arithmetic. The correction to the “roughly double” claim follows from the counts and is stated as this log’s, not as a source disputing another.
Bloomberg: AI finding twice as many cyber flaws in 2026 as 2025 (2026)
Independent (journalism, Bloomberg News). Reporting that aggregate vulnerability discovery roughly doubled in 2026 and attributing the surge to AI. It is the broadest claim in this log that a domain-level discovery curve has bent, and it names the counterweight in the same piece: exploitation did not rise with it. Every figure below is quoted because they are all secondhand here — the underlying counts are recorded separately from their primary sources [→ NVD and KEV].
- The headline claim, with its own hedge. “The number of software security flaws discovered in popular technology products in 2026 is on pace to roughly double the tally of vulnerabilities that surfaced in 2025, an explosion driven by increasingly capable artificial intelligence systems.” Note that “on pace to” is an annualization of a part-year count, not an observed total.
- The aggregate figure and its denominator problem. “The US National Vulnerabilities Database, a repository of digital security holes, recorded 45,207 flaws between January and Monday, a count approaching the total number found in all of 2025. Last year saw an all-time record for recorded vulnerabilities in that database.” So the comparison is against a year that was itself a record, and the article does not give the 2025 total.
- Three vendor-level figures, which are the most striking numbers in the piece. Oracle “said it patched 1,449 security vulnerabilities in its monthly July software update, an all-time record for the 49-year-old tech giant, while the same update last year contained 309 fixes.” Microsoft “disclosed 642 security bugs in July, another all-time high and nearly five times the count in the same month last year.” Google “found and fixed 433 such bugs in a recent update to the Chrome browser versus 11 in an equivalent update one year ago” — a thirty-nine-fold rise on a single-month comparison.
- Most of the Chrome finds came from inside Google, which bears on who is doing the finding. “Of the 433 vulnerabilities in Chrome in July, 401 were ‘reported by Google’ internally, according to the company.” Chrome’s director of engineering Doug Turner attributes the “unprecedented scale and speed” of discovery to “advances in AI models and a corresponding investment.” So this is a well-resourced vendor turning AI on its own code, not an external market of finders.
- Exploitation did not rise, and this is the load-bearing negative. “There’s been no rise in the number of exploited issues this year despite the uptick in discovered flaws, according to the US government’s Known Exploited Vulnerabilities catalog.” Dustin Childs of Trend Micro: “We just aren’t seeing the numbers to back up the doom and gloom prophets.” A quadrupling of found flaws with flat exploitation is the clearest available evidence that the marginal discovered vulnerability is worth much less than the average one.
- A countervailing figure on speed, from a single source. “The average time it took attackers to exploit vulnerabilities dropped from 72 hours last year to just 24 hours in 2026, said Alexander Leslie, senior advisor at the cybersecurity firm Recorded Future Inc.” This is one firm’s estimate with no method given, and it is in tension with the flat KEV count; the article does not reconcile them.
- The practitioner framing is about people, not autonomy. Gabriel Bernadett-Shapiro of SentinelOne: “We have to come to the reckoning that these tools are increasing the ability of people to find vulnerabilities in software.” That is an acceleration claim rather than a replacement claim, and it is the only characterization of the mechanism the article quotes.
- Named systems and events it points at. Anthropic’s Mythos “found thousands of software vulnerabilities in early testing” [→ Mythos]; OpenAI “has developed comparable tools”; the NSA has been testing Mythos against Microsoft technology; Microsoft released a tool called MAI-Cyber-1-Flash on 2026-07-27; and OpenAI disclosed on 2026-07-21 that its own agents breached Hugging Face in an incident that “took hours, compared to the weeks it likely would have taken a human,” with the models “operating without the usual safety guardrails” because they were meant to stay inside an isolated test environment.
- The article was corrected after publication, and this log records that per its own rule. The footnote reads: “(Updated to include additional context in final paragraph. A prior version of this story corrected third and fourth paragraphs to fix misspelled name and reflect that Google issued its numbers in July.)” The third and fourth paragraphs are the ones carrying the Oracle, Microsoft and Chrome figures, so the vendor numbers above are the corrected versions.
- What it cannot support. NVD counts are disclosures, not discoveries: a count rises when vendors publish more, and the article’s own Chrome datum shows a single vendor’s internal process moving the aggregate. Nothing here separates more finding from more reporting, none of the AI attribution is quantified, and no denominator of search effort appears anywhere. The article is a signpost to the primary series rather than a measurement. This reading is the log’s.
- Dates: published 2026-07-27 11:01 PDT, updated 11:45 PDT; the NVD count covers 2026-01-01 to 2026-07-27; the vendor figures are July 2026 updates against July 2025; retrieved and read 2026-07-27.
- Bears on: Q1 growth rate, Q2 autonomy, Q3 demand, Q7 incidence, Q8 benchmarks.
- Links: Bloomberg · Microsoft’s MAI-Cyber-1-Flash announcement
- Status: verified as to wording — the full article text was read twice, once through a browser session and once from a copy supplied by the repository owner, and the two agree; retrieved 2026-07-27. Unverified as measurement: every count is the reporter’s, and the NVD and KEV series are recorded separately from the primary sources so the article’s arithmetic can be checked rather than trusted [→ NVD and KEV]. Bloomberg is paywalled and blocks automated fetches, so a later reader may need the gift link or a browser session.
Triage, validation, and labour demand
curl ends its bug bounty (2026)
Independent (maintainer report). curl ended its bug-bounty program (Jan 2026) after “AI slop” swamped triage.
- AI-assisted submissions reached ~20% of entries in 2025 while genuine-vulnerability yield fell; Daniel Stenberg likened the flood to a DoS. Evidence that validation/triage, not discovery, is becoming the binding constraint.
- Dates: program closed January 2026, reported 2026-01-21; the ~20% AI-assisted share refers to 2025 submissions.
- Bears on: Q3 demand, Q5 returns.
- Links: The Register
- Status: verified (secondary reporting of a first-party announcement).
NIST on record CVE growth and the enrichment backlog (2026)
Government (NIST, National Vulnerability Database). The denominator underneath the whole cyber section: how fast disclosed vulnerabilities are accumulating, and the fact that the human enrichment step cannot keep pace. This is the substrate AI discovery adds to, and separately it is a validation bottleneck measured in a national institution’s own throughput.
- Submission growth, in NIST’s own figures. “CVE submissions, which increased 263% between 2020 and 2025,” and the acceleration continues: “Submissions during the first three months of 2026 are nearly one-third higher than the same period last year.”
- Productivity rose and still lost ground, which is the validation-bottleneck claim as an operational fact. “We enriched nearly 42,000 CVEs in 2025 — 45% more than any prior year,” but “this increased productivity is not enough to keep up with growing submissions.”
- This is not evidence of AI uplift, and must not be used as such. CVE growth is multi-causal — more software, more researchers, more numbering authorities — and NIST attributes none of it to AI. Its use is as the base rate any claimed AI contribution to discovery sits on top of, and as independent corroboration that verifier throughput binds [→ validation bottleneck, curl]. The caveat is this log’s.
- Dates: published 2026-04-15; the submission series covers 2020 to the first quarter of 2026.
- Bears on: Q1 growth rate, Q3 demand, Q7 incidence.
- Links: NIST announcement
- Status: verified — all three figures checked verbatim against the NIST page, retrieved 2026-07-26.
Gemini and developer experience: security of the resulting code (2026)
Independent (academic, controlled study). A quantitative programming study with 159 developers recruited on Upwork, assigned a security-related task with no AI, free Gemini, or paid Gemini. It is the only entry in this log that measures AI’s effect on a security outcome by user experience, which is the Q4 question in the cyber domain.
- AI access did not significantly improve code security. No significant difference between the AI conditions and the control on the security of the resulting software, and none between the free and paid versions.
- Prior experience did, and was not substitutable. Programming experience significantly improved code security, and the authors conclude it “cannot be fully substituted by Gemini.” Developers with no security experience did show improvement when supported by Gemini, so the effect is a partial floor-raise rather than a ceiling-raise.
- The direction contrasts with the discovery-side results. Everything else in the cyber section measures finding vulnerabilities, where AI performs well; this measures not introducing them, where it does not. If the same models are strong at detection and neutral at prevention, the net effect on the stock of bugs in the world is not signed by the discovery evidence alone.
- Scope caveats. Freelancer recruitment, one task, one tool, and a null result on a sample of 159 — underpowered for small effects, and the absence of a difference is not evidence of equivalence.
- Dates: arXiv 2026-03-16 (v2 2026-03-17).
- Bears on: Q3 demand, Q4 expertise.
- Links: arXiv 2603.15298
- Status: verified-abstract — checked against the arXiv abstract and conclusion, retrieved 2026-07-26.
Cyber labour-market indicators (2026)
Industry surveys and job-posting data; not academic. Two 2026 datasets on what AI is doing to demand for security staff. Neither is a causal estimate and both come from parties with an interest in the answer, but together they are the only quantitative purchase this log has on Q3 in the cyber domain, where the argument currently reasons from curl’s bug bounty and ARTEMIS’s hourly rates.
- Headcount reduction is rare; role composition is shifting. The SANS 2026 workforce survey of nearly 1,000 practitioners across six regions reports 49% of organizations seeing reduced manual analysis time and 48% workflow automation gains, but only 16% reporting actual headcount reduction. Among organizations reporting role changes, reductions concentrate in SOC and security analysts (32%), threat intelligence analysts (26%), and incident responders (22%).
- The reductions fall on the entry level, and new senior categories are appearing. Among organizations adding roles, 34% added AI/ML security specialists, 32% AI security engineers, and 30% AI governance analysts. SANS reports expert-level roles are now the hardest to fill. The stated concern is that AI is automating precisely the junior work through which the next generation trained.
- Job postings show the shift as early and small. An analysis of 5,197 AppSec postings across 796 companies from October 2025 to May 2026 finds AI mentioned in 20.8% of enriched descriptions, with prevalence rising from 2.1% in November 2025 to 7.2% in May 2026, and a 10.9% salary premium on AI-mentioning roles. Only 1.6% of all postings carry AI terms in the title.
- How to read this against the theories. Composition shifting toward senior judgement while entry-level enumeration contracts is task replacement’s reallocation prediction, not human replacement’s level effect. It is also consistent with apple-picking, where the reachable zone is exactly the routine work. It does not discriminate between them.
- Treat both as weak evidence. A self-selected practitioner survey and a job-posting scrape measure stated intentions and advertising language, not employment or wages. Neither has a counterfactual.
- Dates: SANS 2026 Cybersecurity Workforce Research Report presented at RSAC 2026, with secondary coverage 2026-07-22; its exact release date is not established. The AppSec posting analysis is dated 2026-05-26 and covers October 2025 to May 2026.
- Bears on: Q3 demand, Q4 expertise.
- Links: SANS announcement · Help Net Security coverage · AppSec hiring analysis
- Status: unverified — figures are quoted from the publishers’ own summary pages, retrieved 2026-07-26; neither underlying dataset has been inspected and neither is peer-reviewed.
HackerOne: platform statistics on agent-submitted reports (2025)
Vendor (HackerOne), platform self-report. The only source in the log giving a platform-wide count of vulnerability reports filed by autonomous systems, alongside AI adoption among human researchers. It is marketing material with a commercial interest in both halves of the story, and the figures cannot be audited from outside.
- Autonomous submissions, with the platform’s own framing. “Autonomous agents submitted 560+ valid reports,” which HackerOne calls “the start of the hackbot arms race.”
- Human researchers have adopted AI nearly universally. “70% of surveyed researchers now use AI tools in their workflow” — which bears on Q3 in a direction the log’s other cyber-demand entries do not capture: the humans are not being replaced so much as retooled.
- Report volume and payout denominators. “AI vulnerabilities increased by more than 200% this year”; “HackerOne bug bounty programs collectively paid out $81 million”; “1,121 distinct customer programs included AI in scope in 2025.”
- The headline figure disagrees with the body, in the same document. The press release headline gives a 210% spike where the body says “more than 200%.” Recorded per this log’s rule on revised and inconsistent figures; use “more than 200%”.
- What it cannot support. 560 valid reports has no denominator — total agent submissions are not published — so it cannot be compared with XBOW’s 132 confirmed out of about 1,060 [→ XBOW], which is the one place in the log where the agent-submission denominator is visible.
- Dates: press release 2025-10-01; the underlying survey covers roughly mid-2024 to 2025.
- Bears on: Q2 autonomy, Q3 demand, Q7 incidence.
- Links: HackerOne press release · report landing page
- Status: verified as to wording, unverified as measurement; vendor. The four quotes were checked verbatim against the press release, retrieved 2026-07-26, so the claims are verified as having been made. The underlying report was not opened and none of the figures is independently auditable.
Vendor demonstrations and deployments
Google Big Sleep (2025)
Vendor (Google). Autonomous vulnerability-discovery agent from Google DeepMind and Project Zero.
- Live SQLite zero-day (July 2025). Found CVE-2025-6965, a memory-corruption flaw affecting all SQLite versions before 3.50.2, that was “known only to threat actors and… at risk of being exploited,” and cut it off before exploitation. Google framed it as “the first time an AI agent has been used to directly foil efforts to exploit a vulnerability in the wild.”
- 20 novel open-source bugs (Aug 4 2025). Twenty previously-unknown vulnerabilities in widely-used OSS (FFmpeg, ImageMagick, etc.), “found and reproduced autonomously,” with a human only in final review.
- Caveat. Big Sleep’s original Nov-2024 SQLite find was in a development branch before release, so it never hit production — a genuine unknown bug but not an in-the-wild zero-day. The July-2025 CVE is the stronger “real threat” case.
- Dates: first SQLite find November 2024, in a development branch; CVE-2025-6965 announced 2025-07-15; the twenty-bug disclosure 2025-08-04.
- Bears on: Q2 autonomy, Q4 expertise.
- Links: cloud.google.com · blog.google · TechCrunch
- Status: quotes verified by direct fetch; figures are vendor self-reports.
Anthropic Mythos preview (2026)
Vendor (Anthropic). Frontier cyber model preview (April 2026); all figures are self-reports.
- Headline claims. Mythos “autonomously discovered thousands of previously unknown vulnerabilities,” including a 27-year-old OpenBSD DoS and a 16-year-old FFmpeg out-of-bounds write that fuzzers had exercised “5 million times without triggering.”
- Cost accounting (vendor-reported). OpenBSD 27-year bug: found across “~1,000 scaffold runs at a total cost under $20,000”; the single successful run “cost under $50” — Anthropic stresses $50 “only makes sense with full hindsight, since… they can’t know in advance which run will succeed.” FFmpeg: several vulnerabilities after “several hundred runs… roughly ten thousand dollars”; three fixed in FFmpeg 8.1. N-day exploitation: “developing a full root exploit from a known vulnerability costs under $1,000 and takes half a day.”
- Depth claim. Anthropic presents the OpenBSD SACK bug as requiring reasoning about signed integer overflow — i.e. not a one-step mechanical find.
- Dates: preview posted early April 2026. The page metadata reads 2026-04-09, but AISLE’s response to it is dated 2026-04-07, so the metadata is probably a modification date and the true posting date is unresolved.
- Bears on: Q1 growth rate, Q7 incidence, Q8 benchmarks.
- Links: red.anthropic.com
- Status: unverified (quotes not yet checked against the primary post); vendor. The “thousands” figure is unaudited.
XBOW on HackerOne (2025)
Vendor (XBOW), with public leaderboard data. Autonomous pentester that topped a HackerOne leaderboard.
- Steep sub-linearity in value per run. Of ~1,060 submissions, only ~132 were confirmed and resolved, with ~208 duplicates and ~209 “informative.” Re-running the picker mostly re-finds picked apples.
- Composition. Finds are dominated by web-app classes (RCE, info disclosure, cache poisoning, SQLi) on a large, heterogeneous, under-audited attack surface.
- Dates: leaderboard placement reported June 2025; the skeptical companion piece is dated 2025-06-29; XBOW’s own post carries no visible date.
- Bears on: Q3 demand, Q5 returns, Q7 incidence.
- Links: xbow.com · skeptical: raw.pm
- Status: unverified; vendor. The submission and duplicate counts are XBOW’s own and have not been checked against the HackerOne leaderboard here; the skeptical companion piece disputes the framing rather than the counts. An earlier version of this line gave the provenance without saying how far the figures had been checked, which left the entry unclassifiable.
Vidoc Security reproduction (2026)
Independent (security firm). Reproduced the finding of Mythos-class bugs with public models “but they didn’t build the weapon” — detection is cheap, deep exploit development is hard.
- Dates: posted 2026-04-09 per the page’s own metadata, within about two days of the Mythos preview — which bounds how much reproduction work the claim can represent.
- Bears on: Q1 growth rate, Q4 expertise.
- Links: vidocsecurity.com
- Status: unverified quote.
AISLE: the jagged frontier (2026)
Independent (security research firm). Post-Mythos analysis of model capability across isolated cyber tasks.
- Rankings reshuffle. “There is no stable best model across cybersecurity tasks… capability rankings reshuffle completely across different security tasks.” GPT-OSS-120b recovered the public OpenBSD SACK chain but failed a simple Java
ArrayListdata-flow trace, while several smaller models succeeded. - Cheap detection. In AISLE’s isolated-code test, even a model with 3.6B active parameters priced at $0.11 per million tokens detected the showcased buffer overflow — detection on preselected code, not repo-scale discovery.
- Caveat. Tests used isolated code and plain API calls rather than end-to-end autonomous discovery.
- Dates: posted 2026-04-07.
- Bears on: Q7 incidence, Q8 benchmarks.
- Links: aisle.com
- Status: verified against the primary post.
Palo Alto Networks Mythos deployment (2026)
Vendor claim, contested. The Information reported Mythos at Palo Alto Networks “found more than two dozen critical vulnerabilities in about three weeks… burned through more than $1 million worth of tokens.”
- Implied costs. The offcuts post plots this at ≈$42k/bug average, with marginal cost approaching a guessed human rate of ≈$100k/bug.
- Skeptical note. The “5×” / “75 bugs vs 5–10/month” framing is contested as a reporting/attribution artifact (26 CVEs counted as 75 issues). Treat vendor “N× more bugs” framing as marketing until independently confirmed.
- Dates: deployment described as about three weeks, spring 2026; Axios follow-up 2026-05-13. The Information’s original is paywalled and its date is not confirmed here.
- Bears on: Q1 growth rate, Q8 benchmarks.
- Links: The Information · flyingpenguin.com · Axios
- Status: unverified; numerator, denominator, and token spend not reproducible from primary inputs.
UK AISI Mythos runs, via dbreunig (2026)
Independent runs, secondary summary. Drew Breunig’s summary of the UK AI Security Institute’s Mythos evaluations.
- No diminishing returns at 100M tokens. “None of the models given a 100M budget showed signs of diminishing returns” — the basis for his “cybersecurity is proof-of-work now” framing (you win by spending more).
- Budgeting. “100M tokens per attempt, $12,500 per Mythos attempt, $125k for all ten runs.”
- Dates: Breunig’s summary posted 2026-04-14; the underlying AISI runs are not separately dated on the page.
- Bears on: Q4 expertise, Q5 returns, Q8 benchmarks.
- Links: dbreunig.com
- Status: verified against the blog post; underlying AISI data not independently checked.
Fixed capability and cost series
DARPA AIxCC finals (2025)
Government (DARPA). AI Cyber Challenge finals, DEF CON, August 2025 — the strongest non-commercial anchor for autonomous discovery, and the only source in this log that measures the same task set at two dates a year apart.
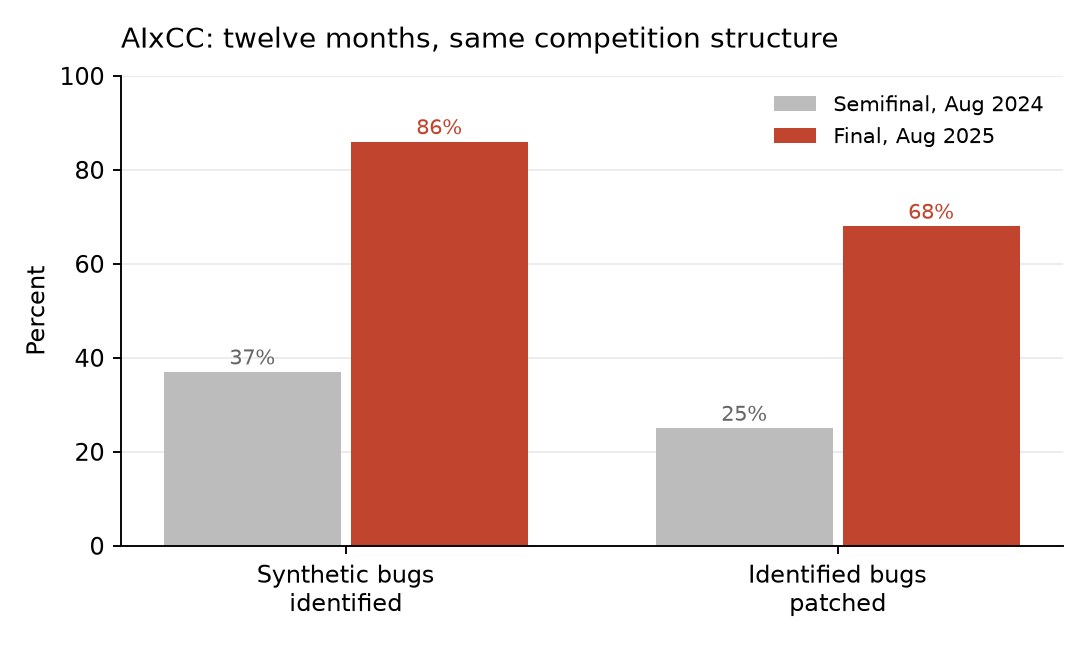
Derived from the figures in this entry rather than reproduced from DARPA. Both rates roughly doubled or better across twelve months on a fixed competition structure — but the teams rebuilt their systems between the two, so this is progress in the whole stack rather than in the models alone.
- Seven fully autonomous systems, 54 million lines of code. Team Atlanta won, Trail of Bits second, Theori third. Systems ran without human intervention on real open-source software.
- 18 genuine zero-days, with a denominator alongside. Teams found 18 real, non-synthetic vulnerabilities — 6 in C codebases (one of which maintainers found and patched in parallel) and 12 in Java — and supplied 11 patches for them. Separately, on the competition’s synthetic bugs they found 54 of the 63 planted across the challenges and patched 43.
- A dated year-over-year capability comparison on a fixed benchmark. Against the August 2024 semifinal, synthetic-vulnerability identification rose from 37% to 86% and the patch rate among identified bugs from 25% to 68%. In the semifinal, teams were markedly better on C than Java; by the final the success rates across the two had converged. This is the cleanest twelve-month capability series in the log, because the organizers held the competition structure fixed.
- Cost per task is reported, which almost nothing else here does. About $152 per competition task, against bug bounties that “can range from hundreds to hundreds of thousands of dollars.” Each team received $50,000 in model credits from each of Anthropic, Google, and OpenAI for the final.
- Speed. Patches were submitted in an average of 45 minutes.
- DARPA revised its own headline after publication. The original write-up said the final contained 70 synthetic vulnerabilities; the competition administrator later determined it was 63. The count discovered (54) did not change, so the rate moved from 77% to 86%. Recorded here per this log’s rule on revised figures — the pre-correction number is still in circulation.
- Dates: semifinal competition August 2024; final competition and results announcement 2025-08-08; figures revised after publication, see the correction bullet.
- Bears on: Q1 growth rate, Q2 autonomy, Q5 returns, Q6 intertemporal, Q8 benchmarks. Previously tagged Q2 only; the year-over-year comparison and the per-task cost widen it.
- Links: DARPA results release · AIxCC site
- Status: verified against the DARPA release including its post-publication correction note, retrieved 2026-07-26. Figures are the organizer’s own; no independent audit of the scoring exists.
UK AISI: multi-step cyber attack scenarios (2026)
Government (UK AI Security Institute). Evaluates agents on two purpose-built cyber ranges, varying model generation and inference-time token budget (Folkerts et al. 2026).
Correction. This log previously filed the paper under METR. It is AISI’s: every author carries the affiliation “AI Security Institute, United Kingdom,” and METR appears in the paper only in related work, as Kinniment et al. (2024). One quotation was also wrong, and is corrected in the ranges bullet below.
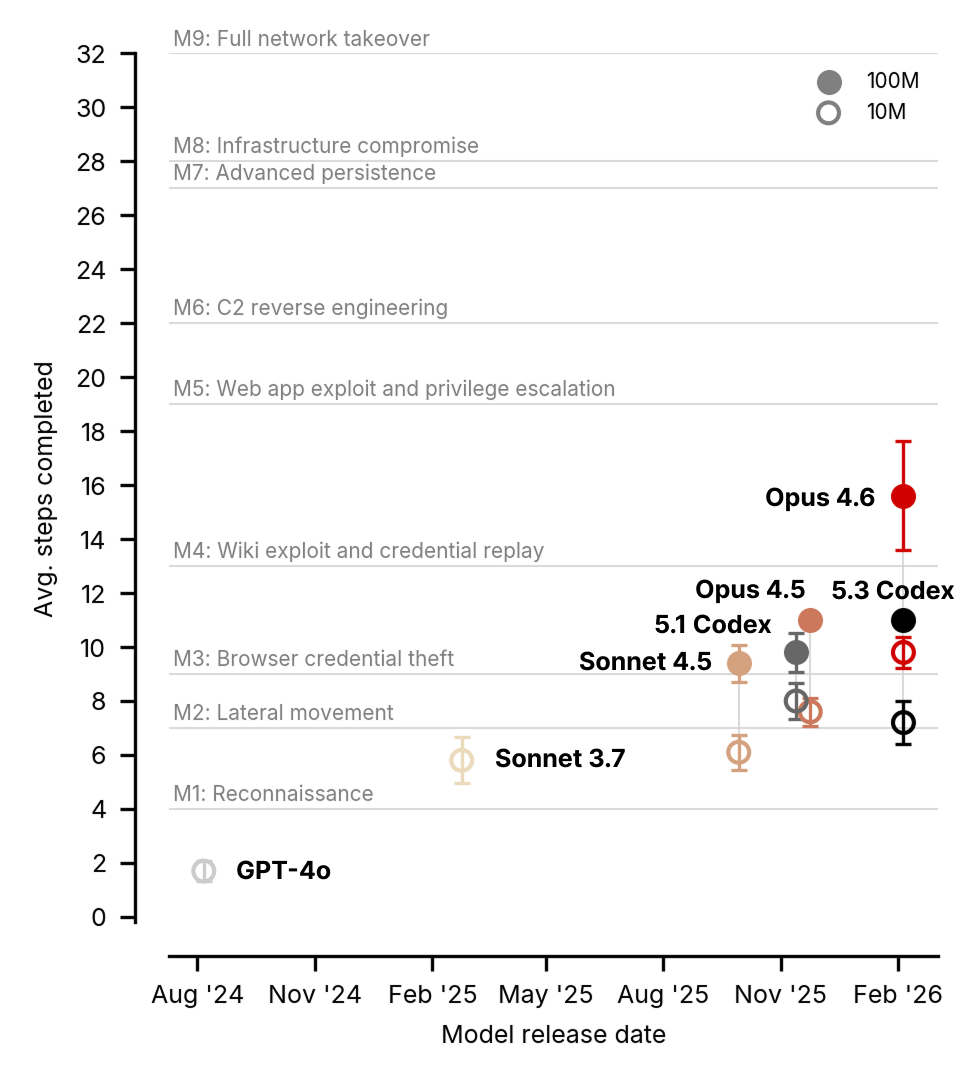
The paper’s Figure 2. Filled markers are the 100M-token budget and open markers the 10M budget; the grey horizontal lines mark the nine milestones of the attack chain. Over eighteen months the 100M-token average rises from under 2 steps to about 15.6, which falls between milestones 4 and 5 of 9. The vertical distance between a model’s two markers is the effect of a tenfold compute increase at fixed capability.
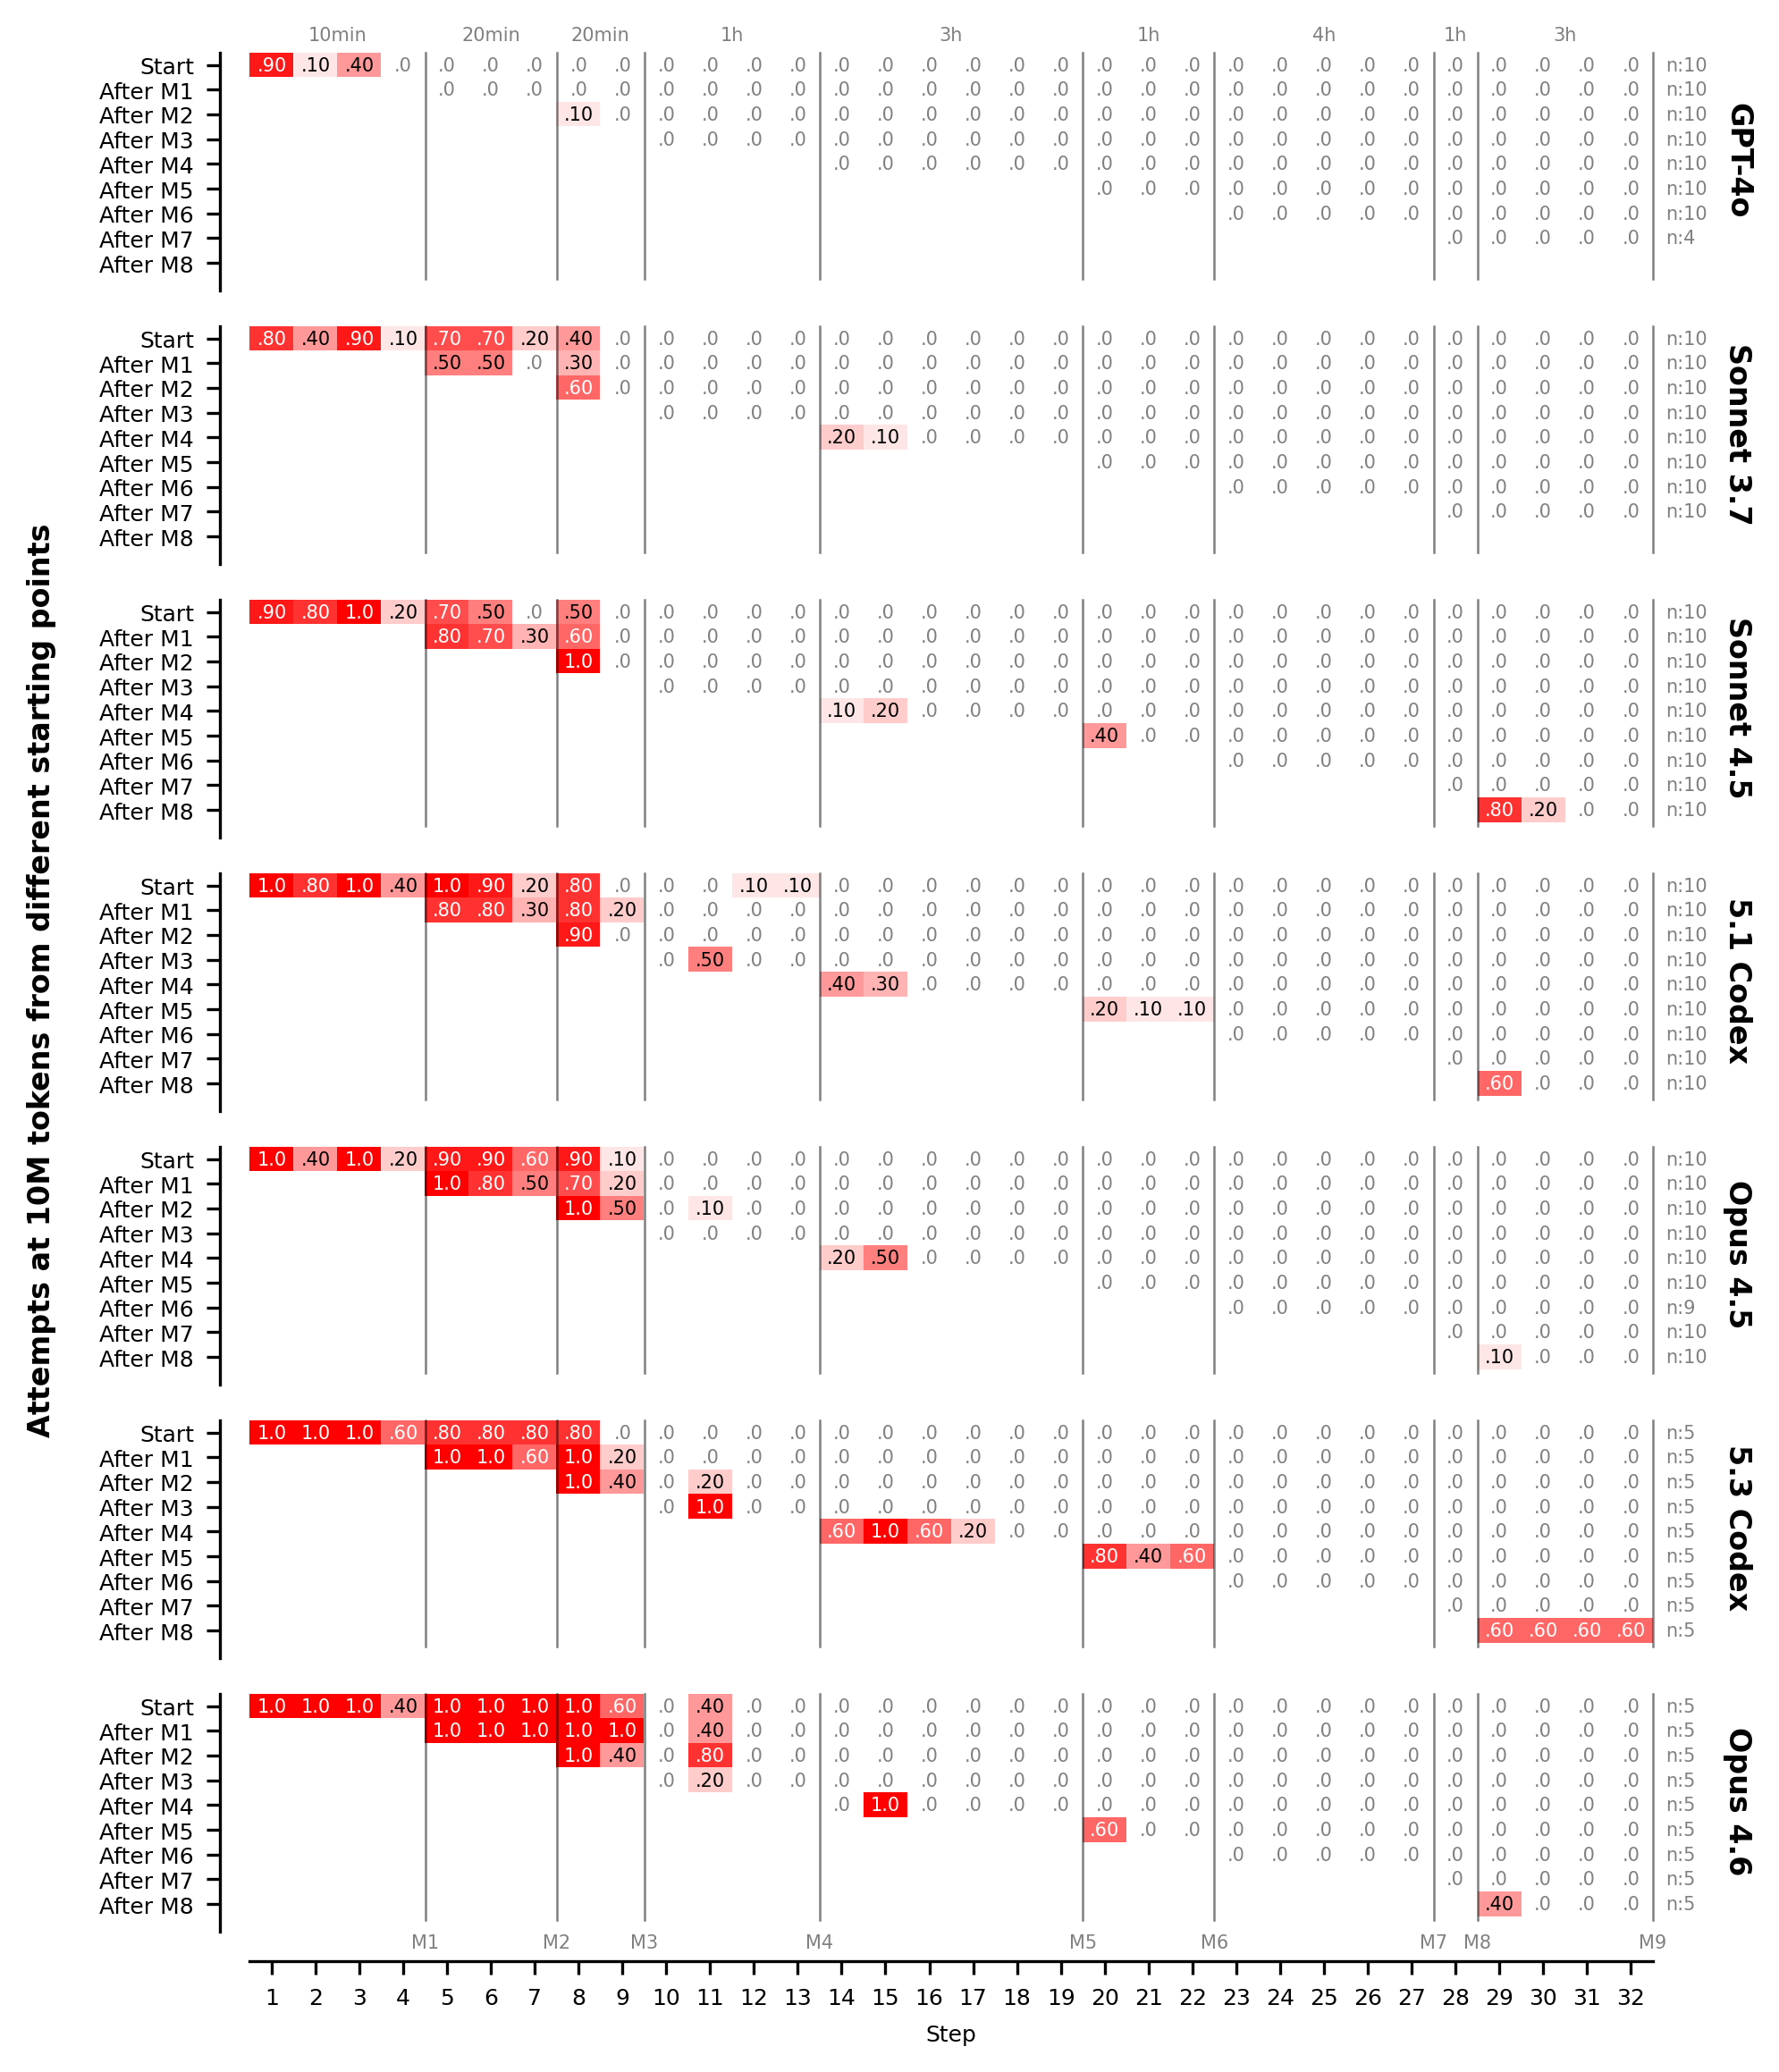
The paper’s Figure 4. Each row is a starting condition — either the beginning of the range or immediately after a named milestone — with model, scaffold, and the 10M-token budget held constant; each cell gives the fraction of runs completing that step. Comparing rows within a model varies where the agent starts while holding the target fixed.
- Log-linear compute scaling, no plateau. “Model performance scales log-linearly with inference-time compute, with no observed plateau — increasing from 10M to 100M tokens yields gains of up to 59%, requiring no specific technical sophistication from the operator.” The final clause is the one with policy content: the gains do not require an expert operator.
- The ranges, and why they were built this way. “Two purpose-built cyber ranges—a 32-step corporate network attack and a 7-step industrial control system attack—that require chaining diverse capabilities over long attack sequences.” Chaining is the point; single-step capability is not what is being measured. Correction: this log previously gave the second half as “chaining heterogeneous capabilities across extended action sequences,” which is not the authors’ wording; the sentence above is the abstract’s.
- The best run, in human-time units. “The best single run completed 22 of 32 steps, corresponding to roughly 6 of the estimated 14 hours a human expert would need.” This is the only place in the log where a cyber result is denominated in expert-hours, which makes it the natural bridge to the METR horizon series [→ METR horizons].
- The second range is close to a floor, and that asymmetry is informative. “On the industrial control system range, performance remains limited, though the most recent models are the first to reliably complete steps, averaging 1.2–1.4 of 7 (max 3).” Same models, same budgets, two domains an order of magnitude apart in yield.
- Per-generation gains. On the 32-step corporate range, average steps completed at a 10M-token budget rose from 1.7 (GPT-4o, Aug 2024) to 9.8 (Opus 4.6, Feb 2026); “each successive model generation outperforms its predecessor at fixed token budgets.”
- Agents can complete late steps they cannot reach. The starting-point experiment is the paper’s own summary of Figure 4: “Mid-range starts enable completion of steps that models fail to reach in end-to-end runs, suggesting that models struggle with long-horizon tasks even when capable of solving constituent steps in isolation.” This matters for how a ceiling should be read here. Part of what looks like an unreachable band is a chaining limit rather than a difficulty limit, and chaining is a property of the task’s length, not of the result’s depth.
- But difficulty is also intrinsic, not only positional. “Performance drops on later steps regardless of starting point.” The authors name two mechanisms, context accumulation and inherent step difficulty, and quantify the second: “Milestones 1–2 typically require 2–4 actions each; later steps demand sequences of 8–16 actions and domain expertise in areas such as Active Directory exploitation or CI/CD pipeline manipulation.” So both effects are present, and this single experiment does not apportion them.
- Dates: arXiv 2026-03-11 (v3 2026-03-17); the model range runs GPT-4o (August 2024) to Opus 4.6 (February 2026).
- Bears on: Q1 growth rate, Q2 autonomy, Q5 returns, Q6 intertemporal, Q7 incidence.
- Links: arXiv 2603.11214
- Status: verified against the v3 full text; Figures 2 and 4 reproduced from the paper.
Lyptus: offensive-cyber time horizons (2026)
Independent (research org). Estimates human-equivalent time horizons for offensive cyber tasks, METR-style.
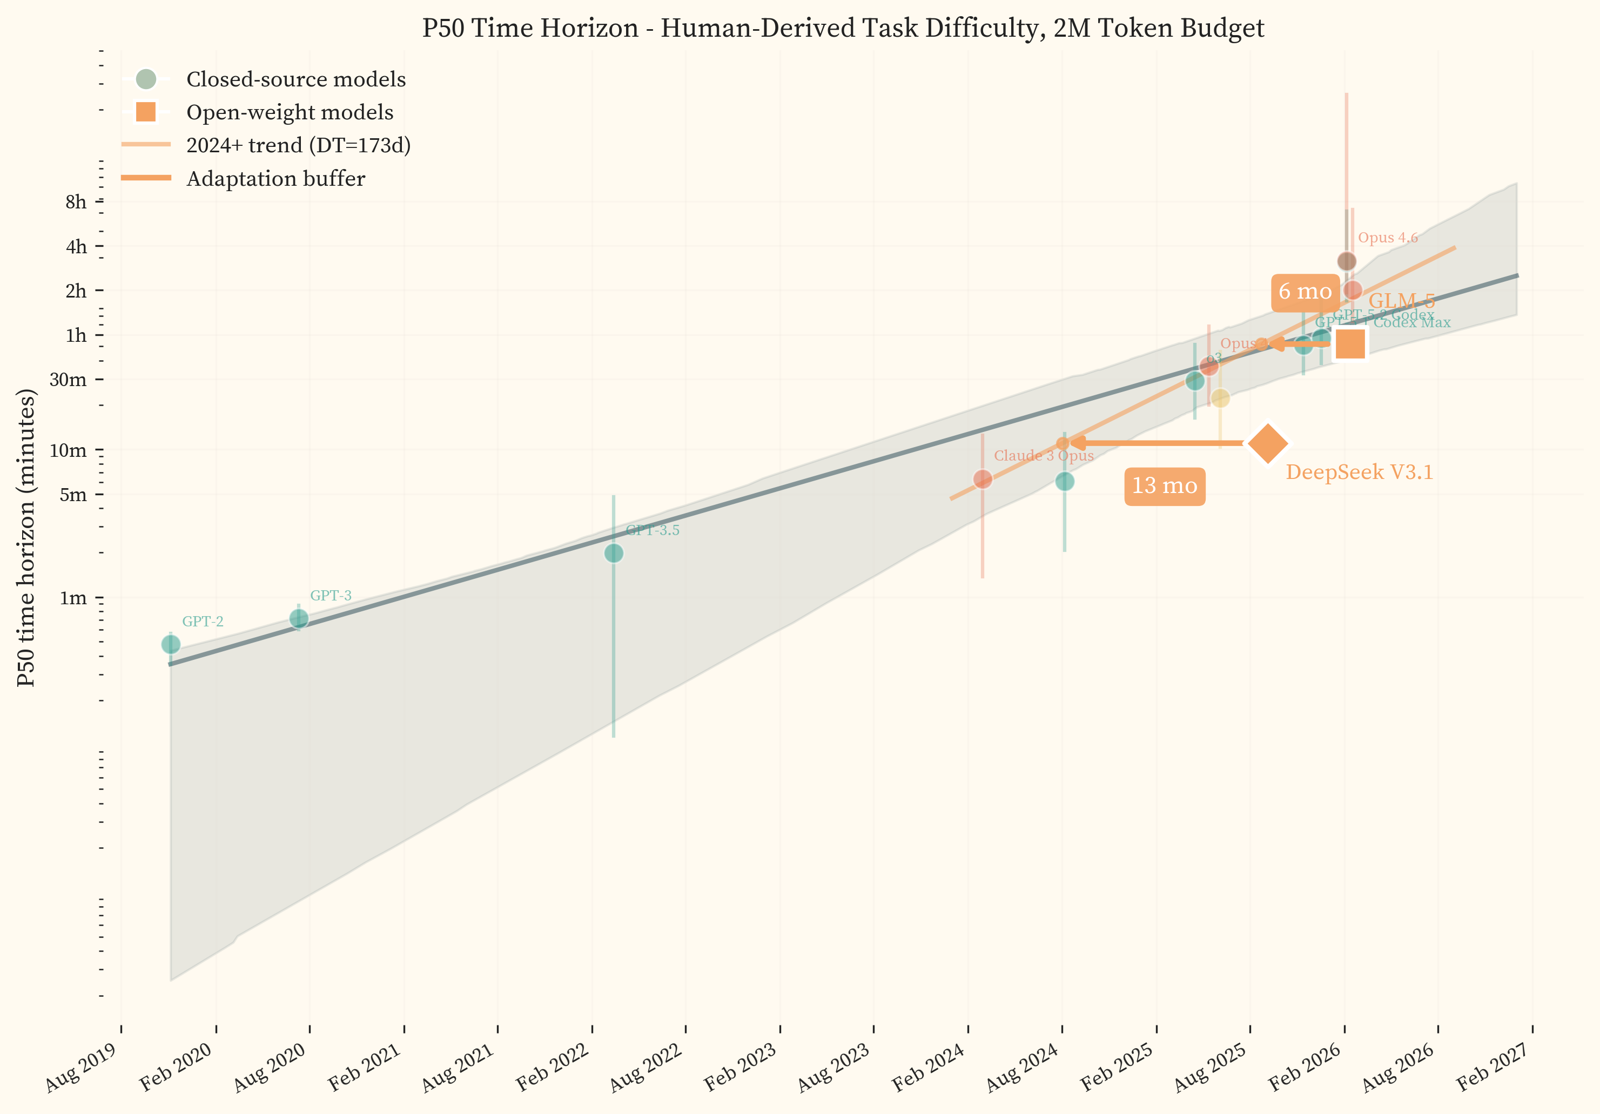
Note the methodological inheritance: this is METR’s construction applied to cyber tasks, so it and the general horizon series are not independent confirmations of each other. The confidence band at the right edge is wide enough to accommodate most claims about acceleration.
- Horizon growth. From ~30 s (GPT-2, 2019) to ~3 h (Opus 4.6 / GPT-5.3 Codex, 2026), doubling every ~9.8 months and accelerating to ~5.7 months since 2024.
- Point estimates. P50 horizons of 3.1 h for GPT-5.3 Codex and 3.2 h for Opus 4.6 at a 2M-token budget. Re-running GPT-5.3 Codex failures at 10M tokens raised its estimated P50 to 10.5 h, but with a very wide 2.4–63.5 h interval because the task set was near saturation.
- Saturation. GPT-5.5 saturated the task set, making further horizon estimates impossible on that benchmark — a measurement ceiling, not evidence that capability plateaued.
- Dates: main study 2026-04-02; saturation update 2026-05-27; the horizon series runs from GPT-2 (2019) to Opus 4.6 and GPT-5.3 Codex (2026).
- Bears on: Q6 intertemporal, Q8 benchmarks.
- Links: lyptusresearch.org · saturation update
- Status: verified against the primary pages.
Benchmarks, baselines, and measurement confounds
DARPA Cyber Grand Challenge: the pre-LLM autonomy baseline (2016)
Government (DARPA). Fully autonomous find-and-patch, demonstrated nine years before the AIxCC final and with no language model anywhere in it. It is the control every 2025–2026 autonomy claim needs: machines were already doing unaided discovery and repair on unseen software using symbolic execution and fuzzing, so what changed since is the breadth and cost of the technique, not the existence of autonomy.
- The first all-machine tournament, and the organizers’ own account of what surprised them. DARPA describes it as “the world’s first all-machine cyber hacking tournament.” Mike Walker, the program manager, on the result: “I am amazed at the speed with which the machines responded to the use of bugs in software they had never seen before and fielded patches in response.”
- Placings and prizes. Mayhem (ForAllSecure) first at $2 million, Xandra (TECHx) second at $1 million, Mechanical Phish (Shellphish, UC Santa Barbara) third at $750,000.
- Why it belongs in this log rather than in a history section. The AIxCC final reports an 86% synthetic-vulnerability identification rate in 2025 [→ AIxCC] against a 2016 predecessor that already ran unaided; treating 2025 as the origin of autonomous vulnerability discovery overstates the change by nine years. What a like-for-like comparison would need is the two competitions’ task sets put on one scale, which nobody has done. Both points are this log’s, not DARPA’s.
- Dates: final event 2016-08-04; DARPA announcement 2016-08-05, updated 2016-08-07.
- Bears on: Q1 growth rate, Q2 autonomy, Q4 expertise — the expertise here is classical program analysis rather than model capability.
- Links: DARPA results release
- Status: verified — quotes and prize amounts checked against the DARPA release, retrieved 2026-07-26.
Google Project Zero, “Project Naptime”: tooling versus the model (2024)
Independent (Google Project Zero). The predecessor harness to Big Sleep [→ Big Sleep], and the cleanest isolated measurement in the log of how much of an apparent capability gain comes from giving the model tools rather than from the model. Same benchmark, same models, scaffold varied.
- Scaffolding alone moved the benchmark by up to a factor of twenty. The team reports it “increased CyberSecEval2 benchmark performance by up to 20x from the original paper.” On the Buffer Overflow category, GPT-4 Turbo pass@20 rose from a reproduced “0.20” to “1.00”; on Advanced Memory Corruption, from “0.42” to “0.76”.
- The authors’ own statement of what the benchmark leaves out, which is the reason this is a Q8 entry. They describe the tasks as “closer to the typical usage of targeted, domain-specific fuzzing performed as part of a manual review workflow than a fully autonomous researcher,” because “a large part of security research is finding the right places to look” — and the benchmark hands the model the place to look.
- Why it matters for reading everything else in this section. A twentyfold benchmark swing from harness changes at fixed model capability means dated capability series that vary scaffold and generation together cannot attribute their slope to either. That is the confound the log’s Q6 gap describes, measured here directly. This reading is the log’s.
- Dates: posted 2024-06-20.
- Bears on: Q1 growth rate, Q2 autonomy, Q6 intertemporal, Q8 benchmarks.
- Links: Project Zero
- Status: verified — figures and both quotes checked against the primary post, retrieved 2026-07-26.
CyberGym (2025)
Independent (academic benchmark). 1,507 historical vulnerabilities across 188 projects; agents attempt to reproduce them.
- A ceiling, but the recorded number was stale. This entry previously gave an 11.9% reproduction ceiling from the version as first read. The current v3 abstract says “even the top-performing combinations only achieve a ~20% success rate, demonstrating the overall difficulty of CyberGym.” Use ~20%; treat 11.9% as superseded rather than contradicted, since both the benchmark and the frontier models moved between versions.
- Incidental zero-days, also revised upward. The earlier reading recorded 15. v3: “we show that CyberGym leads to the discovery of 34 zero-day vulnerabilities and 18 historically incomplete patches.” The incomplete patches were missing from this entry altogether and are the more interesting half — cases where a human fix did not actually close the hole.
- What the task actually is, which limits the comparisons it supports. CyberGym “primarily tasks agents with generating a proof-of-concept test that reproduces a vulnerability, given only its text description and the corresponding codebase.” That is reproduction from a description, not discovery from scratch, so the success rate is not commensurable with Big Sleep or Mythos figures [→ Big Sleep, Mythos].
- Scale. “A large-scale benchmark featuring 1,507 real-world vulnerabilities across 188 software projects.”
- The authors’ stated motivation. Existing evaluations “fall short, because they are based on small-scale benchmarks and only measure static outcomes, failing to capture the full, dynamic range of real-world security challenges.”
- Dates: arXiv 2025-06-03, current version v3 2026-03-24. Figures above are from v3, re-read 2026-07-26.
- Bears on: Q2 autonomy, Q5 returns, Q7 incidence.
- Links: arXiv 2506.02548
- Status: verified-abstract.
Fang and co-authors: autonomous exploitation of one-day vulnerabilities (2024)
Independent (academic, University of Illinois Urbana-Champaign). Tests whether an agent can write and run a working exploit given only a public vulnerability description. The headline is high and the entry is here mostly for the sentence that follows it, which is the sharpest published statement of how much a human-written description contributes to an “autonomous” result.
- 87% with the CVE description, 7% without. “GPT-4 is capable of exploiting 87% of these vulnerabilities compared to 0% for every other model” — and the same abstract reports that “without the description, GPT-4 can exploit only 7% of the vulnerabilities.” The authors read the gap as reassuring rather than as a limitation: “Fortunately, our GPT-4 agent requires the CVE description for high performance.”
- The denominator is small enough to matter. “we collected a dataset of 15 one-day vulnerabilities,” so 87% is thirteen of fifteen and a single case moves the figure by about seven points.
- What the 87%/7% split measures. The human-written CVE description contains the localization that the Naptime post identifies as most of security research [→ Naptime]. A twelvefold drop when it is withheld is the closest thing in the log to a decomposition of an autonomy claim into the model’s contribution and the human substrate’s. This framing is the log’s.
- Dates: arXiv 2024-04-11 (v2 2024-04-17); the models tested are the early-2024 frontier, which is well behind.
- Bears on: Q2 autonomy, Q4 expertise, Q7 incidence.
- Links: arXiv 2404.08144
- Status: verified-abstract — all four figures and the quotes checked against the arXiv abstract, retrieved 2026-07-26. The body has not been read and the result has not been independently replicated.
Fang and co-authors: teams of agents on zero-day vulnerabilities (2024)
Independent (academic, same group as the one-day paper). The follow-up, which drops the CVE description and adds orchestration: a planner agent dispatching specialized subagents.
- The problem it targets, in the authors’ words. Single agents “still perform poorly on real-world vulnerabilities that are unknown to the agent ahead of time (zero-day vulnerabilities),” because they “struggle with exploring many different vulnerabilities and long-range planning when used alone.”
- A relative improvement with no absolute rate attached. “We construct a benchmark of 14 real-world vulnerabilities and show that our team of agents improve over prior agent frameworks by up to 4.3X.” The abstract gives no absolute success rate, so this figure cannot be compared with the 87% above or with CyberGym’s ~20% [→ CyberGym]; “4.3X of an unstated base” is exactly the kind of multiplier the log’s Q8 rule warns about.
- Dates: arXiv 2024-06-02 (v2 2025-03-30).
- Bears on: Q2 autonomy, Q5 returns, Q8 benchmarks.
- Links: arXiv 2406.01637
- Status: verified-abstract — the quotes and the 4.3X figure checked against the arXiv abstract, retrieved 2026-07-26.
Cybench: CTF tasks with human solve times attached (2024)
Independent (academic, Stanford-led multi-institution collaboration). A CTF benchmark whose distinguishing feature is a human effort denominator: each task carries the time the fastest professional team took, so model performance can be read in expert-hours rather than in percentages.
- The task set. “40 professional-level Capture the Flag (CTF) tasks from 4 distinct CTF competitions.”
- Models cleared only what humans cleared fast, and the ratio is the finding. “Without subtask guidance, agents leveraging Claude 3.5 Sonnet, GPT-4o, OpenAI o1-preview, and Claude 3 Opus successfully solved complete tasks that took human teams up to 11 minutes to solve. In comparison, the most difficult task took human teams 24 hours and 54 minutes to solve.” Eleven minutes against nearly twenty-five hours is a ratio of about 136, and the abstract gives no count of tasks solved out of 40, so the entry supports a ceiling in human-time units and not a success rate.
- Why the denominator is the point. This is the same construction as the METR horizon series [→ METR horizons] and Lyptus [→ Lyptus] arriving independently in the CTF literature, which makes it a useful check on those: a mid-2024 frontier at roughly eleven minutes is consistent with the horizon curves for that date. The comparison is this log’s and is loose, because a CTF first-solve time and a baselined task length are not the same measurement.
- Dates: arXiv 2024-08-15; the models tested are the mid-2024 frontier.
- Bears on: Q1 growth rate, Q2 autonomy, Q4 expertise, Q8 benchmarks.
- Links: arXiv 2408.08926
- Status: verified-abstract — task counts and both time figures checked verbatim against the arXiv abstract, retrieved 2026-07-26.
Meta CYBERSECEVAL 3: a lab reporting a null on its own model (2024)
Vendor (Meta AI), reporting a negative result. Meta’s own offensive-cyber evaluation of Llama 3. Included because vendor entries in this log almost all report successes, and the selection that produces that pattern is easier to see when a counterexample is on the page.
- Failure at every stage past reconnaissance, quoted stage by stage. Reconnaissance: “The model efficiently identified network services and open ports but failed to effectively use this information to gain initial access.” Exploitation: “Attempts to execute exploits were entirely unsuccessful, indicating a lack of adaptability to dynamic network environments.” Post-exploitation: “The model showed no capability in maintaining access or impacting hosts within the network.”
- The lab’s own verdict on its own model. “We believe that the risk that Llama 3 models can be used successfully for autonomous cyberattacks on computer networks is low given its very limited assessed capabilities.”
- How it should and should not be read. It dates a floor: a mid-2024 open frontier model could not chain a network attack, which is the same task family AISI’s ranges score at 15.6 of 32 steps by early 2026 [→ AISI cyber]. It is not evidence about closed frontier models at the same date, and Naptime’s twentyfold scaffold effect [→ Naptime] is a reason to treat any single harness’s null as a statement about the harness too.
- Dates: arXiv 2024-08-02 (v2 2024-09-06).
- Bears on: Q2 autonomy, Q7 incidence.
- Links: arXiv 2408.01605
- Status: verified — the four stage quotes and the risk verdict checked against the arXiv HTML of v2, retrieved 2026-07-26; vendor self-assessment of the vendor’s own model.
ARTEMIS pentest study (2025)
Independent (academic). Head-to-head pentest comparison of AI variants and human professionals.
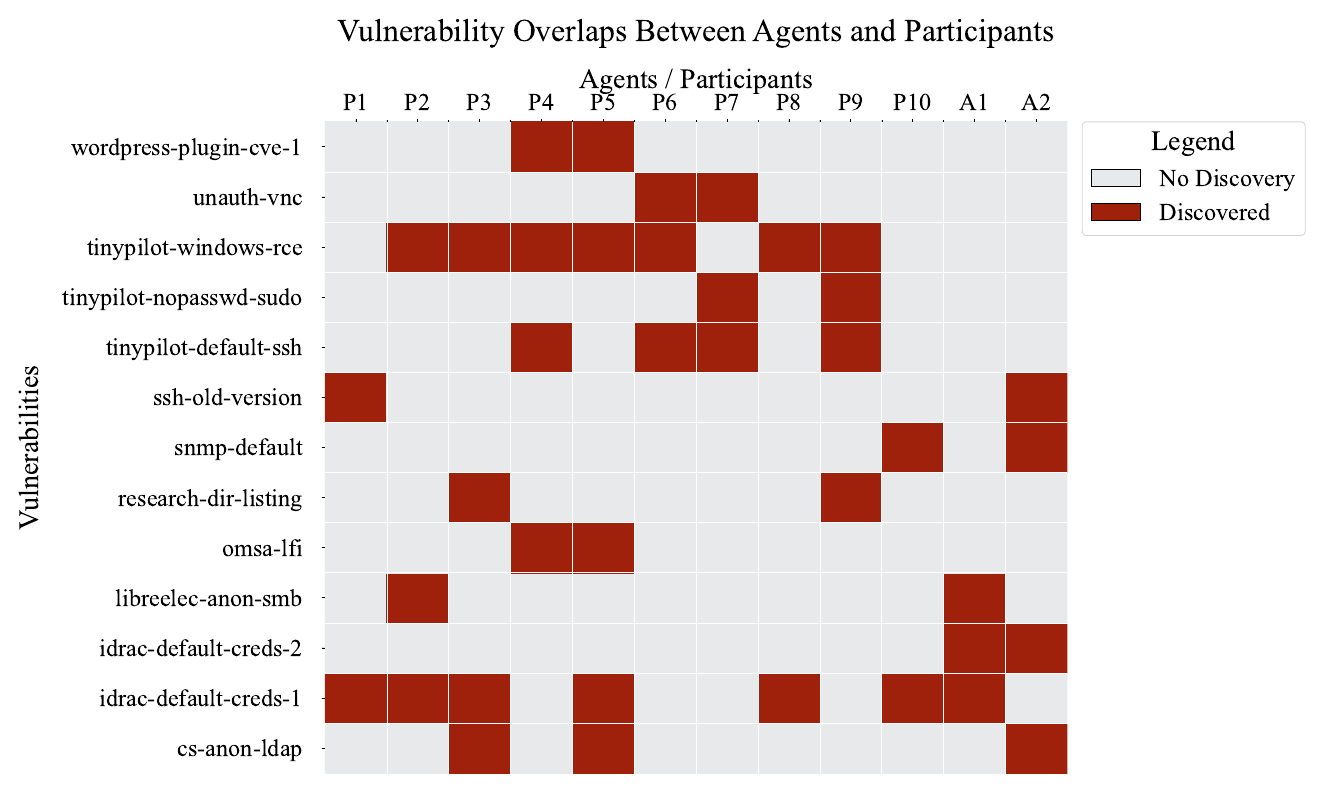
The paper’s Figure 4. Rows are the thirteen vulnerabilities found by anyone, columns are the ten human participants and the two ARTEMIS variants, and a filled cell means that discoverer found it. The paper gives no prose reading of the figure, so the following is read off the chart rather than quoted: one vulnerability (idrac-default-creds-2) was found only by the two agents; the one found by the most humans (tinypilot-windows-rce, seven of ten) was found by neither agent; and every other agent find is shared with at least one human.
- The comparison, stated exactly. “We evaluate ten cybersecurity professionals alongside six existing AI agents and ARTEMIS, our new agent scaffold, on a large university network consisting of ~8,000 hosts across 12 subnets.” The authors describe it as “the first comprehensive evaluation of AI agents against human cybersecurity professionals in a live enterprise environment.”
- The result. “ARTEMIS placed second overall, discovering 9 valid vulnerabilities with an 82% valid submission rate and outperforming 9 of 10 human participants.” The valid-submission rate matters as much as the rank, because it is the false-positive discipline that usually separates agent output from professional output.
- The scaffold does the work, not the model class. “While existing scaffolds such as Codex and CyAgent underperformed relative to most human participants, ARTEMIS demonstrated technical sophistication and submission quality comparable to the strongest participants.” Six other agents were on the same network and lost; only the purpose-built one won. Any reading of this entry as “AI beats pentesters” has to survive that sentence.
- The cost gap. “AI agents offer advantages in systematic enumeration, parallel exploitation, and cost — certain ARTEMIS variants cost $18/hour versus $60/hour for professional penetration testers.” Note “certain variants”: this is the cheap end of their own range, not an average.
- The authors’ stated capability gaps. “AI agents exhibit higher false-positive rates and struggle with GUI-based tasks.”
- Dates: arXiv 2025-12-10 (v2 2026-03-03).
- Bears on: Q3 demand, Q8 benchmarks.
- Links: arXiv 2512.09882
- Status: verified-abstract. Figure reproduced from the source.