Open Labs
Scaling curves, experiments, and final runs at open AI labs
Preface
This is an internal METR reference on how open AI labs turn experiments into final training runs. Each lab chapter uses the same figures, built from data/*.csv, so the cross-lab chapter can overlay them. The scope, lab tiers, and decisions are in the repository README.
Data availability at a glance
What we would ideally have from every lab, against what each lab has actually published. Grades: ● published in a usable form, ◐ partial (stated for some releases, derived from stated numbers, or figure-only), ○ not published. Evidence and sources are in data/notes/*.md and the lab chapters. “Multiple generations” asks whether successive releases from the same lab let recipe improvement be measured; “attribution” asks whether per-stage scores and per-stage compute both exist for one model.
| Lab | Total spend, incl. people | Pretraining scaling curves | Post-training / RL curves | Multiple generations | Broad capability benchmarks | Attribution: pre- vs post-training |
|---|---|---|---|---|---|---|
| Marin | ◐ FTEs and funders named; no dollars, no compute total | ● Delphi IsoFLOP grid with per-run data; MoE and LR laws; every run on public W&B | ◐ No RL; one public SFT data-scaling sweep (256 to 50k examples, 2026) | ● 8B, 32B, Snowball 67B-A2B, 535B-A23B | ◐ 19-task base suite; not on ECI | ◐ SFT compute separable; base and instruct scored on different suites |
| Ai2 OLMo | ◐ Audited GPU-hours, 82% development; no dollars or staff count | ● OLMo ladder with fitted laws; W&B logs and checkpoints for finals | ○ RLVR hours reported, no curve | ● OLMo 1, 2, 3, 3.1, Hybrid | ● Broad suite; ECI not checked | ● Scores and GPU-hours per stage for one model |
| Meta Llama | ◐ GPU-hours per release; whole-project hours for Llama 1 only | ◐ Llama 3 IsoFLOP ladder, figure-only | ○ Described, no curves or compute | ● Llama 1 to 4; base MMLU comparable 1 to 3 | ● Full suite; 3.1 405B on ECI | ◐ Base and instruct scores; no post-training compute |
| DeepSeek | ◐ Dollar cost of the V3 and R1 final runs; experiments excluded | ◐ IsoFLOP suite and laws for DeepSeek LLM only; loss law figure-only | ◐ R1 step curves, figure-only | ● Seven releases, LLM to V4 | ● Broad suite; V2, V3, R1 on ECI | ● Base vs chat scores; post-training hours for V3 and R1 |
| Prime Intellect | ◐ Funding rounds; no GPU-hours for any RL run | ◐ OpenDiLoCo ladder; no law | ◐ Richest RL ablations, with failures; figure-only, no law | ◐ Five releases on three different base models | ● AIME, GPQA, LiveCodeBench, HLE; ECI not checked | ◐ Base-vs-post deltas; RL compute derived; base from another lab |
| EleutherAI Pythia | ◐ A100-hours incl. the discarded suite; no dollars | ● 70M to 12B ladder, 154 checkpoints each, W&B; no lab fit | ○ None | ◐ v0 to v1 fix only | ◐ Small-model suite; no MMLU | ○ No post-training |
| Cerebras-GPT | ◐ FLOPs per model; no hours or dollars | ● Fitted law, validated on the 13B; no logs | ○ None | ○ Single release | ◐ Small-model suite; no MMLU | ○ No post-training |
Three things stand out. Nobody publishes total spend including people: the closest are OLMo’s audited GPU-hours and DeepSeek’s dollar figures for two final runs, and both exclude experiments and salaries. Post-training scaling curves barely exist in public; Prime Intellect’s ablations and DeepSeek R1’s step curves are figure-only. Attribution of capability to pre- versus post-training is cleanest where a lab reports both per-stage scores and per-stage compute for one model, which today means OLMo and DeepSeek.
Evidence behind the grades, one line per lab (sources in the notes files):
- Marin. Team size stated (1 to 10 FTE), funders named (Google TRC, Huang Foundation); compute exists only as our 6ND estimates (6.1e23 for 8B, 1.2e24 for 32B). Delphi is an 81-run IsoFLOP grid with per-run losses released; MoE and learning-rate laws are given in closed form; every 8B and 32B phase and discarded run is on public W&B. The 8B instruct model is SFT-only (5.3B tokens against 12.7T), and base and instruct are scored on different suites, so there is no clean post-training delta. Post-training’s one public curve is a 2026 SFT sweep (issue 3956): the 8B and 32B bases fine-tuned on 256 to 50k OpenThoughts-4 math examples from eight teacher models, every fine-tune scored on AIME, AMC, HMMT and MATH500 as W&B runs; no RL curve.
- Ai2 OLMo. Morrison et al. 2026 audit the Olmo 3 pipeline at 8.34M GPU-hours with 82 percent in development, broken down by stage; no dollars, staff count or salaries. The OLMo ladder (16 runs) publishes a fitted law per task; Olmo Hybrid adds a 7-size, 3-architecture ladder; the ladder’s own W&B project is private. Per-stage scores (base, SFT, DPO, RLVR) and per-stage GPU-hours exist for the same 32B model, the cleanest attribution in the table.
- Meta Llama. GPU-hours per release (39.3M H100-hours for Llama 3); only Llama 1 states a whole-project figure (about 6M A100-hours, roughly 70 percent outside the shipped runs). The Llama 3 IsoFLOP ladder spans 6e18 to 1e22 FLOPs with a fitted exponent of 0.53, but is figure-only with run counts never stated; Llama 4 has no report. Base and instruct scores exist for the same models; post-training compute is never reported.
- DeepSeek. V3’s 2.788M H800-hours ($5.58M) and R1’s 147K ($294K) are the most precise final-run costs anywhere, split by stage and explicitly excluding experiments; author counts run 86 to 318. The DeepSeek LLM paper gives a hyperparameter law, an IsoFLOP suite of about 80 runs and fitted allocation exponents, but the loss law is figure-only, and later generations publish fixed-scale ablations only. R1’s AIME-versus-GRPO-step curves are figures. Base and chat scores are reported every generation; V3.2 states post-training above 10 percent of pretraining cost.
- Prime Intellect. Funding rounds ($5.5M, $15M, $130M) and headcount snippets; no GPU-hours or cost for any RL run. The RL ablation record (async delay, difficulty filtering, clipping, collapse modes, with failures) is the richest here but figure-only, from private W&B, with no fitted law. Each release starts from a different base model (own 10B, QwQ-32B, GLM-4.5-Air), so recipe gains and pretraining spend are not attributable to the lab.
- EleutherAI Pythia. 272K A100-hours for the released suite and 544K including the discarded first version; training compute donated by Stability AI. The suite is a 70M to 12B ladder on identical data with 154 checkpoints per model and public W&B logs; the lab fits no law. No post-training.
- Cerebras-GPT. Training FLOPs per model (3.1e22 in total) but no accelerator-hours or dollars. Seven compute-optimal sizes with the lab’s own fitted law, validated out of sample on the 13B, plus a muP arm; figures and model-card losses only, no logs. Single release, no post-training.
Releases on one compute scale
Every released model in the book on one timeline, one row per lab, circle area proportional to training compute. Filled circles are models pretrained from scratch, sized by pretraining compute; hollow orange circles are post-training-only releases on an existing base, sized by the post-training compute; models a lab released on the same day sit as concentric circles. Compute is in FLOPs: the lab’s stated figure where there is one, otherwise 6ND from stated parameters and tokens, and for post-training-only releases GPU-hours converted at 40 percent utilisation of an H100-class chip. The dollar figures in the key assume $2 per H100-hour and cover accelerator time only. The rows are in data/releases.csv, with the basis and confidence of every number.
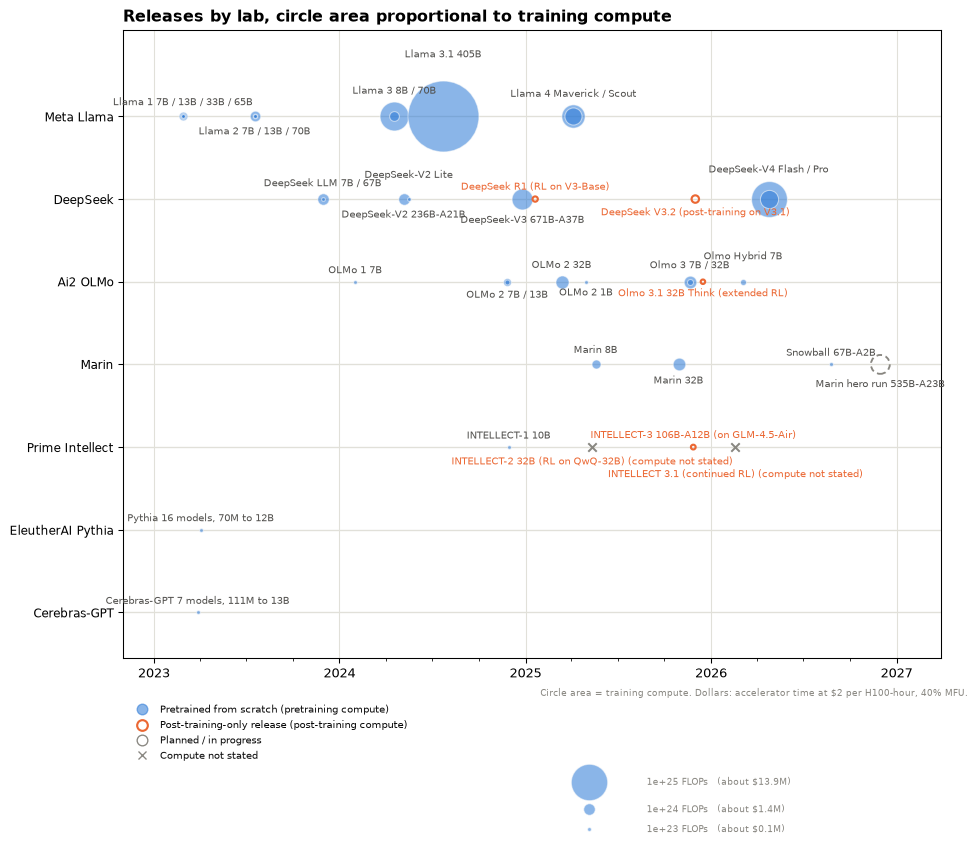
The picture is the scale problem in one image. Llama 3.1 405B alone is about twenty times the compute of every model Marin, Pythia and Cerebras have released put together, and the reference suites are dots at this scale. It also shows two release rhythms: Meta and DeepSeek ship a generation every six to twelve months at rising compute, while the open labs ship more often, at one to two orders of magnitude less, and change recipe between releases. The circles do not include experiments, which for Olmo 3 were over four times the final runs by GPU-hours, nor people.
Reading the figures. Every chapter opens with a scaling curve: training compute on a log x-axis, loss or a benchmark on the y-axis, experimental runs as dots, the released model(s) as stars, and a power law fitted to the experiments only, extrapolated out to where the final run landed. The gap between star and line is how well the lab’s experiments predicted its big run. The compute-split bar under it is the cheap number: what share of logged compute went to experiments rather than the final run. It is always a lower bound, because failed and unlogged runs are missing.
Confidence flags. Every number in the data carries reported (stated by the lab), derived (computed from reported numbers, method in the row), or guess (read off a figure). Chapters state the flag wherever a number changes a conclusion.